Upstox Originals
Indian markets: Navigating global trends

4 min read | Updated on March 17, 2025, 14:32 IST


SUMMARY
So far in 2025, Indian markets have moved differently from global peers, with domestic markets facing a decline while most global markets have seen gains. On a potentially optimistic note, India's Nifty 500 has breached its key 50-week moving average, even as the S&P 500 has remained resilient. What does this mean for India’s markets? Could this signal a rebound, or will the decline continue?

So far in 2025, key global markets are positive, while Indian markets have corrected
The performance of India's equity markets, represented by the headline index Nifty and broader Nifty 500 index, has recently diverged significantly from several major global benchmarks. Amid global market volatility and mixed investor sentiment in 2025, tracking relative performance provides valuable insights into market dynamics and investor risk appetite.
YTD relative comaprision of select global indices
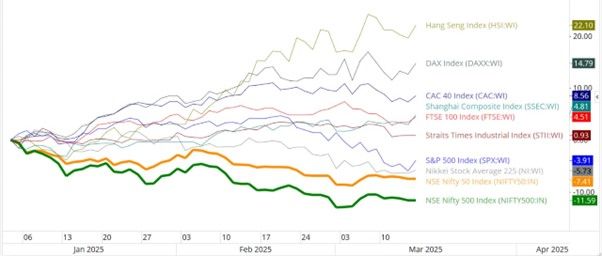
Soure: Optuma; YTD: March 14, 2025 close
Analysing the relative comparison chart reveals that both the Nifty 50 and the broader Nifty 500 Index have significantly underperformed compared to global peers on a Year-to-Date (YTD; March 14, 2025 close) basis. The Nifty 50 Index has declined by ~7.4%, while the Nifty 500 has experienced an even steeper fall of ~11.6%.
In contrast, global indices such as the Hang Seng Index (Hong Kong; +22.1%), DAX Index (Germany; +14.8%), and CAC 40 (France; +8.6%) have exhibited robust positive performance. Importantly, even other indices facing headwinds, such as the FTSE 100 (UK; +4.5%) and Shanghai Composite (China; +4.8%), remained in positive territory.
The relative underperformance of Indian equities signals domestic headwinds, possibly driven by persistent inflation concerns, muted corporate earnings outlook, or investor apprehension amid global uncertainties fueled by overall growth concerns, tariff/trade war, etc.
Global equity markets: Relative Strength and Rotation Analysis
The Relative Rotation Graph (RRG) illustrates the relative strength and momentum of global indices benchmarked against the MSCI World Index. Notably, European indices such as CAC40, Hang Seng, DAX, and FTSE 100 are currently positioned in the leading quadrant, suggesting they are likely to maintain their relative outperformance.
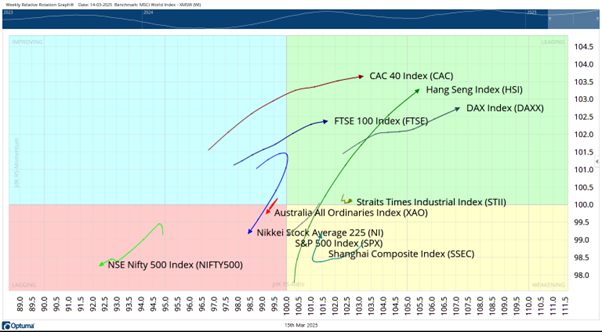
However, the Straits Times Index (Singapore), also within the leading quadrant, shows signs of weakening momentum and risks slipping into the weakening quadrant.
Conversely, the Shanghai Composite, though presently in the weakening quadrant, has begun improving its relative momentum. The S&P 500 remains within the weakening quadrant, indicating potential challenges in relative performance.
Significantly, the broader NSE Nifty 500 Index languishes firmly within the lagging quadrant, suggesting continued underperformance relative to global peers. Japan's Nikkei and Australia's ASX indices have recently transitioned into the lagging quadrant, signaling potential further relative weakness.
India-USA: Divergence opens room for catch-up
In the chart below, we look at the performance of India’s Nifty 500 and USA’s S&P500 indices (top half of the chart). Technically, the Nifty 500 has breached its critical 50-week moving average earlier this year (blue line), reflecting underlying weakness, while the S&P 500 has only recently tested this same moving average.
This divergence suggests potential scope for Indian equities to stage a catch-up rally if global sentiments improve and domestic market conditions stabilise, re-aligning the relative performance and strengthening the correlation between these two major markets.
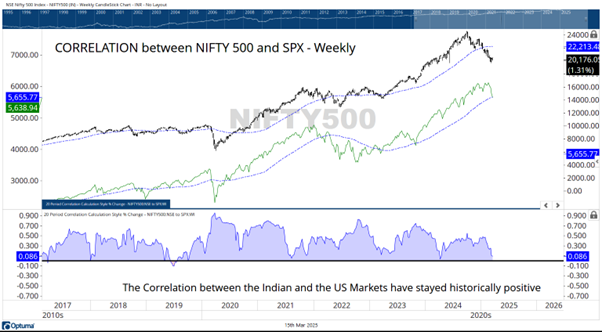
The bottom half of the chart illustrates the historical correlation between these indices, highlighting that these markets have predominantly exhibited a positive correlation over the past decade. Apart from a brief dip into a negative correlation during 2019, the relationship has consistently remained positive.
The correlation has recently moderated from strongly positive to moderately positive, primarily due to the relative underperformance of Indian markets compared to their U.S. counterparts.
Nifty’s technical outlook
The chart illustrates Nifty’s recent technical dynamics, highlighting the critical role of its weekly moving averages (MA). At the start of 2025, the Nifty decisively breached the crucial 50-week MA, currently placed at 23,797, disrupting the previously strong primary uptrend. According to basic technical principles, this MA, once violated, transforms into a significant resistance level. Consequently, any near-term upward move could encounter substantial selling pressure near this resistance.
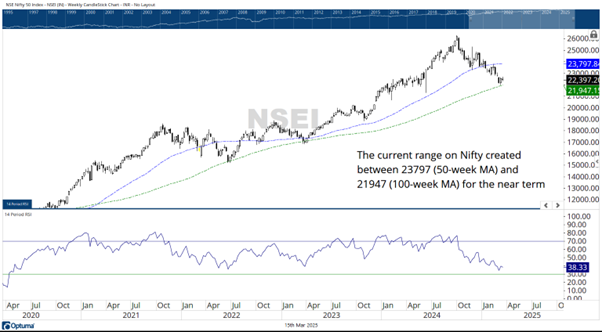
Conversely, the Nifty recently tested and successfully defended its 100-week MA at approximately 21,947, a historically significant support that facilitated rebounds twice over recent years. Presently, the 21,900-22,000 zone is pivotal; if the index sustains above this level, a technical rebound is plausible within the broader trading range defined by these two moving averages.
In conclusion, traders should closely monitor the defined boundaries—particularly the 100-week MA support—to gauge Nifty’s directional cues in the near term, acknowledging the market's cautious sentiment.
About The Author
Next Story

