Personal Finance News
Gold price history 1970 to 2025: Insights from Mumbai vs London trends over 55 years

7 min read | Updated on December 04, 2025, 09:38 IST


SUMMARY
When gold prices in London rise, Mumbai rates tend to follow, and vice versa. This curve has remained the same across 55 years. This is, of course, because Mumbai ultimately follows the global benchmark, even with its domestic demand.

Gold prices in India are currently 5.8% higher than in England (UK).
Did you know gold used to cost ₹185 per 10 gram in 1970? That's right. ₹185, which is technically how much we spend on a cup of coffee at a cafe now.
The significant upward trajectory of gold prices throughout the last few decades, and its exponential growth in 2025, has once again placed gold at the top of global economic analyses, especially with record-high demand from central banks.
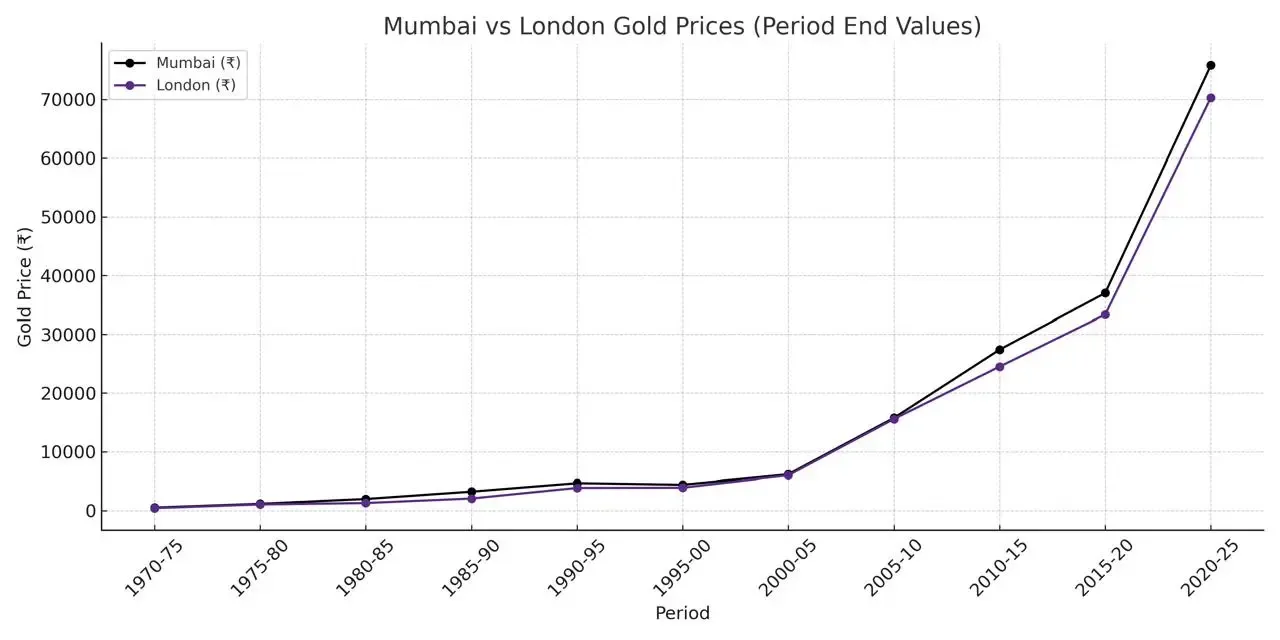
Interestingly, since the 1970s, gold prices in Mumbai (India) and London (United Kingdom) have moved one behind the other. However, India has always led the charts, with Mumbai gold prices consistently remaining above London yellow metal prices, according to RBI data.
Let’s look at gold prices in Mumbai and London over the last 55 years to understand this better.
Gold prices in Mumbai vs London
| Year | Mumbai (₹ per 10 gm) | London (₹ per 10 gm) | Difference (₹) |
|---|---|---|---|
| 2024-25 | 75,841.87 | 70,315.41 | 5,526.46 |
| 2023-24 | 60,623.95 | 52,684.42 | 7,939.53 |
| 2022-23 | 52,730.77 | 46,605.74 | 6,125.03 |
| 2021-22 | 47,999.25 | 43,582.25 | 4,417.00 |
| 2020-21 | 48,723.22 | 43,541.00 | 5,182.22 |
| 2019-20 | 37,017.91 | 33,346.53 | 3,670.54 |
| 2018-19 | 31,193.41 | 28,380.36 | 2,813.04 |
| 2017-18 | 29,300.08 | 26,618.55 | 2,681.52 |
| 2016-17 | 29,665.28 | 27,116.42 | 2,548.87 |
| 2015-16 | 26,534.26 | 24,231.53 | 2,302.73 |
| 2014-15 | 27,414.55 | 24,520.42 | 2,894.13 |
| 2013-14 | 29,190.39 | 25,739.35 | 3,451.04 |
| 2012-13 | 30,163.93 | 28,919.04 | 1,244.89 |
| 2011-12 | 25,722.12 | 25,394.03 | 328.39 |
| 2010-11 | 19,227.08 | 18,937.48 | 289.60 |
| 2009-10 | 15,756.09 | 15,569.88 | 186.22 |
| 2008-09 | 12,889.74 | 12,816.81 | 72.93 |
| 2007-08 | 9,995.62 | 9,897.12 | 98.50 |
| 2006-07 | 9,240.32 | 9,137.79 | 102.53 |
| 2005-06 | 6,900.56 | 6,790.26 | 110.31 |
| 2004-05 | 6,145.38 | 5,976.14 | 169.24 |
| 2003-04 | 5,718.95 | 5,573.53 | 145.41 |
| 2002-03 | 5,332.36 | 5,062.11 | 270.25 |
| 2001-02 | 4,579.12 | 4,260.23 | 318.89 |
| 2000-01 | 4,473.60 | 4,007.79 | 465.54 |
| 1999-00 | 4,393.56 | 3,896.66 | 496.90 |
| 1998-99 | 4,268.17 | 3,952.25 | 316.08 |
| 1997-98 | 4,347.07 | 3,775.92 | 571.15 |
| 1996-97 | 5,070.71 | 4,285.60 | 785.12 |
| 1995-96 | 4,957.60 | 4,188.58 | 769.03 |
| 1994-95 | 4,667.24 | 3,864.15 | 803.09 |
| 1993-94 | 4,531.87 | 3,766.28 | 765.58 |
| 1992-93 | 4,103.66 | 3,339.95 | 763.71 |
| 1991-92 | 4,297.63 | 2,841.07 | 1,456.56 |
| 1990-91 | 3,451.52 | 2,164.26 | 1,287.26 |
| 1989-90 | 3,229.33 | 2,063.01 | 1,166.32 |
| 1988-89 | 3,175.22 | 1,960.38 | 1,214.84 |
| 1987-88 | 3,082.43 | 1,912.54 | 1,169.89 |
| 1986-87 | 2,323.49 | 1,577.02 | 746.46 |
| 1985-86 | 2,125.47 | 1,289.76 | 835.71 |
| 1984-85 | 1,983.92 | 1,293.78 | 690.13 |
| 1983-84 | 1,858.47 | 1,314.32 | 544.15 |
| 1982-83 | 1,722.54 | 1,250.38 | 472.16 |
| 1981-82 | 1,719.17 | 1,209.94 | 509.23 |
| 1980-81 | 1,522.44 | 1,484.67 | 37.76 |
| 1979-80 | 1,158.75 | 1,052.88 | 105.87 |
| 1978-79 | 791.22 | 550.12 | 241.10 |
| 1977-78 | 637.93 | 433.83 | 204.10 |
| 1976-77 | 549.82 | 369.59 | 180.23 |
| 1975-76 | 545.21 | 415.79 | 129.42 |
| 1974-75 | 519.19 | 424.73 | 94.46 |
| 1973-74 | 369.33 | 291.17 | 78.16 |
| 1972-73 | 242.57 | 160.31 | 82.26 |
| 1971-72 | 200.16 | 103.33 | 96.83 |
| 1970-71 | 184.96 | 89.44 | 95.52 |
Key insights
- From 1970-75 to 2020-25, Mumbai gold prices remained higher than London gold prices.
1970–75:
- Mumbai: ₹184 to ₹519
- London: ₹89 to ₹424
- Mumbai stays higher throughout.
2005–10:
- Mumbai: ₹6,900 to ₹15,756
- London: ₹6,790 to ₹15,569
- Minimal difference, but India still leads.
2020–25:
- Mumbai: ₹48,723 to ₹75,842
- London: ₹43,541 to ₹70,315
- India remains ahead.
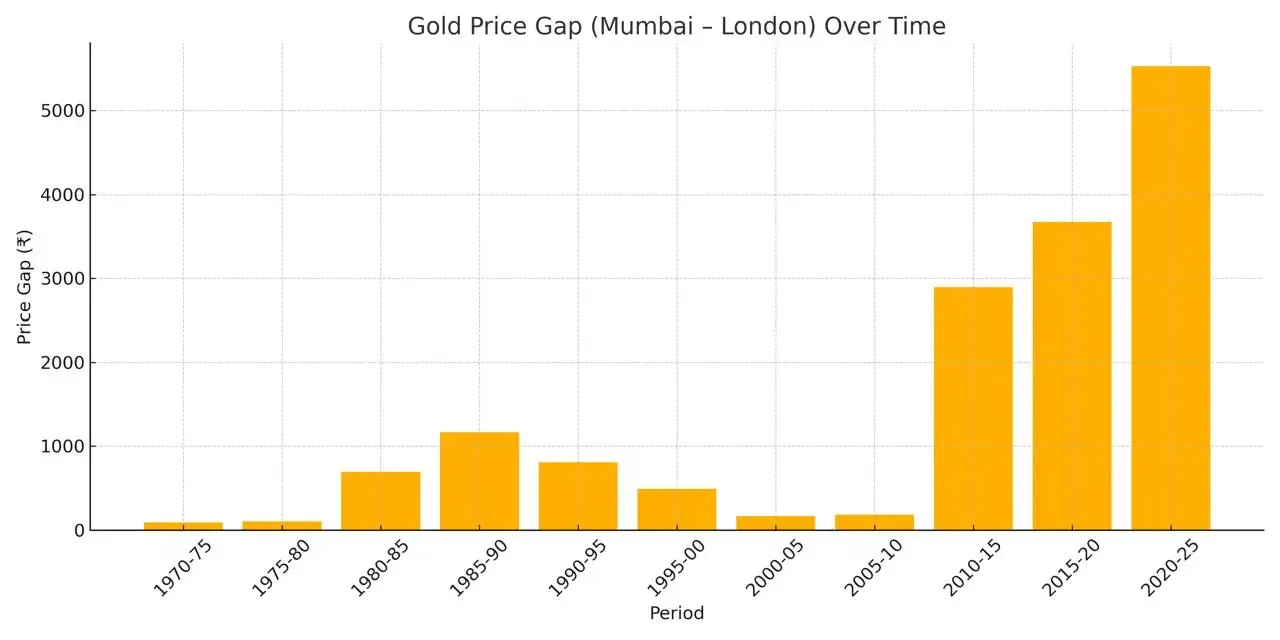
This shows that even when international gold prices move sharply, prices in India manage to remain elevated. This is not just because of investor interest in the country, but also because gold has great traditional and cultural value.
Gold is an important part of many religious ceremonies across the country, which is why gold jumps during Diwali and the wedding season.
- While there’s always a gap, and domestic prices (Mumbai) remain above London, both markets still move in the same direction.
When London rises, Mumbai grows too, and vice versa. This curve has remained the same across 55 years. This is, of course, because Mumbai ultimately follows the global benchmark, even with its domestic demand.
-
It can be noticed that the gap between Mumbai and London prices widened over time, mainly because of factors like internal duties, rupee movement and strengthening of gold regulations in India. More importantly, over the years, the purchasing power of Indians increased, and so did their investing appetite, boosting gold demand.
-
A very important factor to note is that Indians have always paid a premium for physical gold, mainly due to making charges for jewellery and heavy fluctuations in demand. The high domestic demand depicts that while the trend, direction and timing are all the same, just the prices in India are higher.
India also has a huge import dependency for gold. In October 2025, India imported gold worth $14.7 billion, up nearly 200% from October 2024, as per official government data. High festive demand, consistent premium for Indian buyers and import dependency have kept gold prices elevated in the country.
Current gold prices
The trajectory of gold over the last 55 years is indeed interesting, but it’s still not as shiny as its journey in 2025. Currently, gold prices in India (Mumbai) are at around ₹1,30,000 per 10 gram. Compared to 2024-25 (around ₹75,800 per 10 gram), gold prices are up 71.5%.
Similarly, gold prices in London (England) are trading around ₹1,22,800 per 10 gram. Compared to nearly ₹70,300 per 10 gram last year, gold prices are up 74.6%.
Interestingly, the gap between India and UK gold prices now stands at around ₹7,200, up significantly from ₹5,526.46 last year. Gold prices in India are currently 5.8% more than in England (UK).
Factors behind the rally:
- Rising geopolitical and trade tensions
- US tariff concerns
- Recession fears
- US government shutdown
- Increased central bank gold buying
- High festive demand in India
- Market volatility
- Interest rate concerns (repo, US)
On top of this, the rupee hit its all-time low today (December 3), crossing the 90-mark against the US dollar. A weak rupee creates uncertainty and tension in the domestic markets, supporting bullion prices.
Gold in India and London moves together, and in the same direction, but India’s price premium has widened again in 2025 on the back of strong domestic demand, import duties, gold buying by the Reserve Bank of India (RBI) and an overall sentiment of rushing to safety around the globe.
Related News

About The Author
Next Story


