Market News
Week ahead: Auto sales, US jobs data, China stimulus and Powell speech are among key market triggers to watch
.png)
7 min read | Updated on September 30, 2024, 08:17 IST
SUMMARY
The NIFTY50 index formed a bullish candlestick on the weekly chart, closing above the previous week's high. The highest put base is at the 26,000 level, signalling strong support at this level. As long as the index holds above this zone, the bullish trend is likely to continue.

Auto sales, US jobs data and Powell's speech to shape market trends
Markets extended the winning streak for the third consecutive week and closed at fresh record high, led by positive global cues and gains in metals and automobile stocks. The NIFTY50 index captured the 26,000 mark on closing basis in nearly two months, its second fastest rally of 1000 points.
The sharp momentum in the benchmark index was aided by broad based rally across sectors, with Metals (+7.0%), Oil & Gas (+5.0%) and Automobiles (+4.6) advancing the most. However, the broader markets remained subdued for the second week in a row. The NIFTY Midcap 100 index ended with the gains of 0.2%, while the Smallcap 100 index
Index breadth- NIFTY50
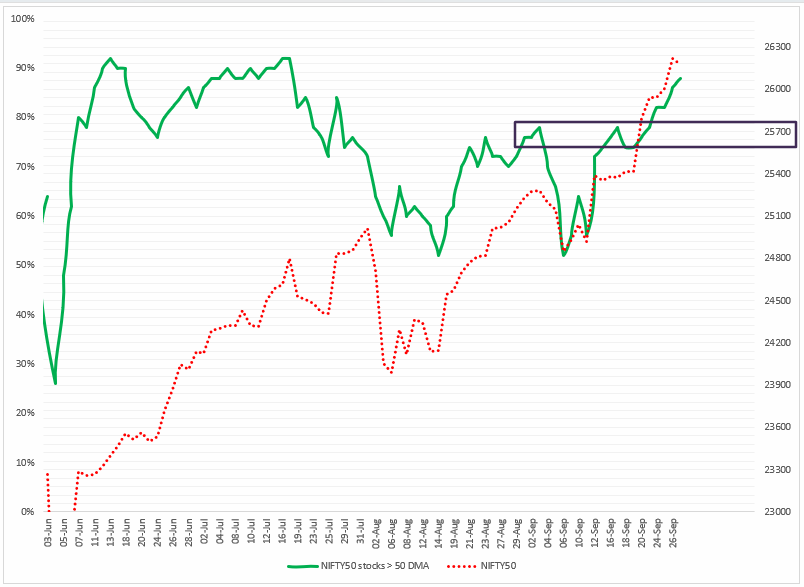
The NIFTY50 index maintained a positive breadth throughout the week with an average of 83% of NIFTY50 stocks trading above their 50-day moving average. In our last week’s blog, we informed our users that if the green lines, representing the NIFTY50 stocks above their 50 DMA, crosses the 78% mark, the index could further extend its gains.
Currently, the breadth indicator is showing the reading of 88% and is inching closer to the previous two peaks of 92%. If the reading crosses the 90% mark, we advise our readers to closely monitor the price action around all-time high levels and remain cautious of profit-booking.
FIIs positioning in the index
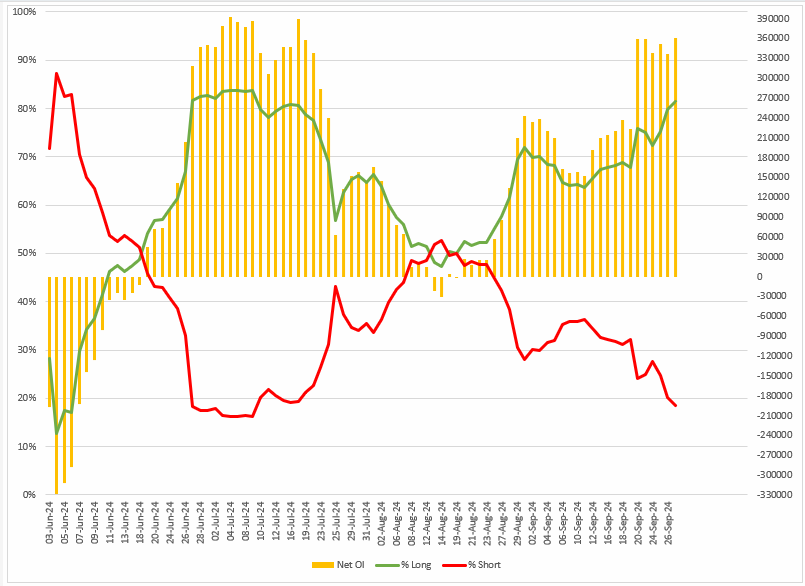
The Foreign Institutional Investors (FIIs) sustained their bullish bets in the index futures throughout the week, extending the open interest long-to-short ratio from 75:25 to 81:19. Moreover, the FIIs have started the October series with the long-to-short-ratio of 81:19, indicating a bullish stance in index futures.
F&O - NIFTY50 outlook
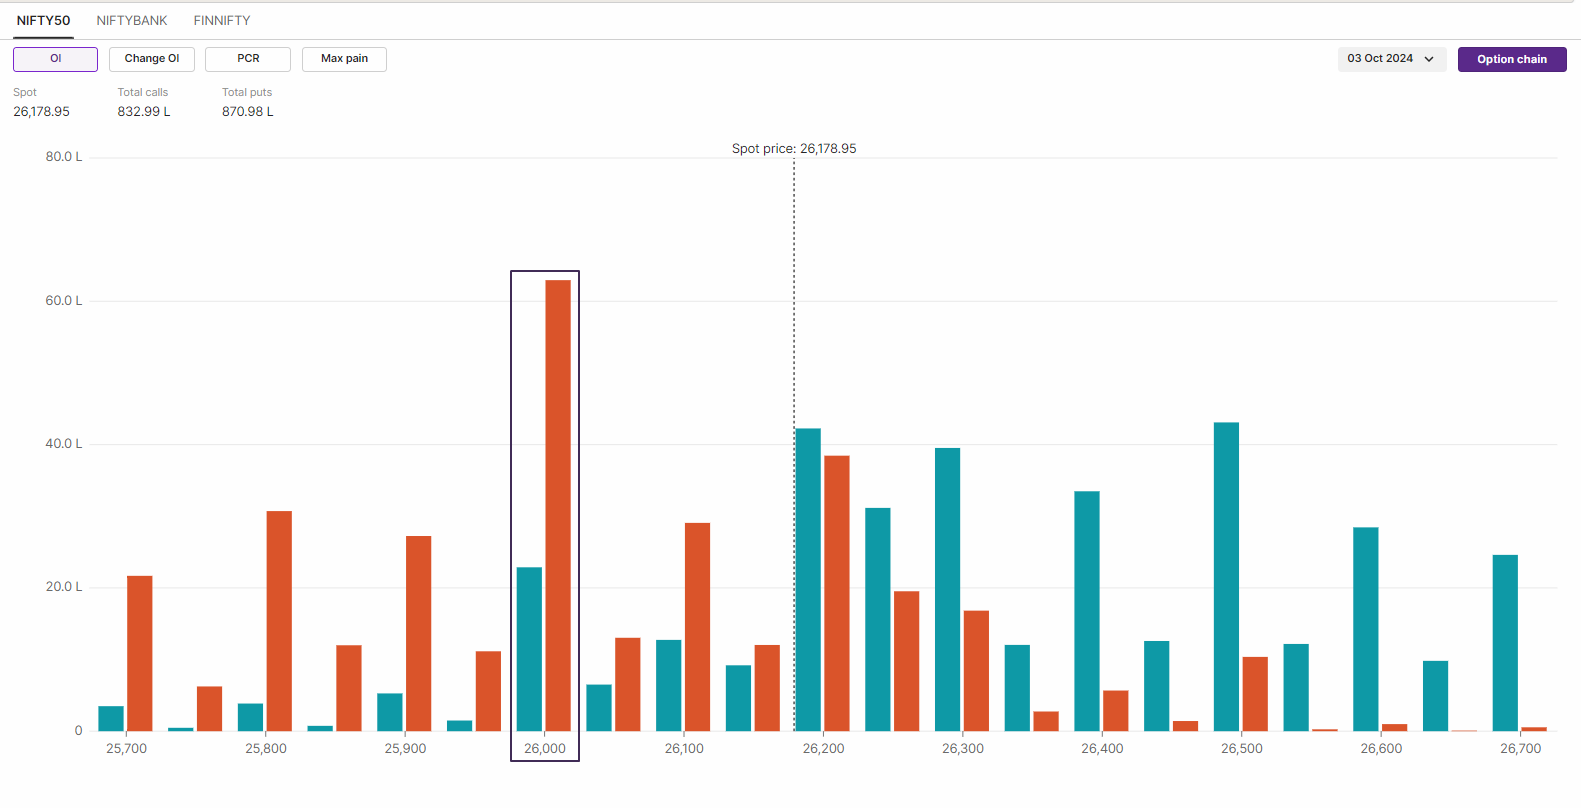
The open interest data for the NIFTY50’s 3 October expiry has highest put base around 26,000 strike, indicating support for the index around this zone. On the flip side, the immediate call base was seen at 26,500 strike, with smaller volume, hinting that index may face resistance around this area.
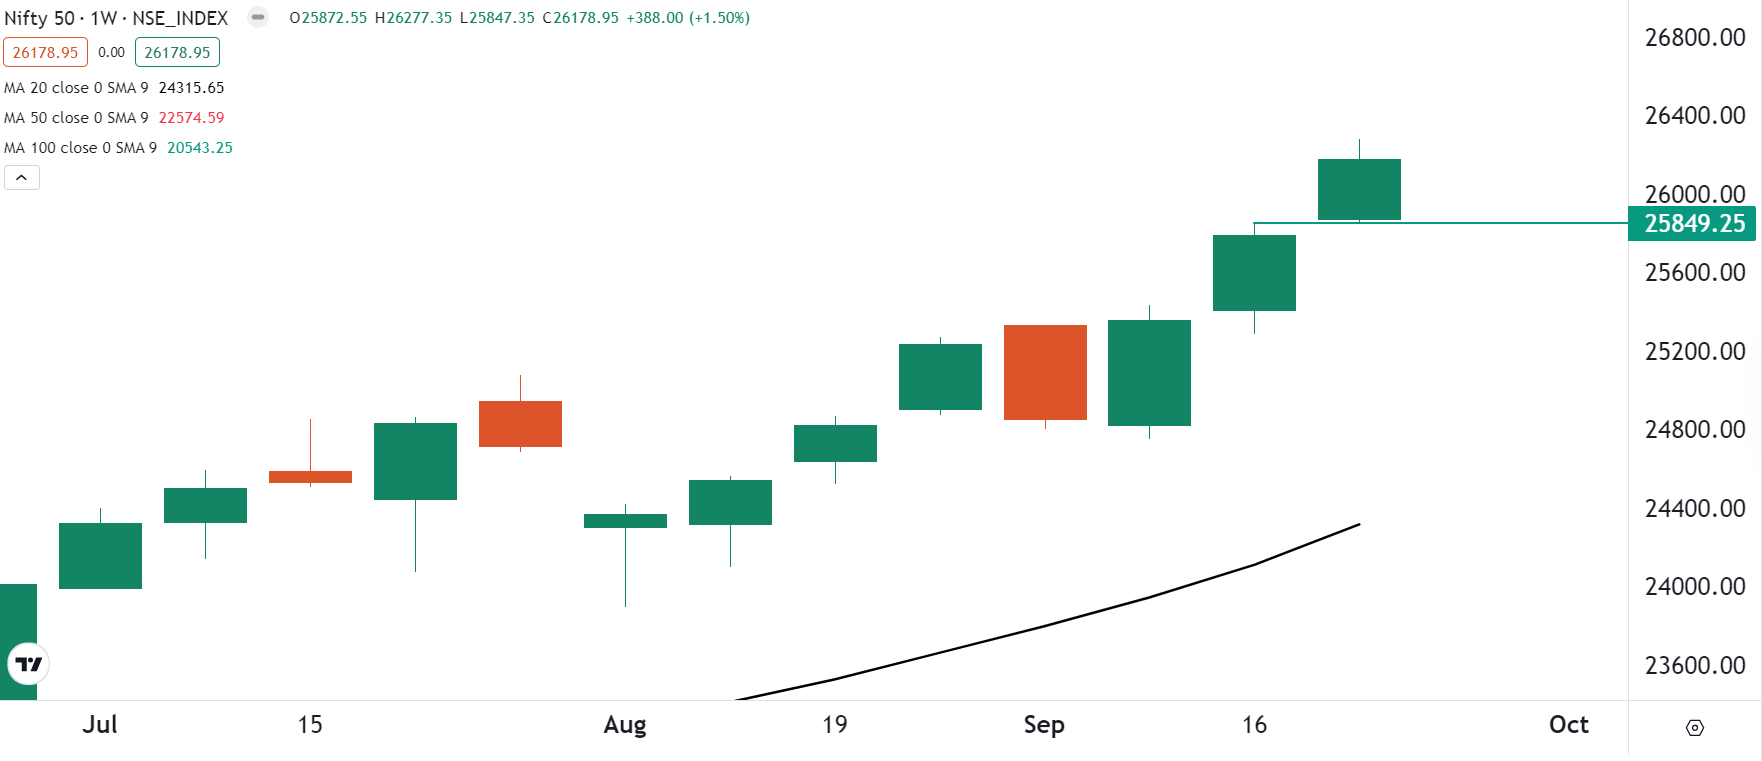
On the technical front, the index closed above previous week’s high extending the bullish momentum for the third week. As seen on the chart below, the index has formed three consecutive strong bullish candles on the weekly chart and has rallied nearly 6% in last three weeks.
In the upcoming sessions, the broader trend of the index may remain bullish with immediate support in the range of 25,900 zone and the crucial support in the zone of 25,500 and 25,700. Unless the index slips below the 25,900 zone, the trend may remain bullish. However, a close below this zone may signal weakness and range-bound activity.
F&O - BANK NIFTY outlook
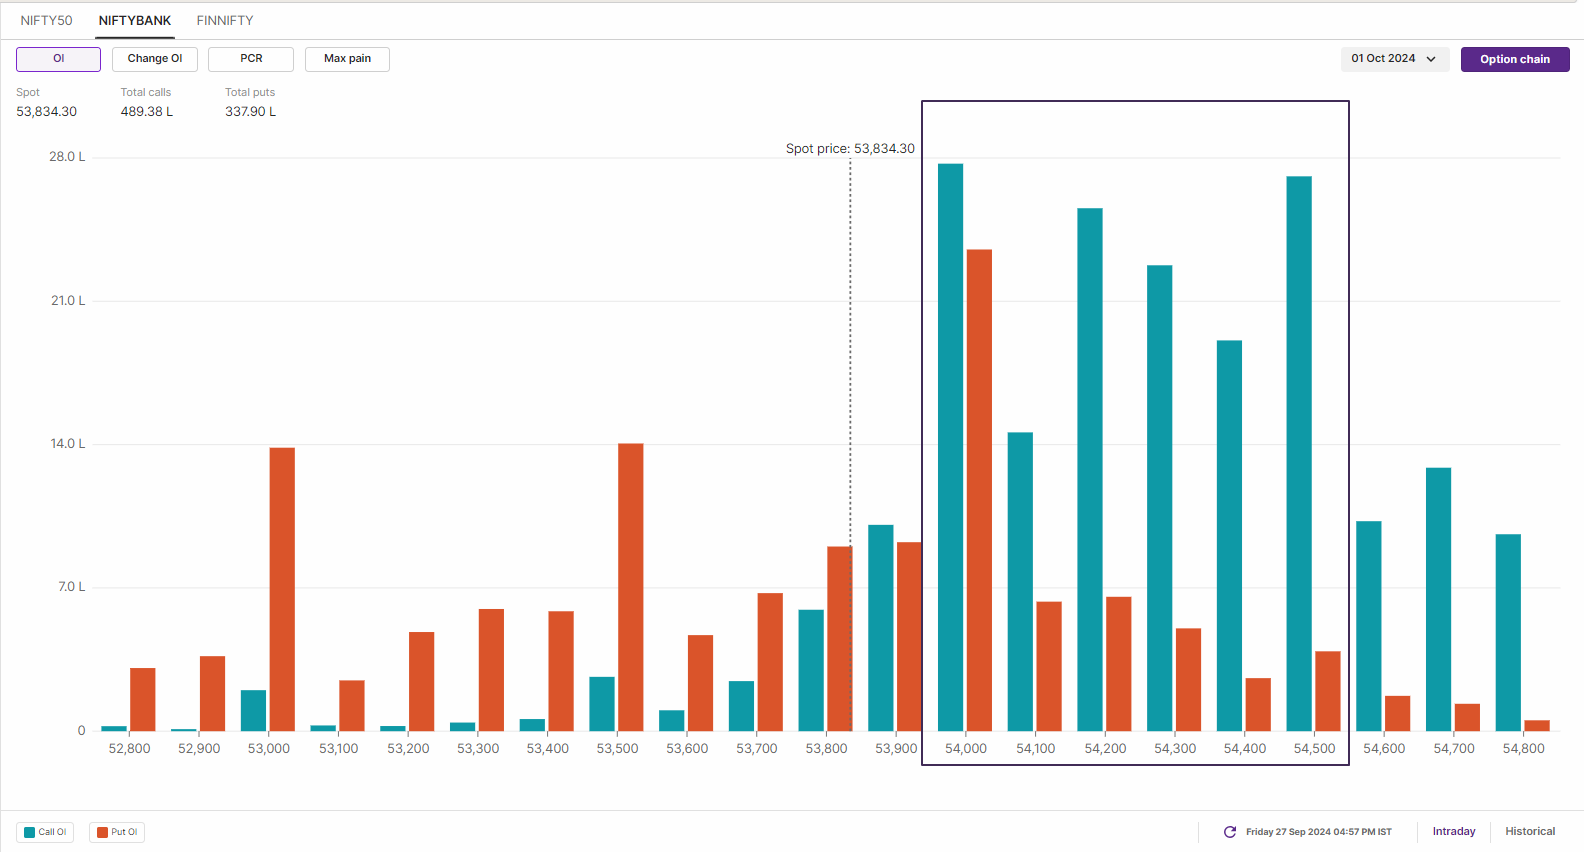
The open interest (OI) data of the BANK NIFTY’s 1 October expiry has highest call base at 54,000 and 54,500 strikes, hinting at resistance for the index around these zones. On the flip side, the highest put base was also seenat 54,000 strike, which points to consolidation and range-bound activity around this strike. However, it is important to note that the next significant put build-up was seen at 52,000 strike, indicating the OI build-up in favour of bears.
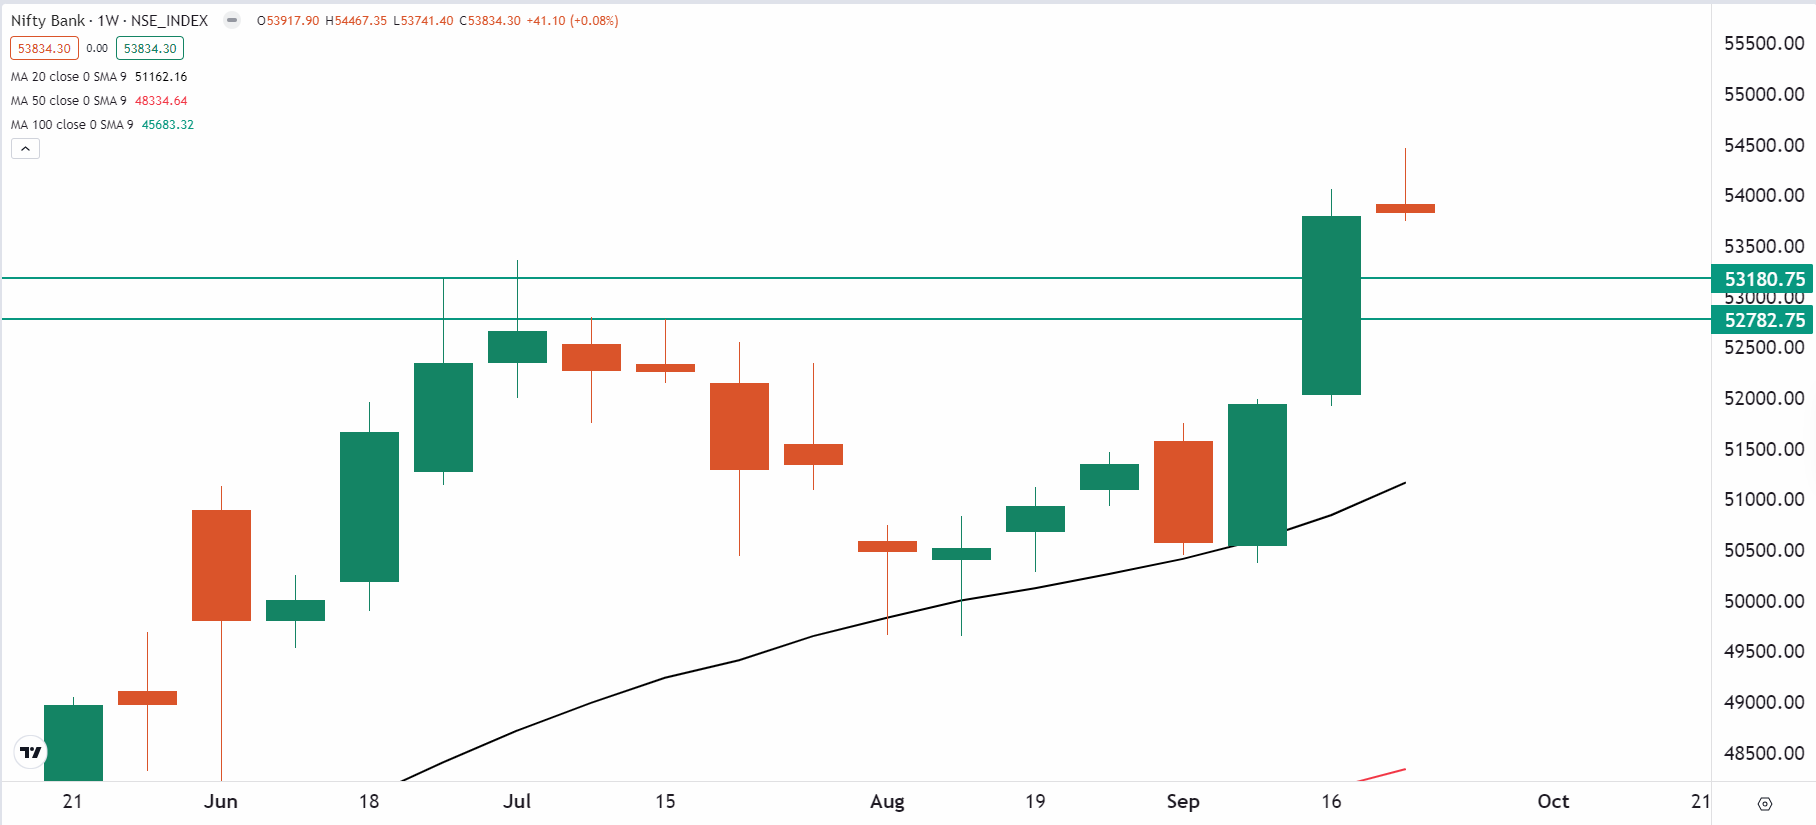
On the weekly chart, the BANK NIFTY has formed a negative candlestick pattern, shooting star which is also a reversal signal. A shooting star is a candlestick pattern which is formed after an uptrend. It features a small red body with a long upper wick, which signifies that the buyers pushed the price higher during the week, but seller took control by the close of the week. However, it is important to note that the pattern gets confirmed if the close of the subsequent candle is lower than the reversal pattern.
Over the past three weeks, the index has risen by almost 7%, maintaining its upward momentum. Immediate support is in the 53,300 to 53,150 area, which is the previous all-time high. A close below this area could signal a weakening trend, which could lead to a range-bound move. On the other hand, a close above 54,250 on the daily chart would likely indicate a continuation of the bullish trend.
Additionally, the week's focus will be on Friday's employment report, with economists predicting that non-farm payrolls rose by 1,45,000 in September, slightly above August's figure. The unemployment rate is expected to remain unchanged at 4.2%.
On the domestic front, the automobiles stocks will be in focus as the manufacturers will release the sales data for the month of September. Additionally, the board of market regulator Security and Exchange Board of India will meet on 30 September. The regulator is expected to tighten the rules in futures and options segment and introduce stricter margin system.
This week, both the indices are giving mixed signals with NIFTY50 forming a bullish structure. Looking forward, the NIFTY50 index has immediate support around 25,850 and 25,950 zone. As long as the index stays above this critical level, the broader trend is likely to remain bullish.
Due to truncated week, the BANK NIFTY index may consolidate its gains around 54,000 mark. However, if the index slips below this 53,300 to 53,150 area, the trend may become range-bound.
To stay updated on any changes in these levels and all intraday developments, be sure to check out our daily morning trade setup blog, available before the market opens at 8 am.
About The Author
Next Story

