Market News
Trade Setup for September 20: Will NIFTY50 confirm or invalidate bullish engulfing pattern on weekly chart?
.png)
4 min read | Updated on September 20, 2024, 07:41 IST
SUMMARY
The NIFTY50 index formed a bullish engulfing pattern last week, which is a bullish reversal pattern. Traders can look to today's weekly close for confirmation of the pattern. A close above the previous week's high will confirm the bullish pattern, while a negative close will invalidate the pattern.
Stock list

The NIFTY50 started the Thursday’s session on a strong note but failed to sustain its gains at higher levels.
Asian markets update at 7 am
The GIFT NIFTY is up 0.1%, signalling a positive opening for the NIFTY50 index today. Broader Asian markets are also showing strength, with Japan's Nikkei 225 gaining 2% and Hong Kong's Hang Seng Index advancing 0.8%.
U.S. market update
- Dow Jones: 42,025 (▲1.2%)
- S&P 500: 5,713 (▲1.7%)
- Nasdaq Composite: 18,013 (▲2.5%)
U.S. indices soared on Thursday, with Dow Jones Industrial Average closing above the 42,000 mark for the first time after the U.S. Federal Reserve delivered a 0.5% rate cut after four years. The sharp rally was led by technology stocks with Nvidia, Tesla and Apple jumping in the range of 3% to 7%.
NIFTY50
- September Futures: 25,489 (▲0.4%)
- Open Interest: 5,21,175 (▼1.5%)
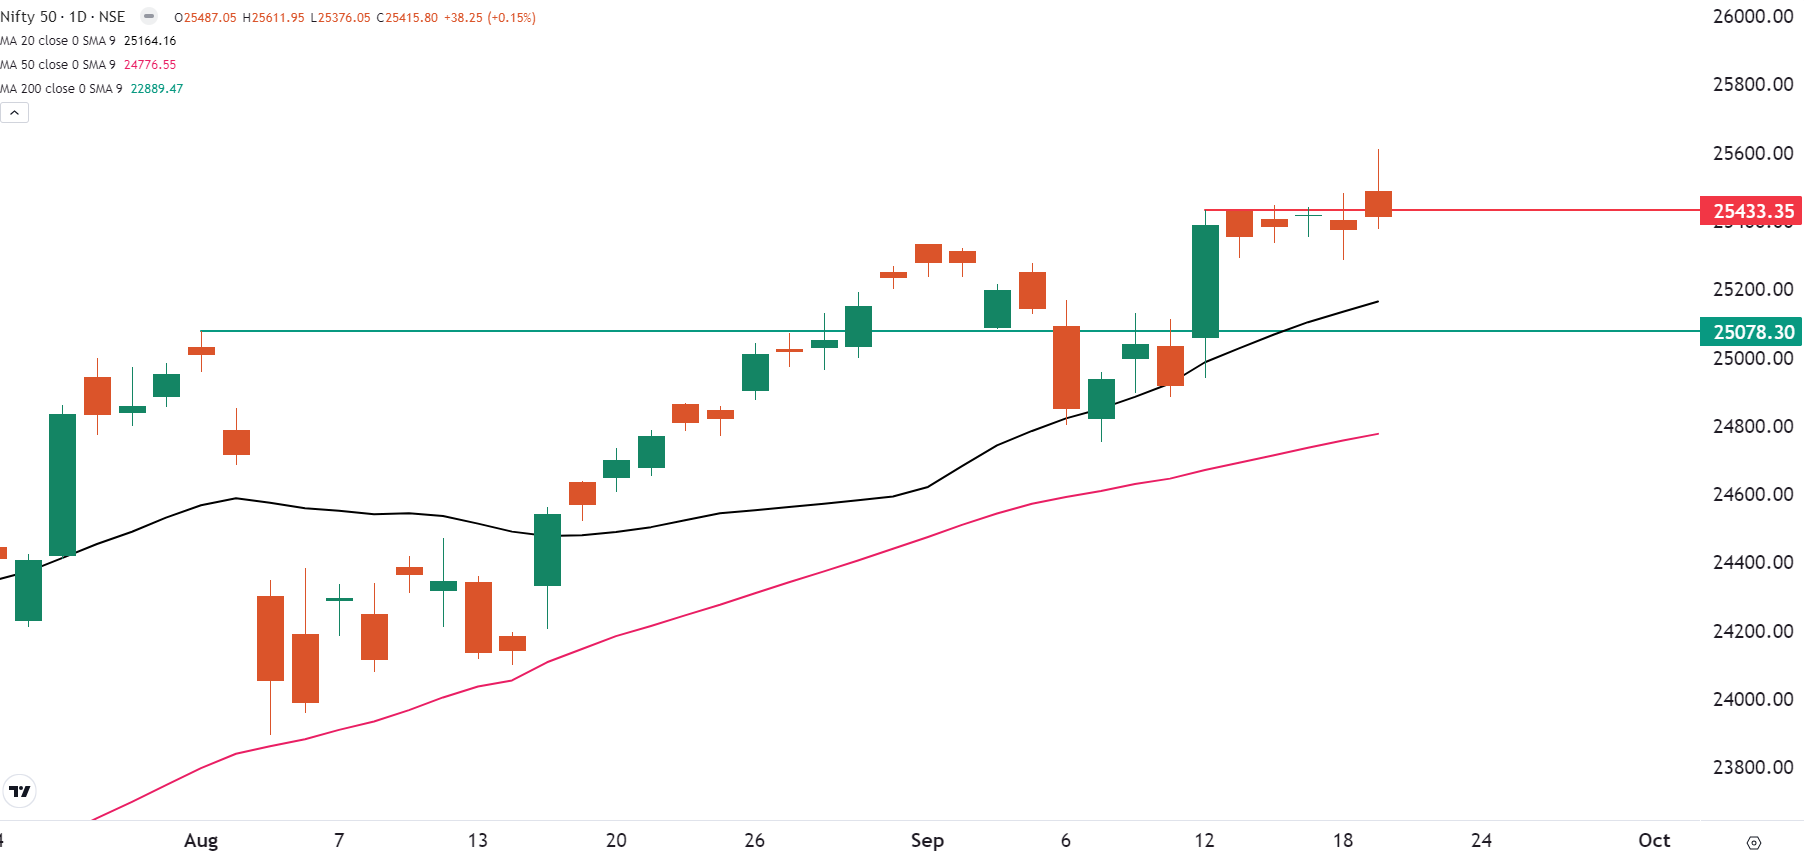
The NIFTY50 started the Thursday’s session on a strong note but failed to sustain its gains at higher levels. The index formed a red candle on the daily chart resembling the shooting start pattern, awaiting confirmation.
As shown in the chart below, the index is currently consolidating at higher levels and has made four attempts to capture the 25,443 mark on the closing basis. Additionally, the index has also formed a shooting star pattern on the daily chart. A shooting star is a bearish reversal pattern. It features a small red body and a long upper shadow, indicating that buyers pushed the price higher, but sellers took control before the close.
Traders can monitor today’s price action as a negative close, below the reversal pattern will confirm the shooting star pattern. On the other hand, a close above Thursday’s high will invalidate the pattern.

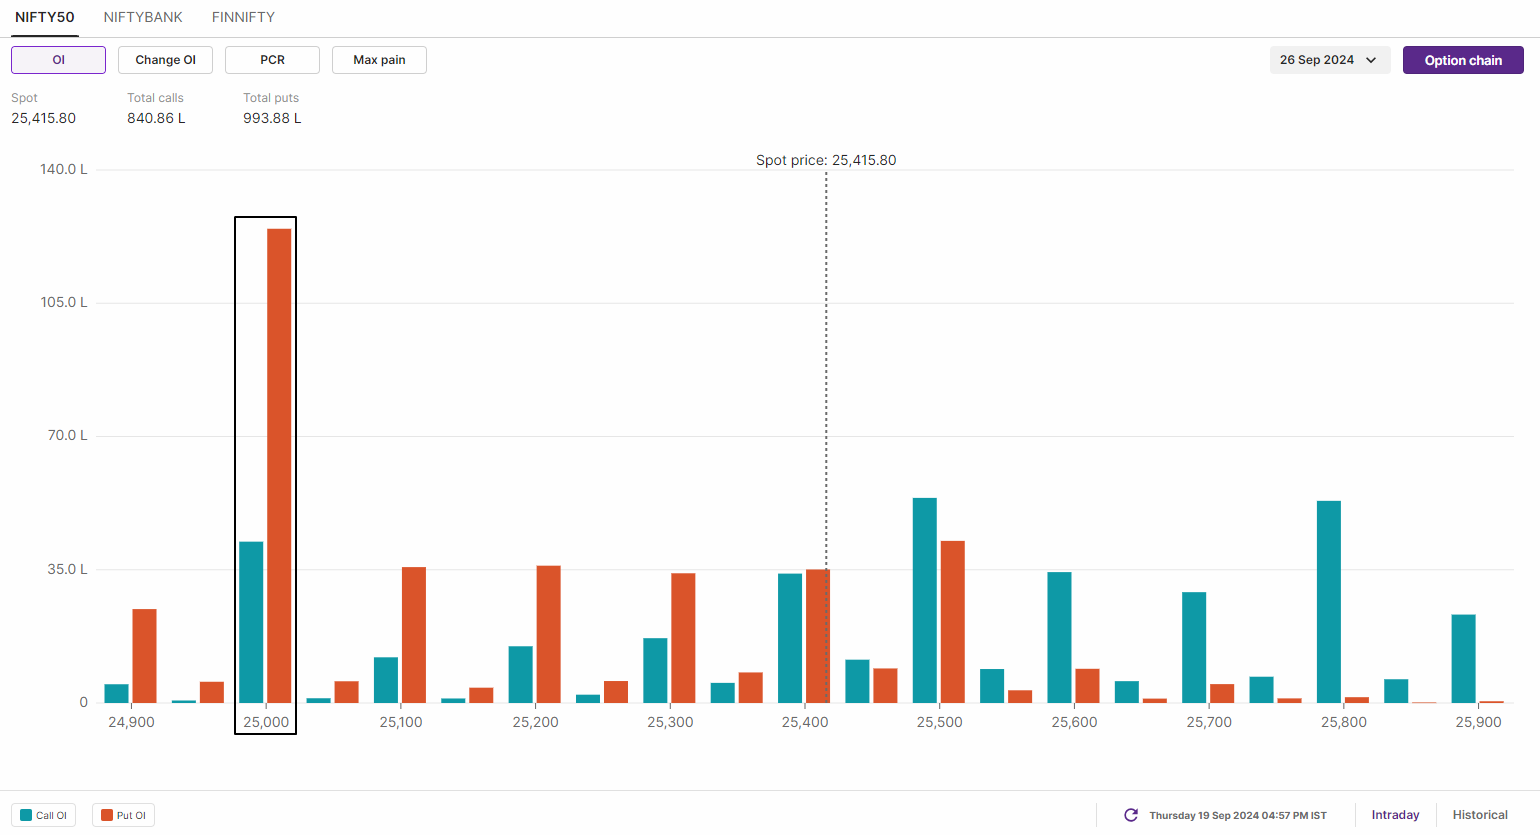
The initial open interest build-up for the 26 September expiry has highest call open interest at 26,000 strike, indicating resistance for the index around the psychological mark. On the flip side, the put base established at 25,000 strike, pointing it as support for the index. Meanwhile, significant call and put placement was also seent at 25,500 strike, pointing at consolidation around this strike.

BANK NIFTY
- September Futures: 53,177 (▲0.8%)
- Open Interest: 1,29,284 (▲0.8%)
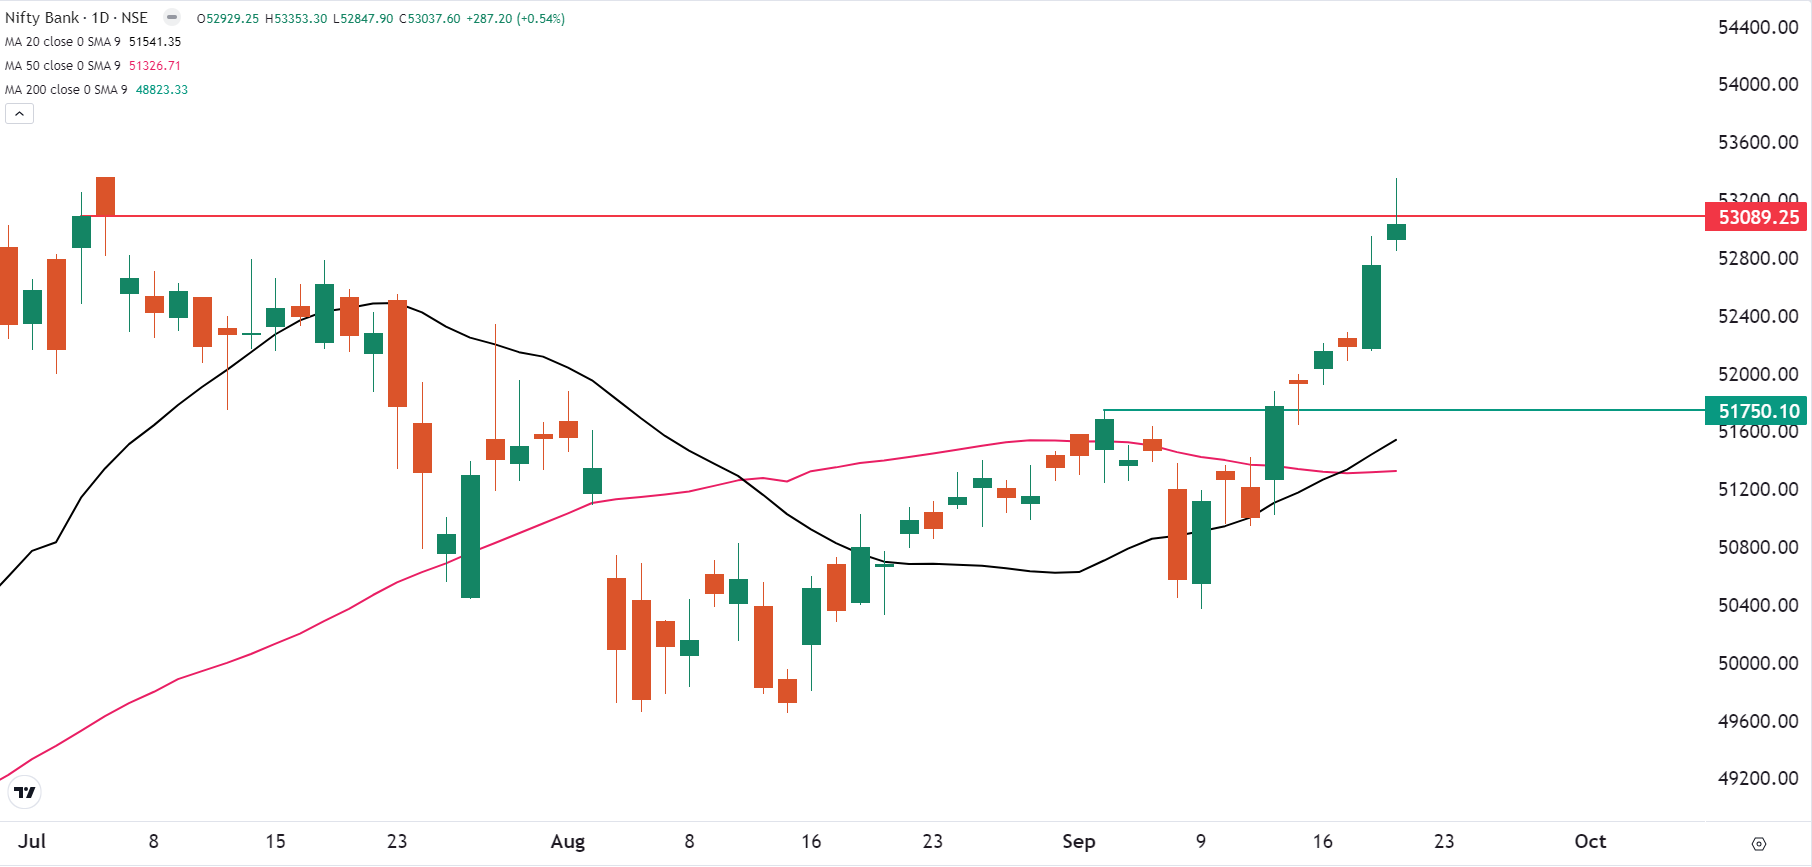
The BANK NIFTY came within the striking distance of its previous all-time hig but saw profit-booking at higher levels. The index closed above the 53,000 mark after nearly two months and outperformed the benchmark indices.
The index also formed a shooting star pattern on the daily chart but with a green body, indicating profit-booking at higher levels. For the upcoming sessions, a close below the Thursday’s low will confirm the pattern, while a positive close will invalidate the pattern. Meanwhile, the immediate support for the index is around 51,750. As long as the index remains above this level, any dips could be used as fresh entry points for buyers.

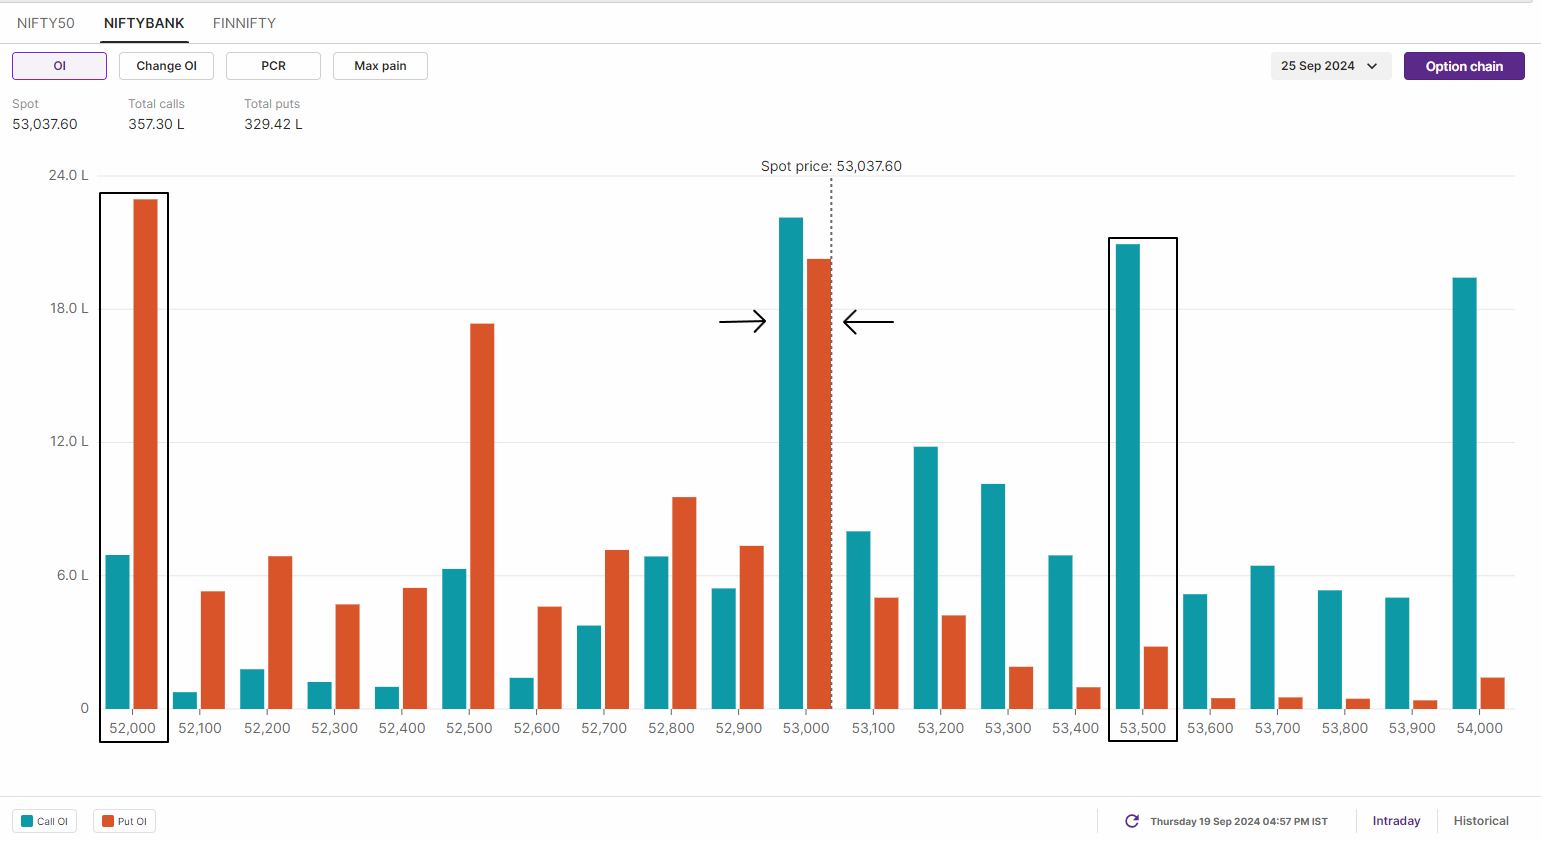
However, open interest data for the 24th September BANK NIFTY expiry shows a significant call and put base at the 53,000 strike. This suggests that traders are currently pricing in a range-bound move around this level.

FII-DII activity
Stock scanner
Under F&O ban: Aarti Industries, Biocon, Birlasoft, Chambal Fertilisers, Gujarat Narmada Valley Fertilizers & Chemicals (GNFC), Granules India, LIC Housing Finance, National Aluminium, Oracle Financial Services Software, Punjab National Bank, RBL Bank and Steel Authority of India
Added under F&O ban: Chambal Fertilisers and National Aluminium
Out of F&O ban: Balrampur Chini Mills
In Futures and Options or F&O, long build-up means an increase in Open Interest (OI) along with an increase in price, and short build-up means an increase in Open Interest(OI) along with a decrease in price.
Source: Upstox and NSE.
Disclaimer: Derivatives trading must be done only by traders who fully understand the risks associated with them and strictly apply risk mechanisms like stop-losses. The information is only for consumption by the client and such material should not be redistributed. We do not recommend any particular stock, securities and strategies for trading. The securities quoted are exemplary and are not recommendatory. The stock names mentioned in this article are purely for showing how to do analysis. Take your own decision before investing.
About The Author
Next Story


