Market News
Trade Setup for Oct 29: NIFTY50 and BANK NIFTY to extend the rebound?
.png)
4 min read | Updated on October 29, 2024, 07:33 IST
SUMMARY
Both the NIFTY50 and the BANK NIFTY indices formed bullish candles on the daily chart, indicating a rebound from crucial support zones. However, unless the NIFTY50 reclaims the 24,500 mark and the BANK NIFTY reclaims the 52,000 mark, the trend may remain bearish.
Stock list
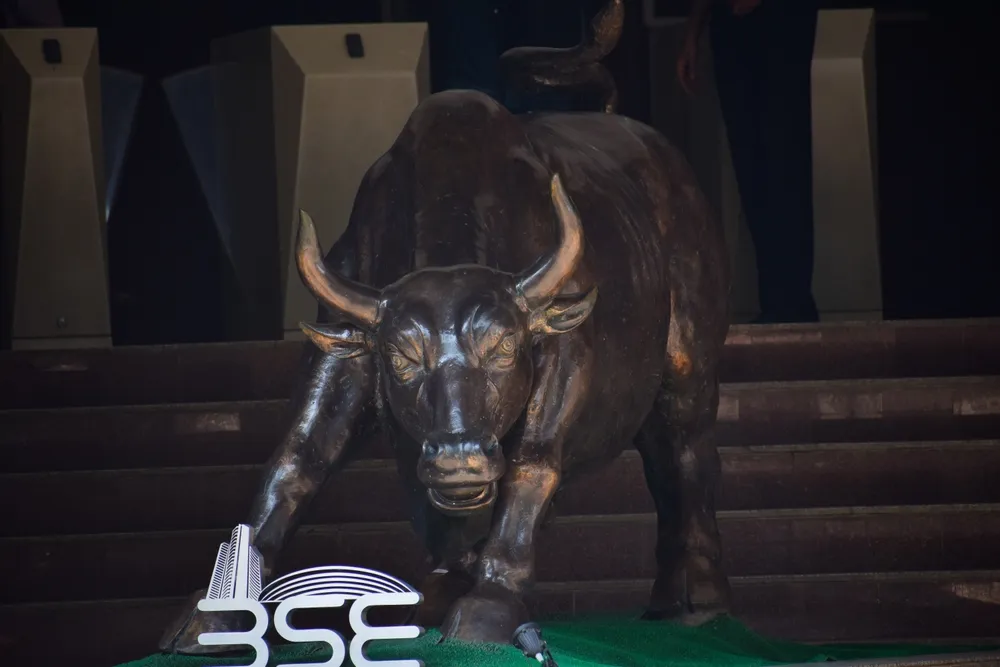
The BANK NIFTY index jumped nearly 1% and outpeformed the benchmark indices, driven by strong gains in ICICI Bank.
Asian markets update
The GIFT NIFTY is up 0.1%, suggesting a positive start for the NIFTY50 today. Meanwhile, the other Asian Indices are also trading in the green. Japan’s Nikkei 225 is up 0.4%, while Hong Kong’s Hang Seng index rose 0.4%.
U.S. market update
- Dow Jones: 42,387 (▲0.6%)
- S&P 500: 5,823 (▲0.2%)
- Nasdaq Composite: 18,567 (▲0.2%)
U.S. indices started the Monday’s crucial week on a positive note amid softening oil prices and cool-off in the geopolitical tensions. Investors will be also watching the third quarter earnings of Alphabet, Microsoft, Meta Platforms, Amazon and Apple, the five of the magnificient seven companies. Additionally, it’s also the last week before the U.S. Presidential election and the FOMC meeting.
NIFTY50
- October Futures: 24,348 (▲0.7%)
- Open Interest: 4,05,910 (▼15.3%)
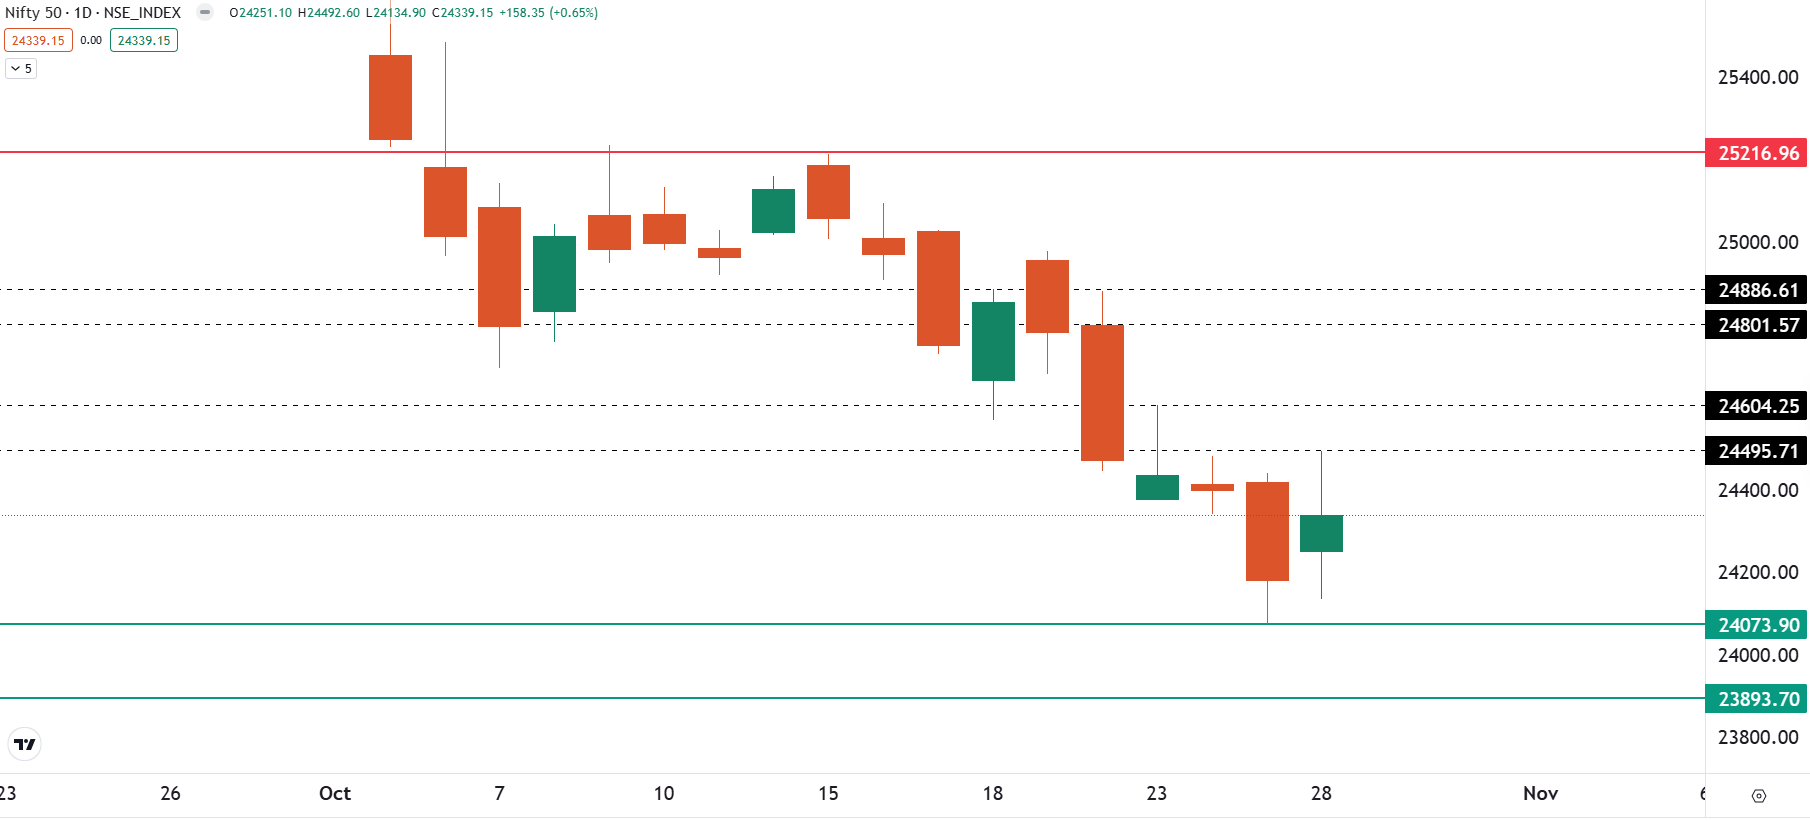
The NIFTY50 index rebounded from the day’s low and formed a bullish candle on the daily chart. After an initial dip, the index witnessed buying across sectors and rebounded towards the immediate resistance zone of 24,400 and 25,500 zone.
On the daily chart, the index has formed a bullish candlestick pattern and a close above the high of the 28 October candle will result in further upmove. On the other hand, the crucial resiatnce of the index is between 24,800 and 24,900. Unless the index closes below this zone, the trend may remain sideways to bullish.
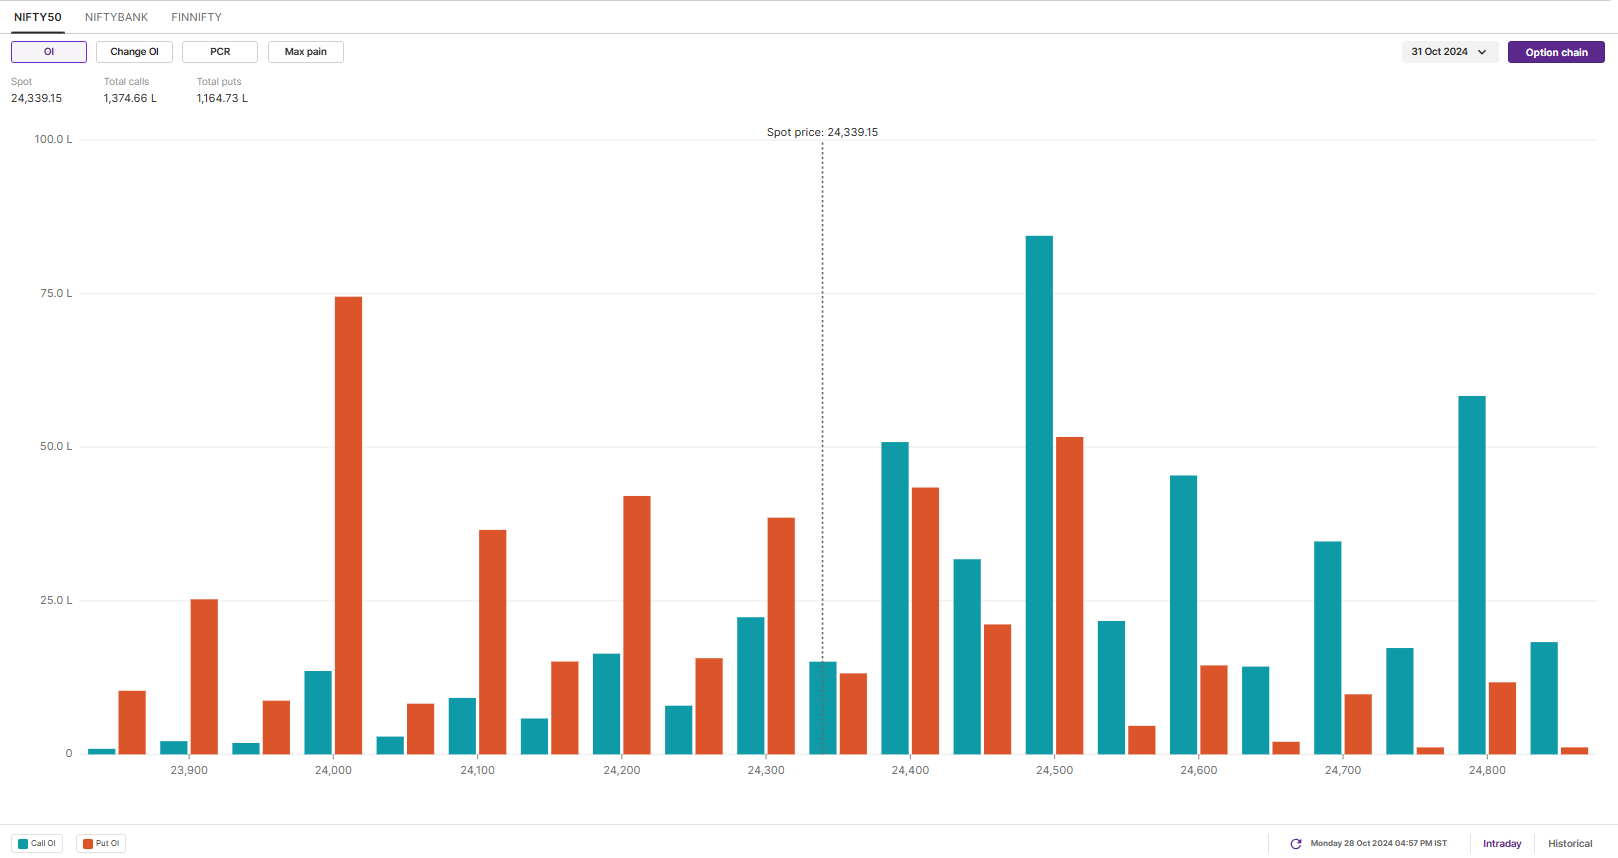
The open interest data for the 30 October exiry has highest call base at 25,000 and 24,500 strikes, pointing at resistance for the index around these zones. Conversely, the put base was seent at 24,000 and 23,500 strikes, suggesting support for the indeex around these zones.
BANK NIFTY
- October Futures: 51,327 (▲1.7%)
- Open Interest: 1,25,523 (▼8.0%)
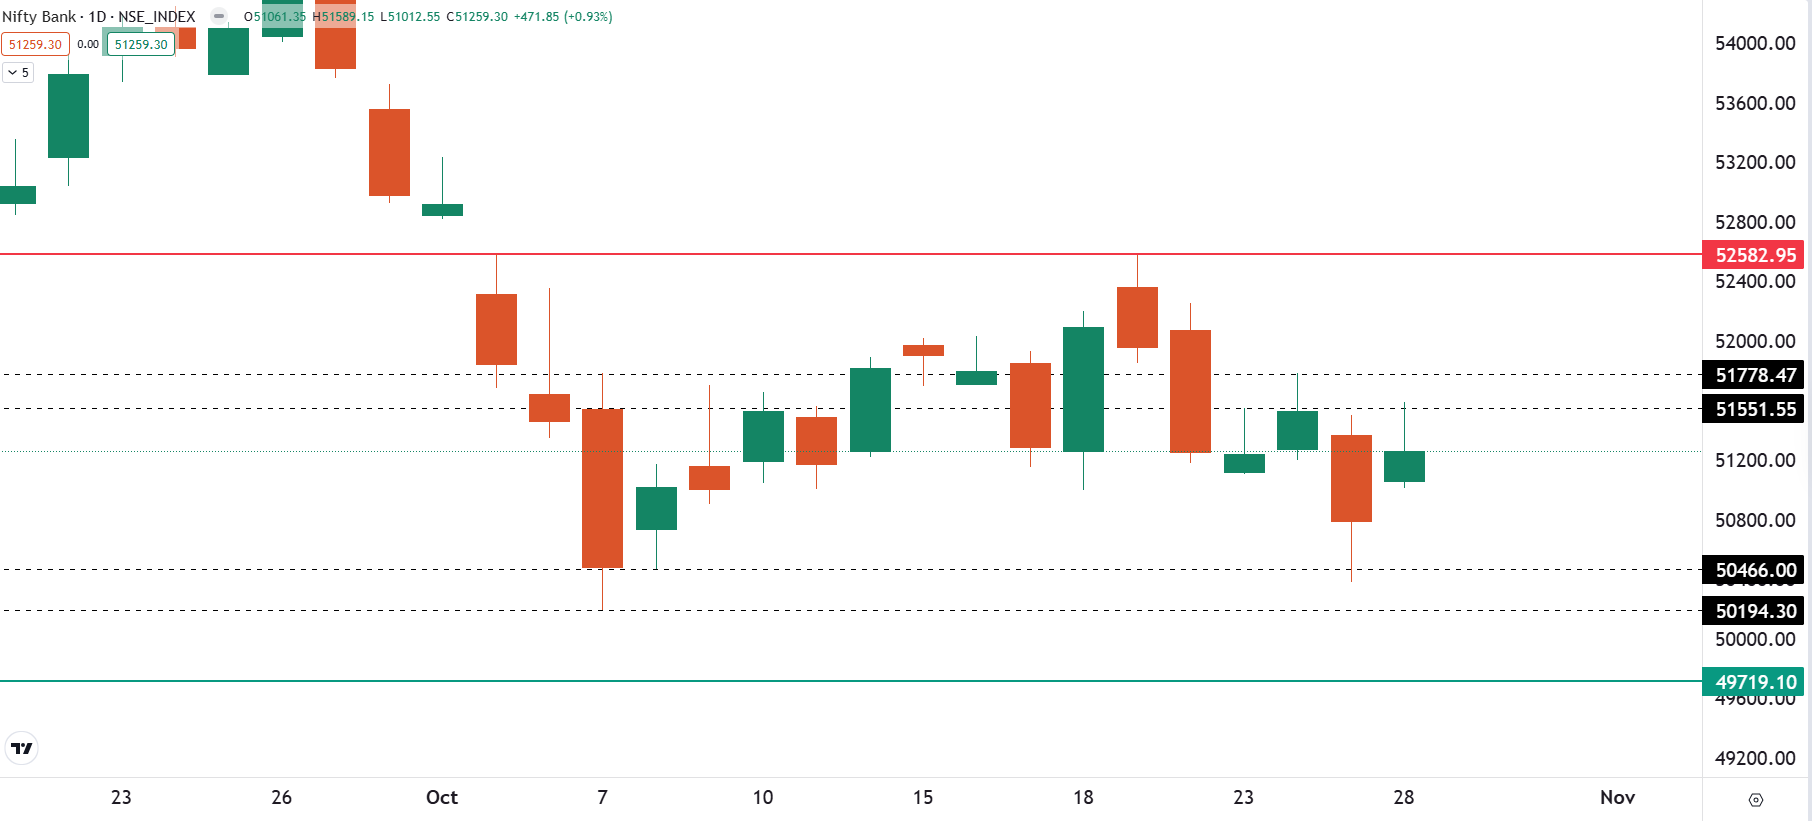
The BANK NIFTY index jumped nearly 1% and outpeformed the benchmark indices, driven by strong gains in ICICI Bank. The index formed a bullish harami candle on the daily chart, which is a bullish reversal pattern. A bullish candlestick is a two-candlestick pattern that signals a potential reversal in a downtrend.
As shown in the chart below, the index witnessed selling pressure around the immediate resistance zone of 51,500 and witnessed profit booking after a sharp upmove. However, the broader trend of the index still remains range-bound between 52,500 and 49,600 zone. Traders can monitor the price action near the immediate support and resiatnce zone marked on the chart below. A close above or below these zone will provide further directional clues.
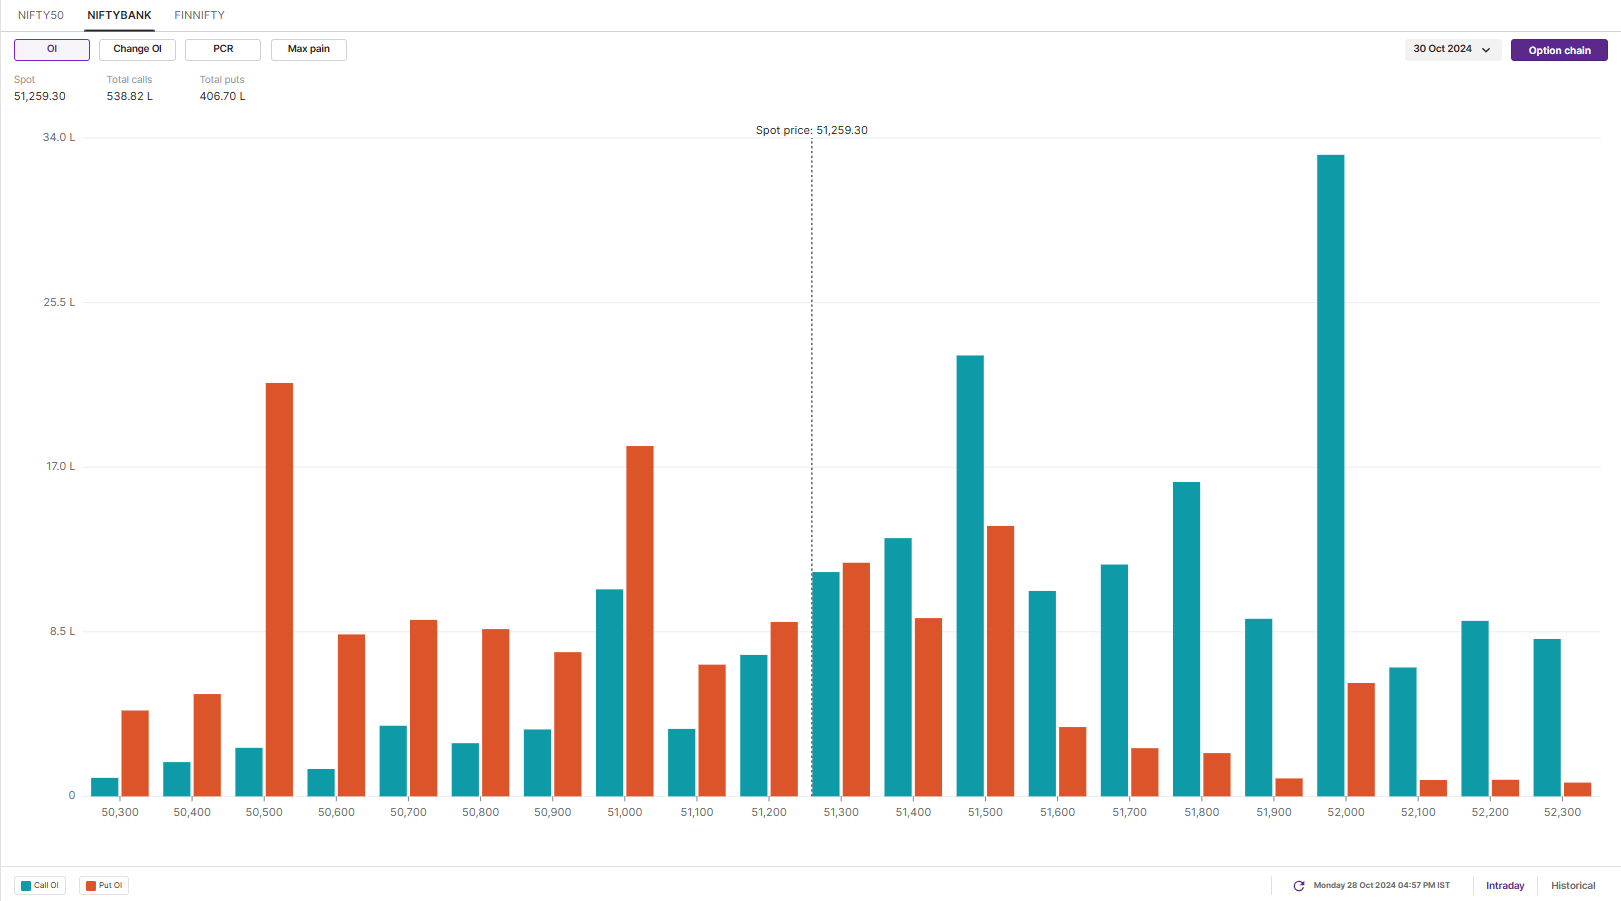
Meanwhile, the open interest data of the 30 October expiry has highest call build-up at 52,000 and 52,500 strikes, indicating resistance for the index around this area. On the flip side, the put base was seen at 50,500 and 51,000 strikes. These strikes may act as immediate support for the index.
FII-DII activity
Stock scanner
Under F&O ban: Dixon Technologies, Escorts Kubota, IDFC First Bank, Indiamart Intermesh, L&T Finance, Manappuram Finance, Punjab National Bank and RBL Bank
Out of F&O ban: Aarti Industries, Bandhan Bank and NMDC
Added under F&O ban: Punjab National Bank
In Futures and Options or F&O, long build-up means an increase in Open Interest (OI) along with an increase in price, and short build-up means an increase in Open Interest(OI) along with a decrease in price.
Source: Upstox and NSE.
Disclaimer: Derivatives trading must be done only by traders who fully understand the risks associated with them and strictly apply risk mechanisms like stop-losses. The information is only for consumption by the client and such material should not be redistributed. We do not recommend any particular stock, securities and strategies for trading. The securities quoted are exemplary and are not recommendatory. The stock names mentioned in this article are purely for showing how to do analysis. Take your own decision before investing.
About The Author
Next Story

