Market News
Trade Setup for Oct 25: BANK NIFTY weekly close above 51,000?
.png)
4 min read | Updated on October 25, 2024, 07:40 IST
SUMMARY
The BANK NIFTY index is currently trading above the previous week's low and is outperforming the benchmark peers. Traders can closely monitor the weekly closing, as a close around the 51,000 zone will indicate weakness. On the other hand, a close above 51,800 can lead to a short-term bounce.
Stock list
The NIFTY50 index traded in a narrow range on the weekly expiry of its options contracts, ending the day flat and forming a doji candlestick pattern on the daily chart.
Asian markets update
The GIFT NIFTY is trading flat, suggesting a subdued start for the Indian indices today. Meanwhile, the other Asain indices are providing mixed signals. Japan’s Nikkei 225 is down 0.7%, while Hong Kong’s Hang Seng index is up 0.5%.
U.S. market update
- Dow Jones: 42,374 (▼0.3%)
- S&P 500: 5,809 (▲0.2%)
- Nasdaq Composite: 18,415 (▲0.2%)
U.S. indices ended the Thursday’s session on a mixed note with S&P 500 snapping three-day losing streak, led by strong third quarter results from Tesla, which surged 22%. The company beat analysts’ expectations and provided the strong forecast of EV sales 20% to 30% higher next year.
However, the Dow Jones was dragged by IBM, which declined by 6% as the company’s consulting revenue missed street estimates.
NIFTY50
- October Futures: 24,452 (▼0.0%)
- Open Interest: 5,12,227 (▼0.6%)
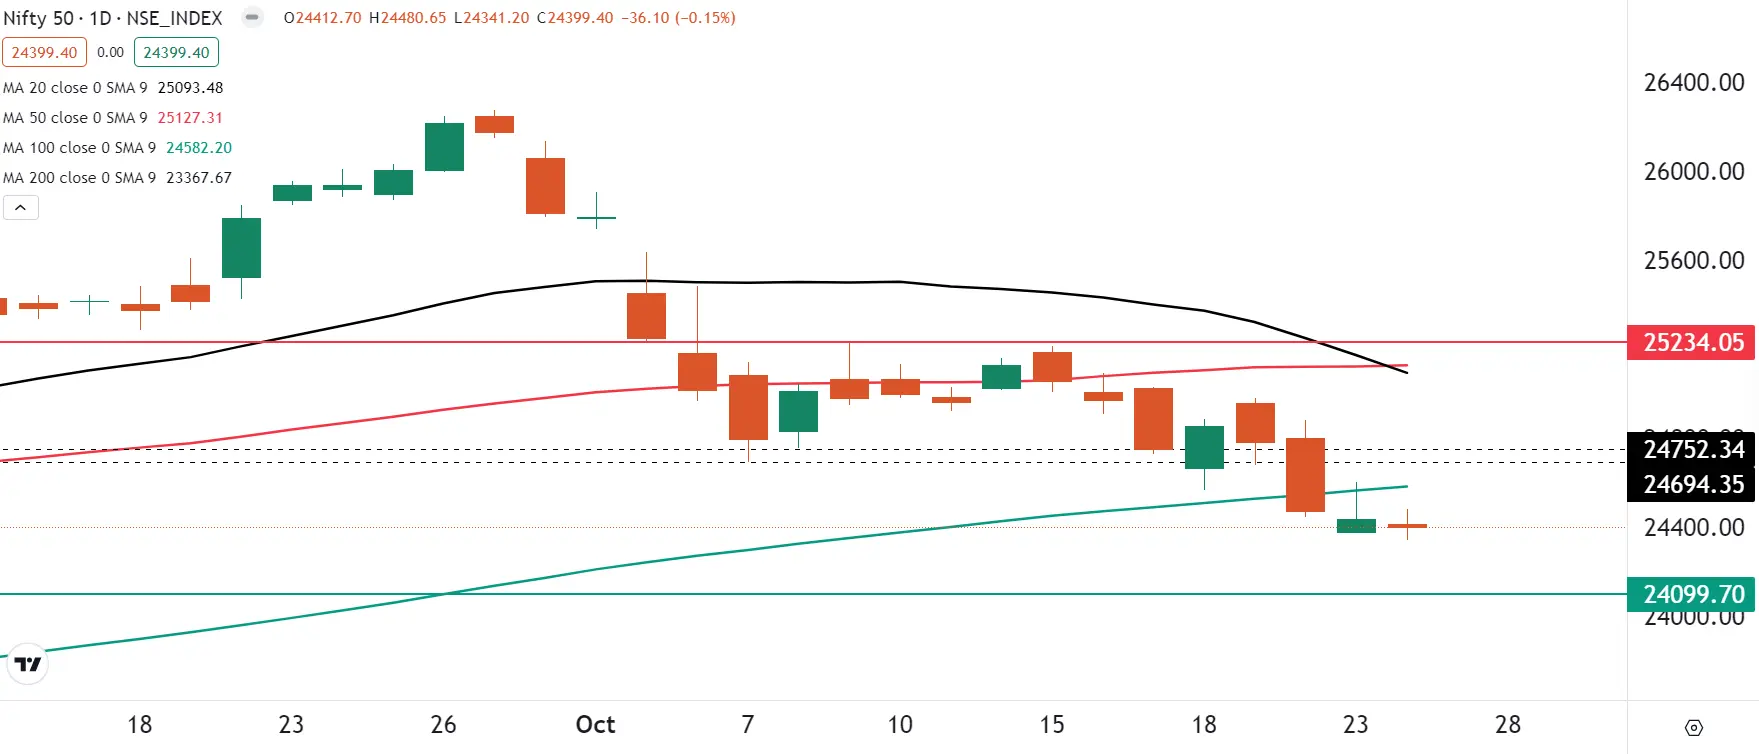
The NIFTY50 index traded in a narrow range on the weekly expiry of its options contracts, ending the day flat and forming a doji candlestick pattern on the daily chart. A doji is a neutral candlestick pattern that forms when the open and close are around the same level.
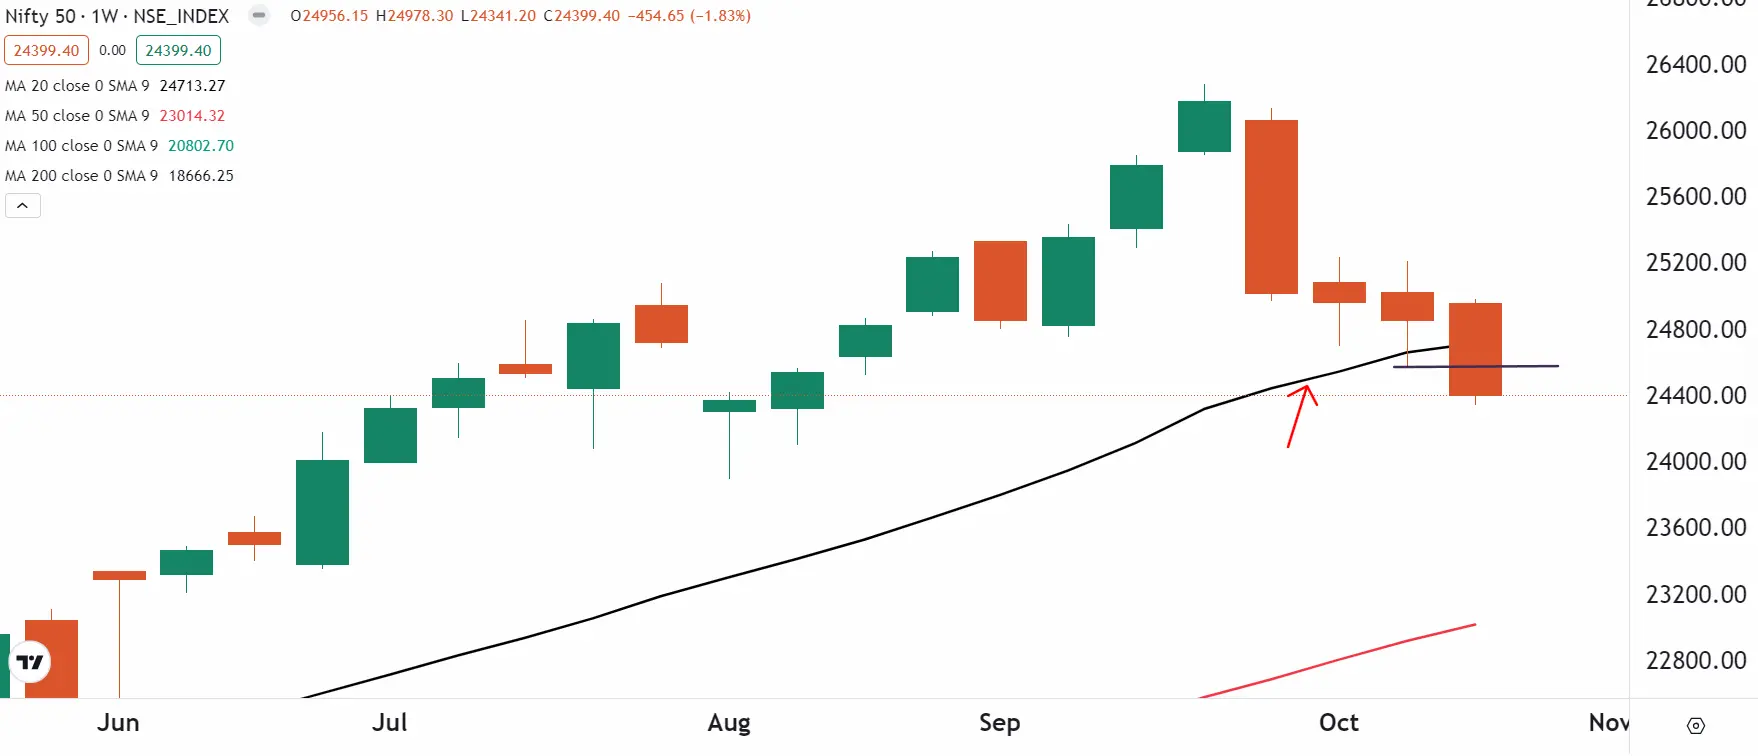
If we analyse the weekly chart of the NIFTY50, the index is currently trading below previous week’s low and the 20 weekly moving average, indicating weakness. If the index ends the week below previous week’s low, then next crucial support is visible around 23,900 and 24,000 zone. However, a close above previous week’s low and 20 weekly moving average may lead to a short-term rebound.
On the daily chart, the index has formed a doji candlestick pattern, which reflects indecision at current levels. For directional clues, traders can keep an eye on today’s closing price. If the index closes above the high of the doji pattern, then it may retest the immediate resistance zone of 24,700 and 24,800. Conversely, a close below the doji can extend more weakness upto 24,000 level.
BANK NIFTY
- October Futures: 51,605 (▲0.6%)
- Open Interest: 1,47,602 (▼8.7%)
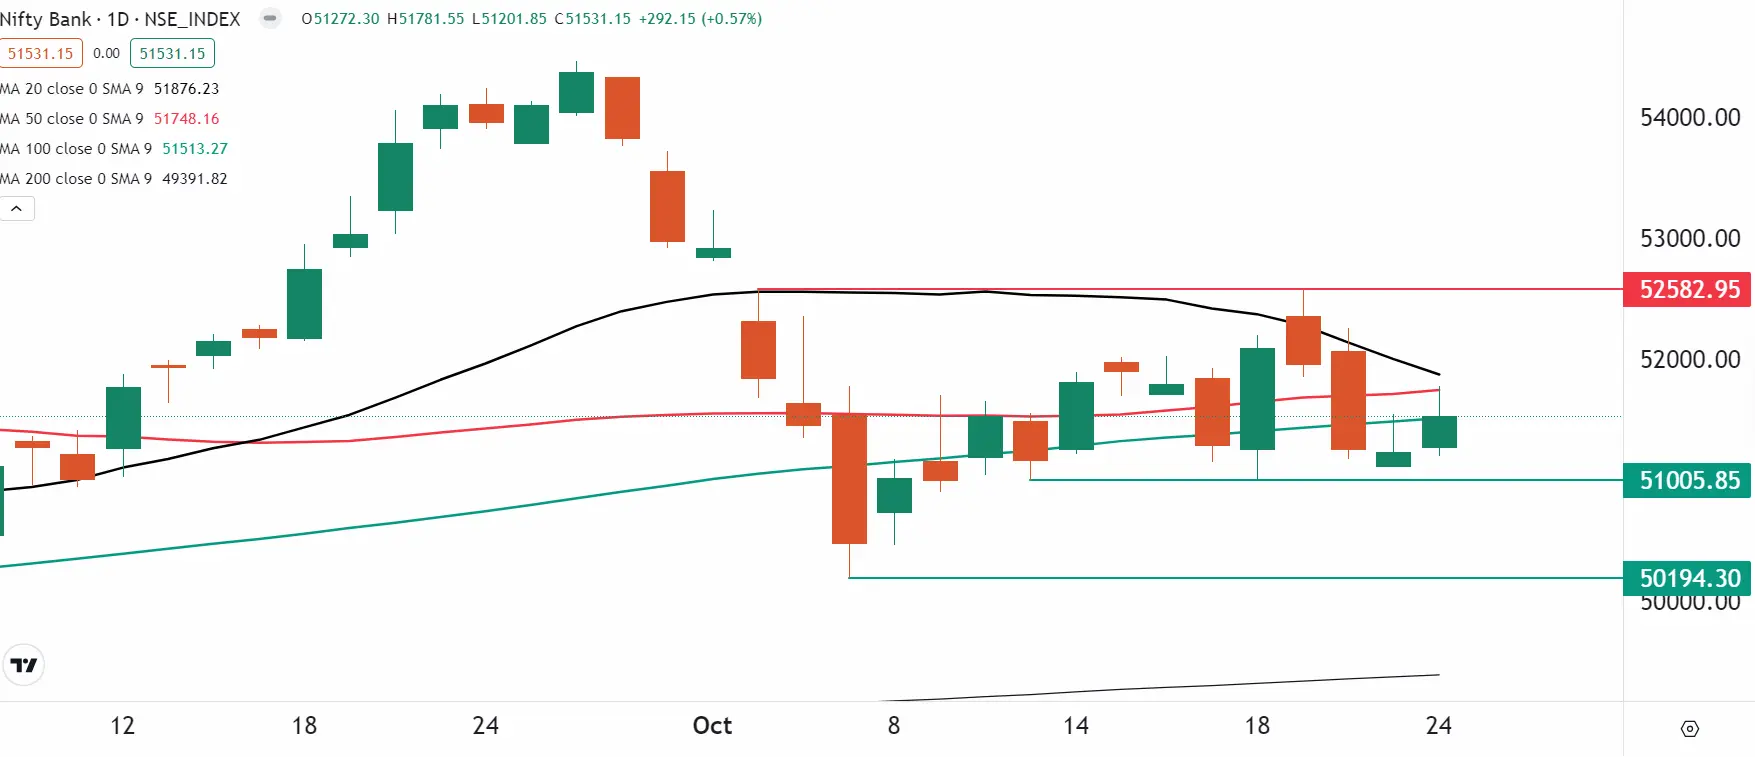
The BANK NIFTY index continued its outperformance for the second the day in a row and protected the 51,000 mark on the closing basis. The index remained volatile near its 50 and 100 day moving averages and ended Thursday’s session in the green.
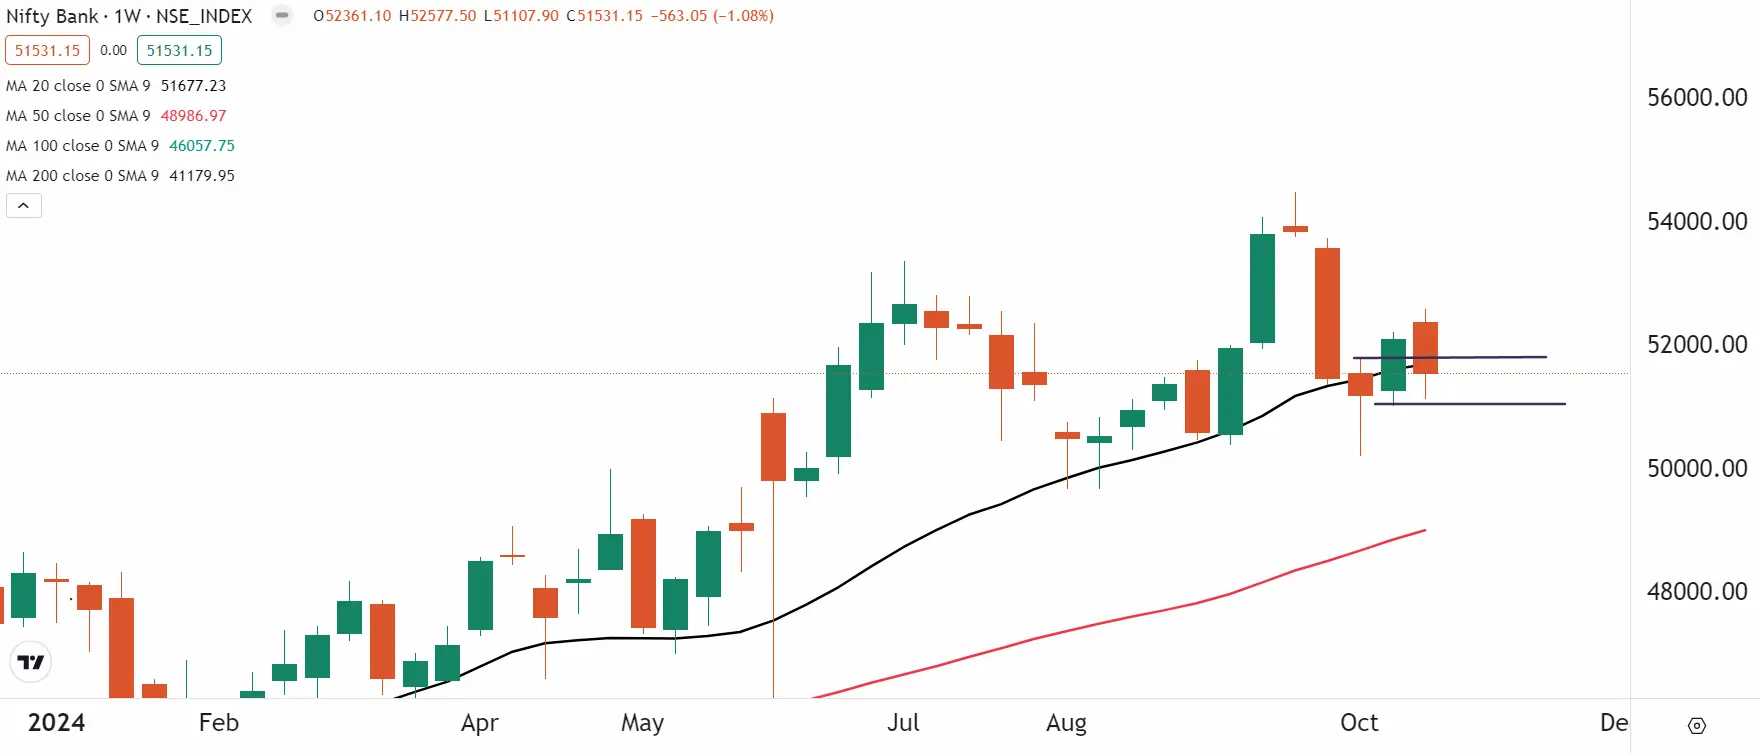
As per the weekly time frame, the index is currently trading above its previous week’s low and protecting it on closing basis. If the index protects the high of the hammer candlestick pattern formed during the week ending 11 October, then it may sustain its bullish momentum versus the benchmark indices. However, a close below or around previous week low may negate the pattern and may show some weakness.
On the daily chart, the index is currently facing resistance at its 50-day moving average (DMA) and has failed to capture it on closing basis in the last two trading sessions. If the index reclaims 50 DMA on closing basis, then it may rebound towards the next resistance of 52,500. On the flip side, a close below 51,000 mark may reflect weakness.
FII-DII activity
Stock scanner
Short build-up: Hindustan Unilever, Dr. Lal Pathlabs, Escorts Kubota, TVS Motor and Nestle India
Under F&O ban: Aarti Industries, Bandhan Bank, Escorts Kubota, IEX, Indiamart Intermesh, Manappuram Finance, NMDC, Piramal Enterprises and RBL Bank
Out of F&O ban: Birla Soft, Gujarat Narmada Valley Fertilizers & Chemicals (GNFC),
Added under F&O ban: NIL
In Futures and Options or F&O, long build-up means an increase in Open Interest (OI) along with an increase in price, and short build-up means an increase in Open Interest(OI) along with a decrease in price.
Source: Upstox and NSE.
Disclaimer: Derivatives trading must be done only by traders who fully understand the risks associated with them and strictly apply risk mechanisms like stop-losses. The information is only for consumption by the client and such material should not be redistributed. We do not recommend any particular stock, securities and strategies for trading. The securities quoted are exemplary and are not recommendatory. The stock names mentioned in this article are purely for showing how to do analysis. Take your own decision before investing.
About The Author
Next Story


