Market News
Trade Setup for Oct 18: NIFTY50, BANK NIFTY form bearish engulfing, all eyes on weekly close
.png)
4 min read | Updated on October 18, 2024, 07:19 IST
SUMMARY
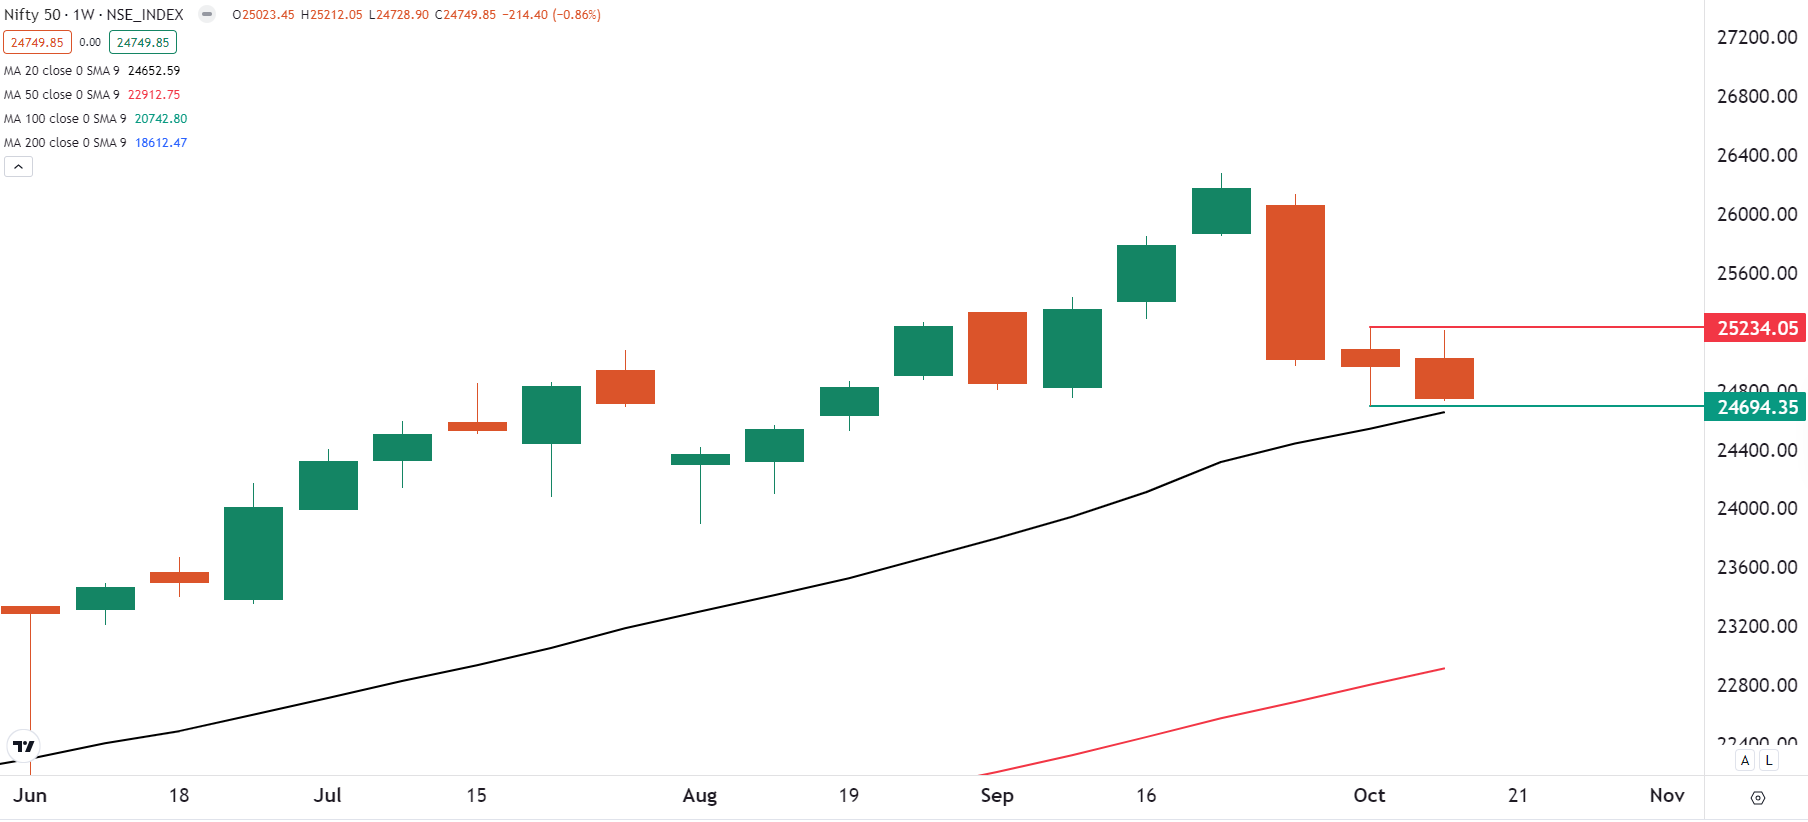
The weekly chart of the NIFTY50 index shows early signs of a potential negative close, signaling weakness ahead. If the index closes below the crucial 24,700 zone, it could lead to further downside momentum, potentially extending weakness beyond this level.
Stock list
The BANK NIFTY index erased all of its weekly gains and closed the session in red on Thursday.
Asian markets update
The GIFT NIFTY is trading in negative territory, down 0.4%, indicating that the NIFTY50 is set to start the day in negative territory. Other Asian indices are trading in the green. Japan’s Nikkei 225 is up 0.2%, while Hong Kong’s Hang Seng index rose 0.7%.
U.S. market update
- Dow Jones: 43,239 (▲0.3%)
- S&P 500: 5,841 (▼0.0%)
- Nasdaq Composite: 18,373 (▲0.0%)
Technology stocks led U.S. indices higher on Thursday as U.S.-listed Taiwan Semiconductor Manufacturing, which makes the world's most advanced chips, posted strong earnings. The company posted a 54% jump in net profit from a year earlier and raised its revenue forecast for 2024 amid a surge in demand.
On the economic front, the data continues to point to a strong U.S. economy. Retail sales for September rose 0.4% month-on-month, beating Street expectations and up from August's 0.1% gain. On the other hand, the weekly initial jobless claims of 2,41,000 were below the estimates of 2,62,000.
NIFTY50
- October Futures: 24,843 (▼0.8%)
- Open Interest: 5,41,228 (▼1.3%)
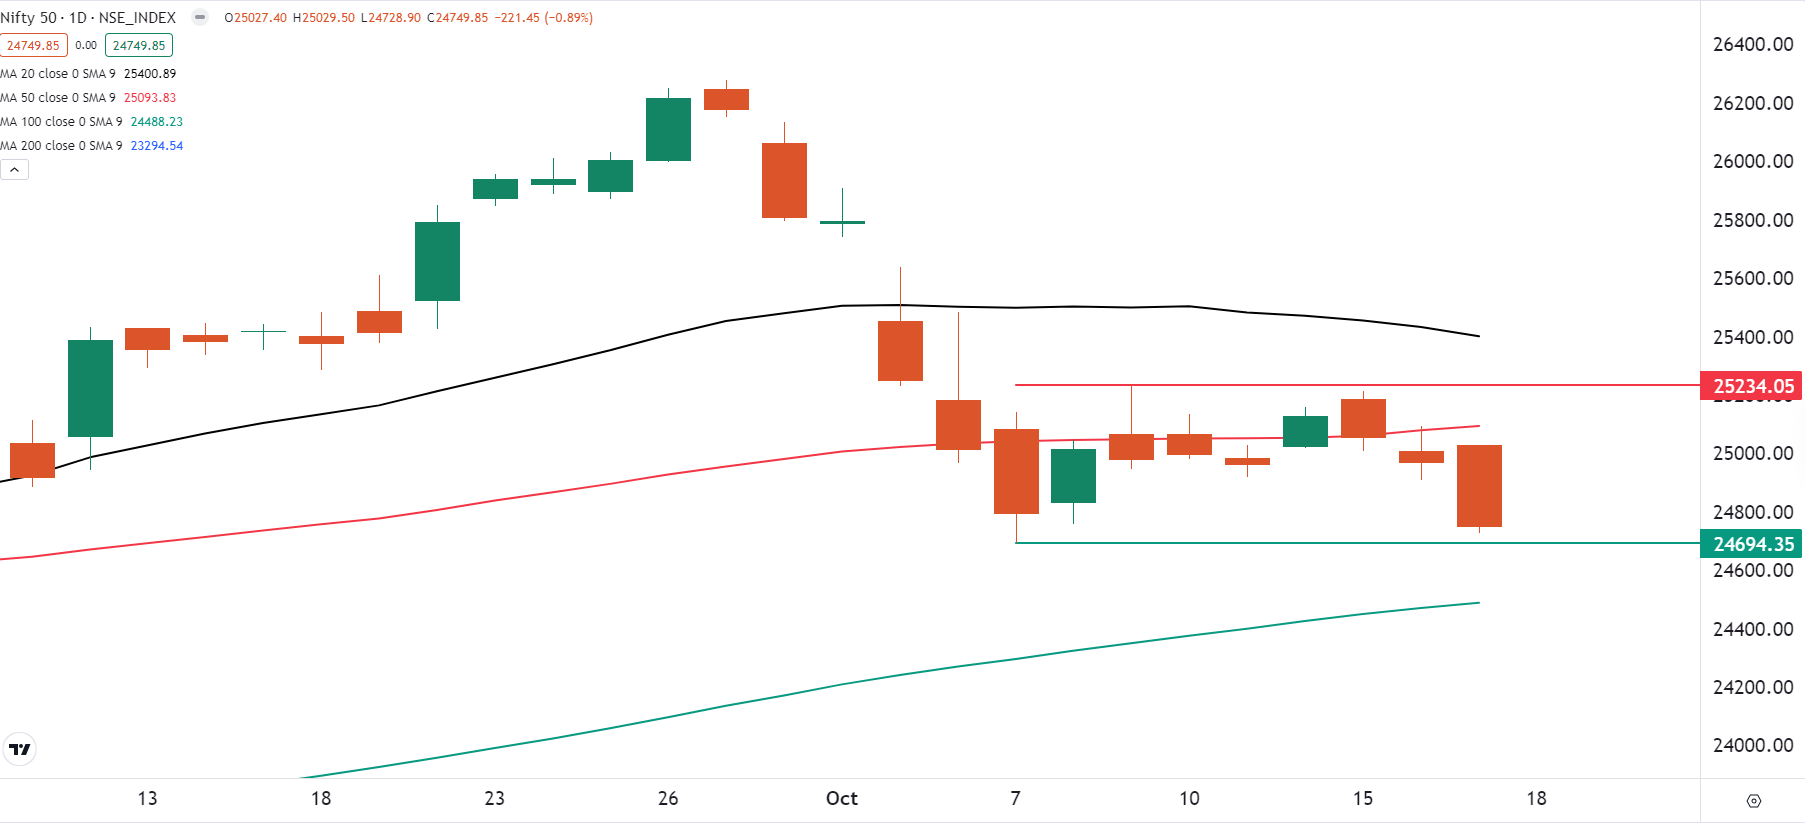
The NIFTY50 index slipped nearly 1% on the weekly expiry of its options contract, forming a bearish engulfing candle on the daily chart. The index ended its six day consolidation and ended closer to the crucial support of 24,700.
After the weekly expiry, the NIFTY50 index is showing early signs of a negative close on the weekly chart. The index is currently trading between the previous week's range and a close above or below the previous week's high and low will provide further directional clues.
On the daily chart, the NIFTY50 formed a bearish engulfing candle that closed near the day’s low. This pattern signals potential downward pressure. A break below the key support level of 24,700, which marks the September low, could extend the ongoing weakness. Holding this level is crucial to prevent a deeper correction in the market.
BANK NIFTY
- October Futures: 51,491 (▼1.1%)
- Open Interest: 1,98,235 (▲2.8%)
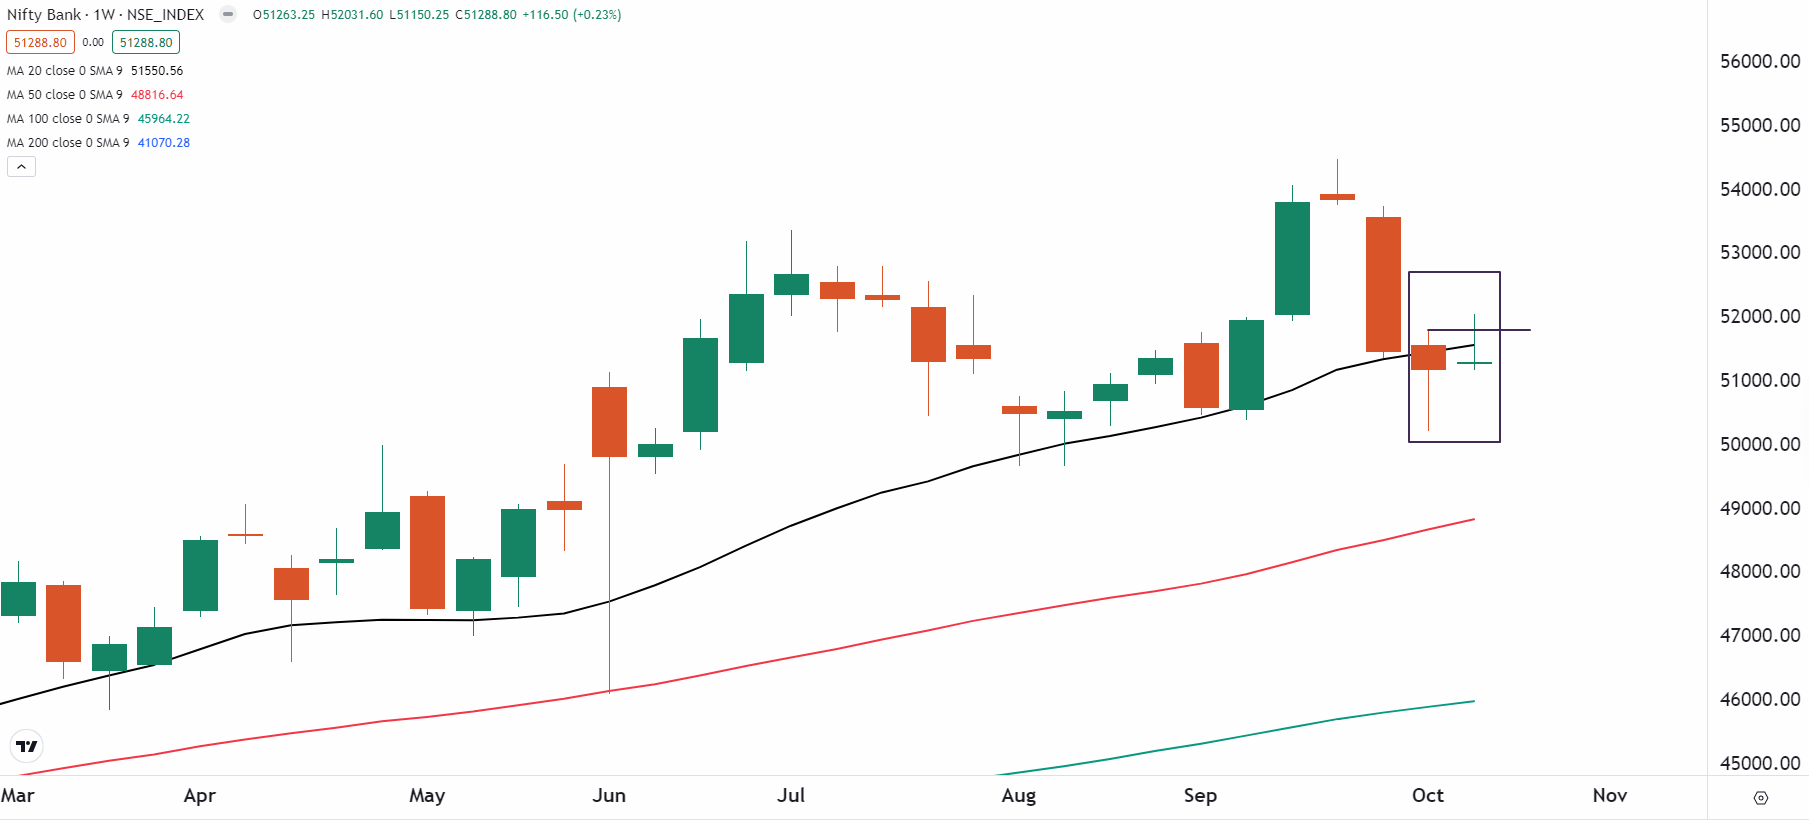
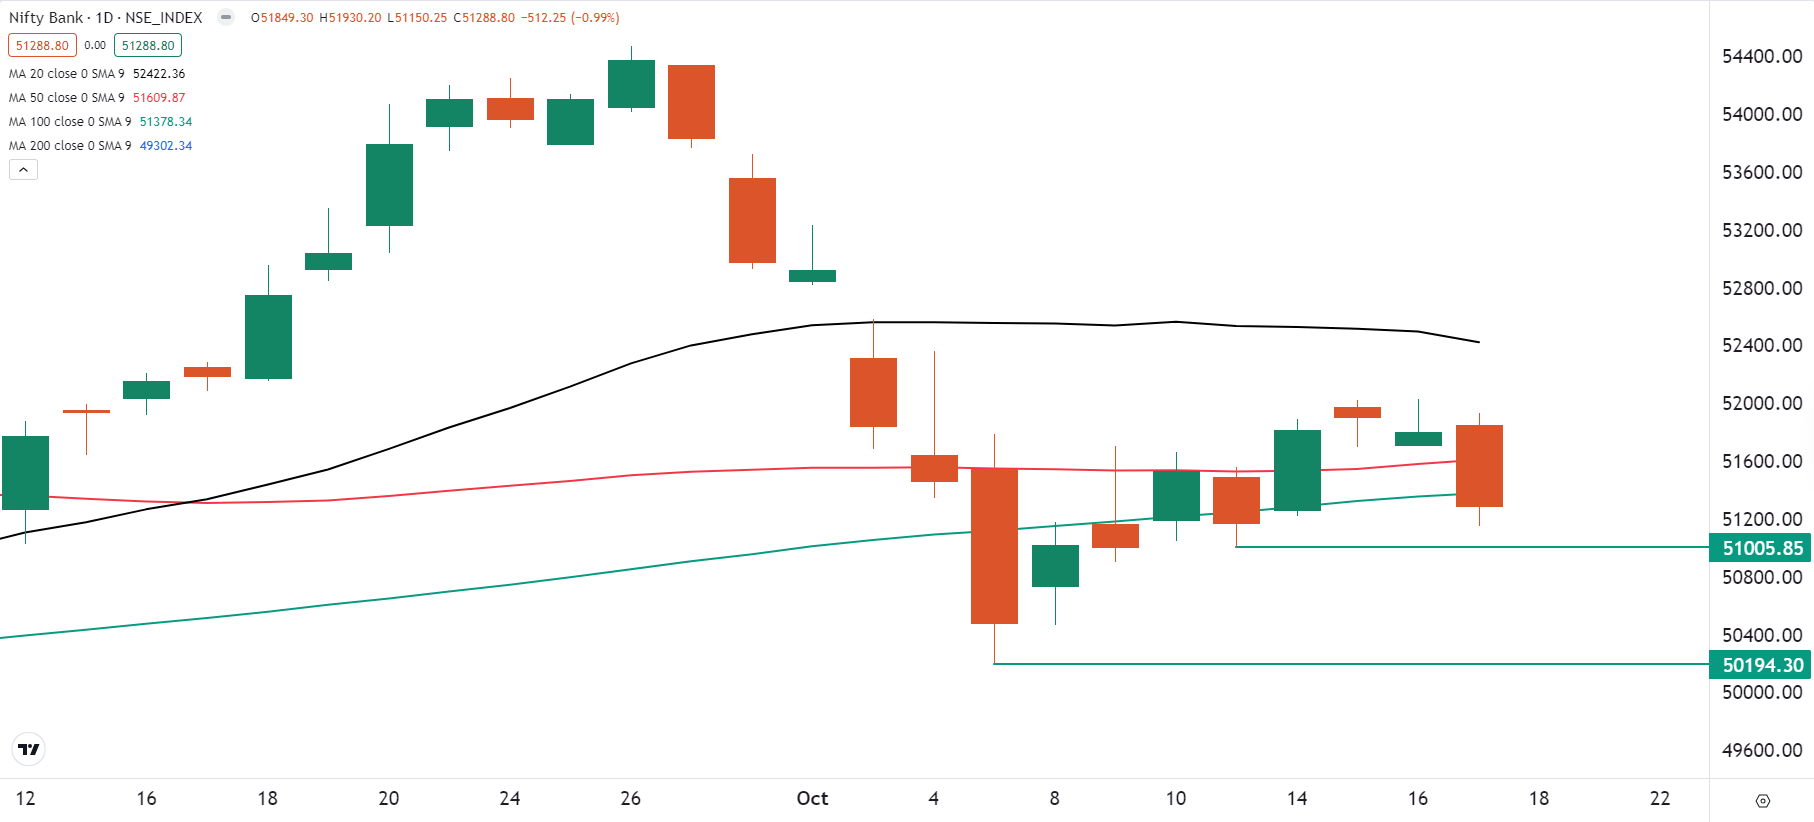
The BANK NIFTY index erased all of its weekly gains and closed the session in red. On the weekly chart, early indications point to a negative close and a failure to close above last week's high could invalidate the hammer candlestick pattern that typically signals a bullish reversal. Failure to confirm this pattern could indicate continued downward pressure in the coming sessions.
On the daily chart, the index slipped below its 50 and 100 day moving averages, forming a bearish engulfing candlestick pattern, signaling potential downside momentum. Traders should closely watch the critical support levels at 51,000 and 50,000. If the index closes below these zones, it could lead to further weakness and extended downward pressure in the near term.
FII-DII activity
Stock scanner
Under F&O ban: Bandhan Bank, Chambal Fertilisers, Gujarat Narmada Valley Fertilizers & Chemicals (GNFC), Granules India, Hindustan Copper, IDFC First Bank, IEX, L&T Finance Manappuram Finance, National Aluminium, Punjab National Bank, RBL Bank, Steel Authority of India and Tata Chemicals
Out of F&O ban: NIL
Added under F&O ban: NIL
In Futures and Options or F&O, long build-up means an increase in Open Interest (OI) along with an increase in price, and short build-up means an increase in Open Interest(OI) along with a decrease in price.
Source: Upstox and NSE.
Disclaimer: Derivatives trading must be done only by traders who fully understand the risks associated with them and strictly apply risk mechanisms like stop-losses. The information is only for consumption by the client and such material should not be redistributed. We do not recommend any particular stock, securities and strategies for trading. The securities quoted are exemplary and are not recommendatory. The stock names mentioned in this article are purely for showing how to do analysis. Take your own decision before investing.
About The Author
Next Story

