Market News
Trade Setup for Oct 14: NIFTY50 faces rejection from 50 DMA, forms doji on daily chart
.png)
4 min read | Updated on October 14, 2024, 08:12 IST


SUMMARY
The NIFTY50 index formed a doji candlestick pattern on the daily chart, which is a neutral pattern. For directional clues, traders can monitor the range of 25,150 and 24,700. A break of this range on closing basis will provide directional clues to the traders.
Stock list
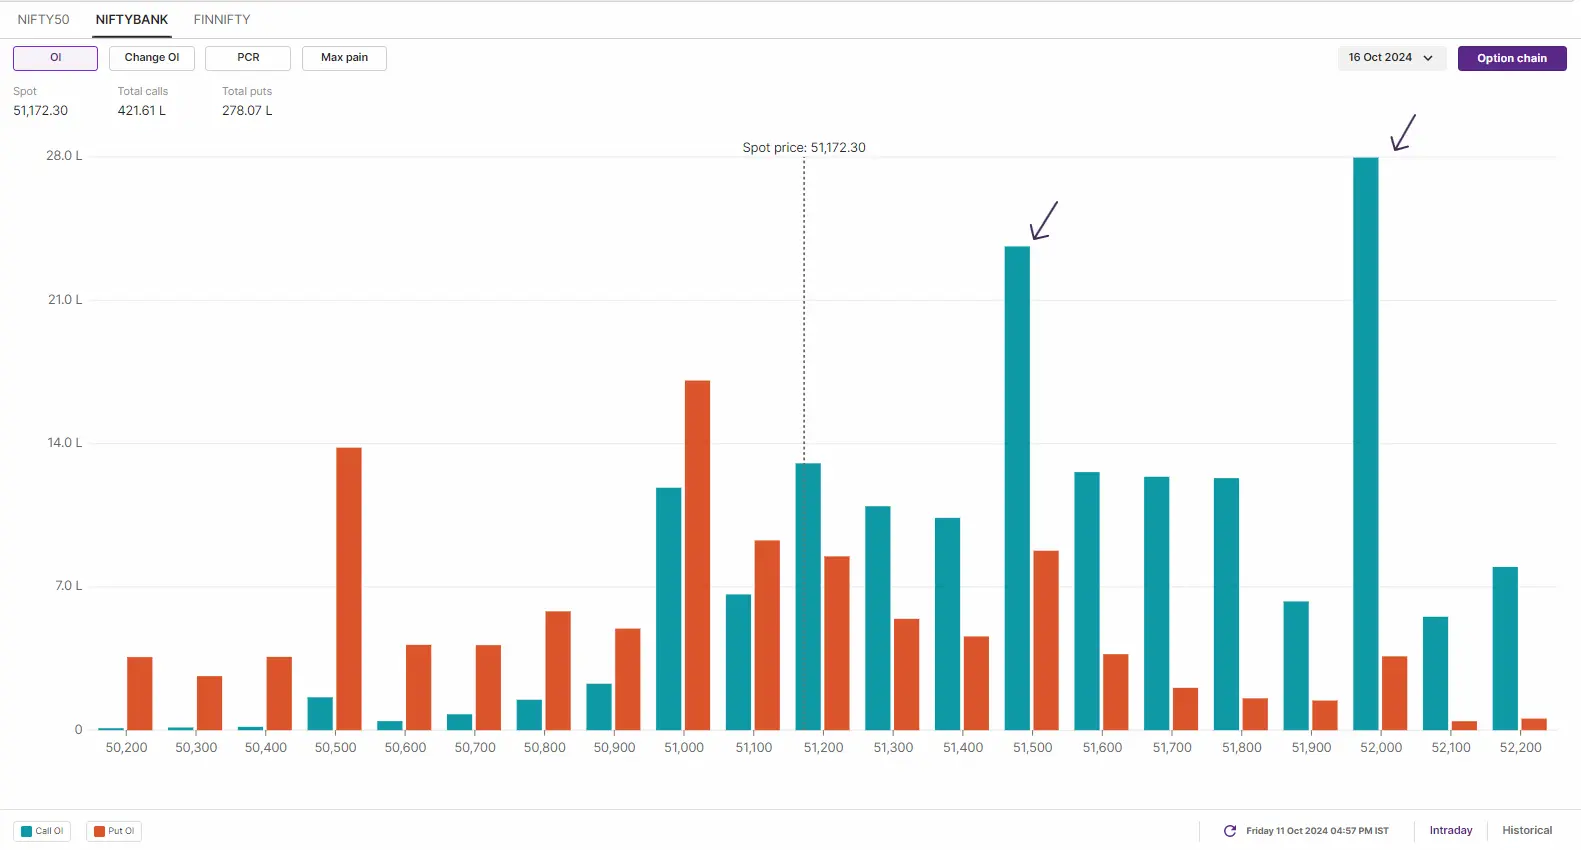
Open interest data for the 16 October Bank Nifty expiry shows a significant build-up of call options at the 51,500 and 52,000 strike levels, suggesting strong resistance for the index around these point.
Asian markets update
The GIFT NIFTY is trading flat, indicating a subdued start for the NIFTY50 today. Meanwhile, other Asian indices are trading mixed. Hong Kong's Hang Seng Index is down over 2%, while China's SSE Composite is up 1%.
U.S. market update
- Dow Jones: 42,863 (▲0.9%)
- S&P 500: 5,815 (▲0.6%)
- Nasdaq Composite: 18,342 (▲0.3%)
U.S. indices ended Friday’s session in the green with S&P 500 and Dow Jones closing at record high levels. The sharp gains on the indices was powered by banking stocks as they started the third quarter earnings on the positive note.
JPMorgan Chase rose over 4% after topping profit and revenue expectations, while Wells Fargo jumped 5% on stronger-than-expected profits. However, investors overlooked disappointing revenue and an 11% decline in net interest income.
NIFTY50
- October Futures: 25,117 (▼0.2%)
- Open Interest: 5,52,666 (▼1.3%)
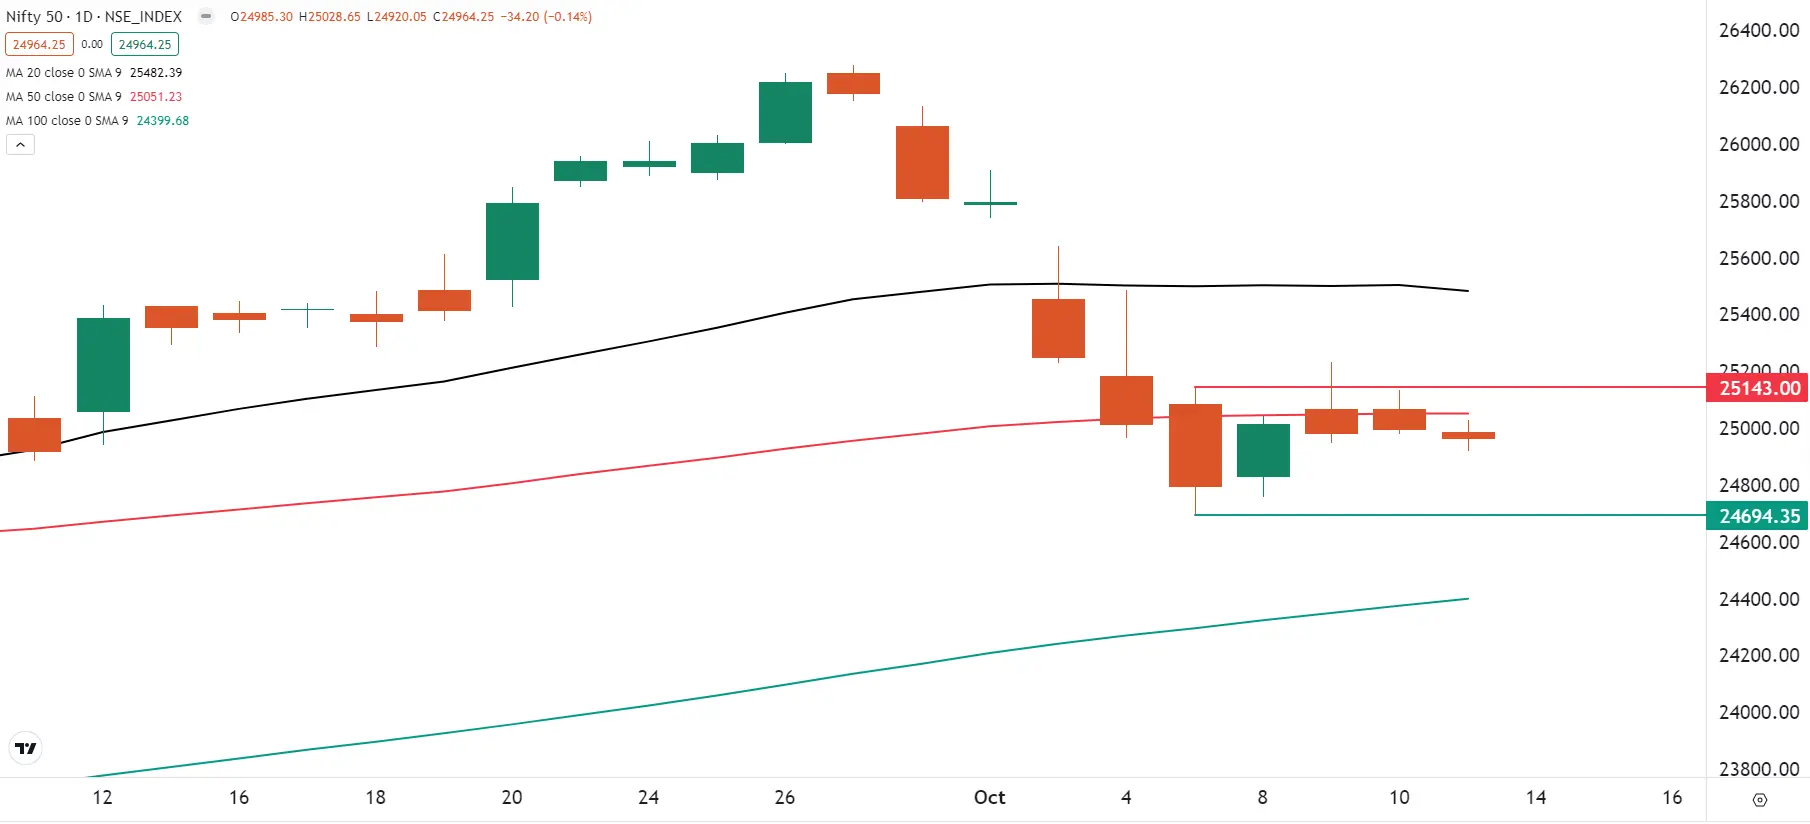
The NIFTY50 index traded in a narrow range for the third day in a row and consolidated around 25,000. The index formed a doji candle on the daily chart on Friday, indicating indecision among investors.
As shown in the chart below, the index is currently trading between 20 and 50 day moving averages, indicating weakness. Additionally, the index formed an inside candle for the fourth consecutive day, trading within the range of 7 October range. The index has immediate resistance around 25,150 and the support is seen at 24,700. A break of this range on the closing basis will provide further directional clues.
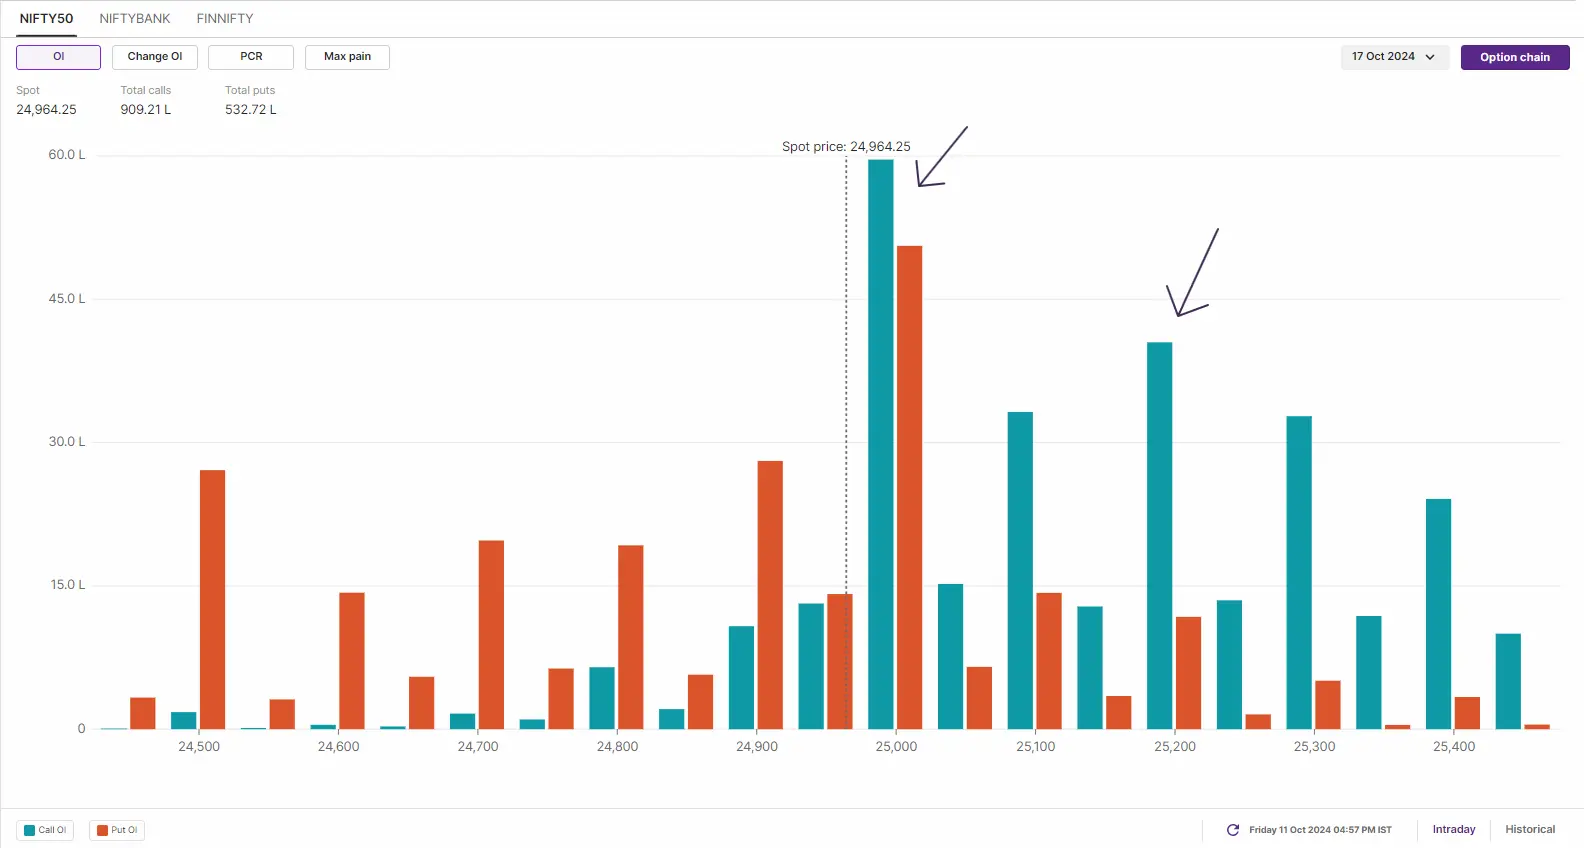
The positioning of the open interest for 17 October expiry has highest call and put base at 25,000 strikes, indicating consolidation around this level. However, traders should closely monitor the change in open interest in the upcoming sessions for better directional clues.
BANK NIFTY
- October Futures: 51,386 (▼0.7%)
- Open Interest: 2,08,600 (▲1.3%)
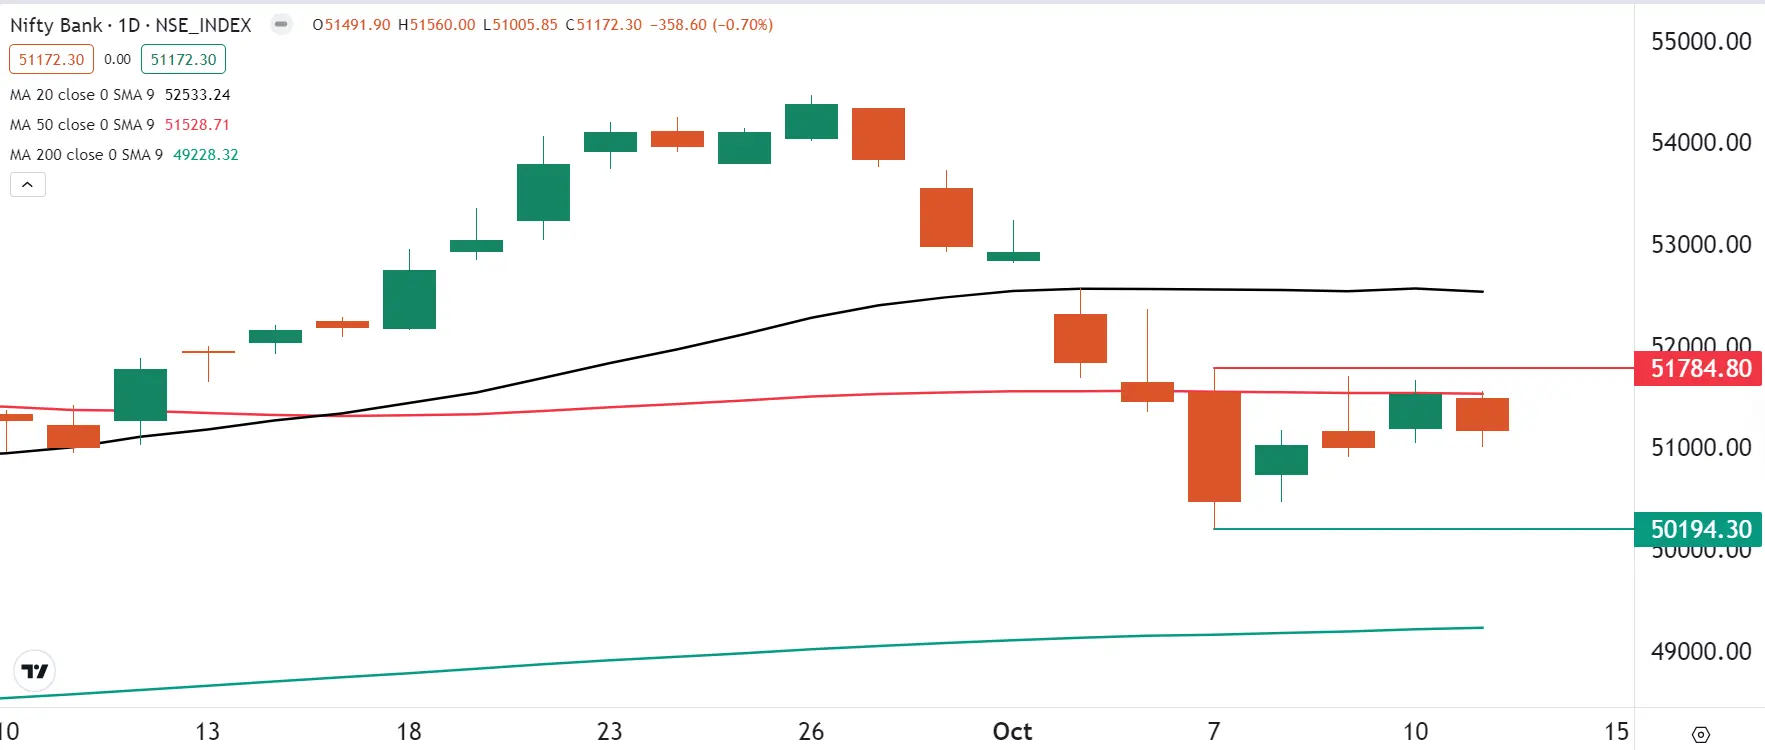
The BANK NIFTY index faced rejection from the 50-day moving average for the third day consecutive day and ended the day in the red. The broader trend of the index remains weak and is broadly consolidating between 20 and 200 day moving averages.
Similar to the NIFTY50, the BANK NIFTY has formed an inside candle on the daily chart for the fourth consecutive day, and remains within the trading range from the 7th of October. As shown in the chart below, the BANK NIFTY faces immediate resistance around the 51,800 level and support around the 50,200 level. This defines a trading range of around 1,600 points.
Open interest data for the 16 October expiry shows a significant build-up of call options at the 51,500 and 52,000 strike levels, suggesting strong resistance for the index around these point. On the other hand, the put base was seen at 51,000 and 50,500 strikes, indicating support for the index around these levels.
FII-DII activity
Stock scanner
Short build-up: Cummins India and L&T Finance
Under F&O ban: Chambal Fertilisers, Gujarat Narmada Valley Fertilizers & Chemicals (GNFC), Granules India, Hindustan Copper, IDFC First Bank, Manappuram Finance, Punjab National Bank, RBL Bank and Steel Authority of India
Out of F&O ban: Bandhan Bank, Birlasoft and Tata Chemicals
Added under F&O ban: NIL
In Futures and Options or F&O, long build-up means an increase in Open Interest (OI) along with an increase in price, and short build-up means an increase in Open Interest(OI) along with a decrease in price.
Source: Upstox and NSE.
Disclaimer: Derivatives trading must be done only by traders who fully understand the risks associated with them and strictly apply risk mechanisms like stop-losses. The information is only for consumption by the client and such material should not be redistributed. We do not recommend any particular stock, securities and strategies for trading. The securities quoted are exemplary and are not recommendatory. The stock names mentioned in this article are purely for showing how to do analysis. Take your own decision before investing.
About The Author
Next Story


