Market News
Trade Setup for Nov 7: NIFTY50 confirms bullish harami pattern, all eyes on 21 EMA
.png)
4 min read | Updated on November 07, 2024, 07:26 IST
SUMMARY
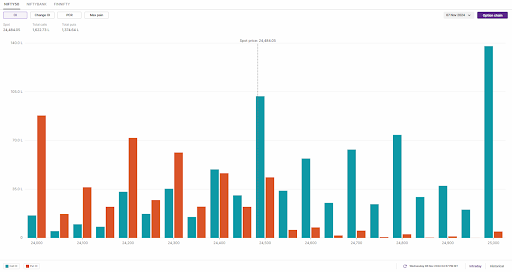
The open interest data for today’s expiry saw significant call build-up at 24,500 strike, indicating the resistance for the NIFTY50 in this zone. The put base was established at 24,000 strike, suggesting support for the index around this zone.
Stock list
The BANK NIFTY index extended its gains for the second day in a row, trading in a narrow range on the weekly options expiry.
Asian markets @ 7 am
- GIFT NIFTY: 24438.5 (-0.2%)
- Nikkei 225: 39,173.36 (-0.78%)
- Hang Seng: 20,468.95 (-0.34%)
- Dow Futures: 43,729.93 (3.57%)
U.S. market update
- Dow Jones: 43,729 (▲3.5%)
- S&P 500: 5,929 (▲2.5%)
- Nasdaq Composite: 18,983 (▲2.4%)
U.S. indices ended Wednesday's session with strong gains as Donald Trump won the 2024 presidential election. Indices hit a new all-time high with the Dow Jones surging over 1,500 points, led by strong gains in banking stocks with JPMorgan Chase and Wells Fargo up over 10%. On the other hand, Tesla shares jumped more than 14% after the EV maker's CEO Elon Musk endorsed and supported Donald Trump's campaign.
NIFTY50
- November Futures: 24,587 (▲1.2%)
- Open Interest: 4,44,227 (▼0.6%)
The NIFY50 extended its bullish momentum for the second consecutive day, rising over 1%, led by strong gains in the index's heavyweight IT stocks. The index confirmed the bullish harami formed on the 5th as it closed above the high of the reversal pattern.
A bullish harami is a bullish reversal two-candle pattern that signals a possible reversal from a downtrend to an uptrend. However, the index is approaching the critical resistance zone of 24,500 and 24,600, which coincides with the 21-day exponential average (EMA). If it closes above the 21-EMA, then the index may extend the bullish move upto 50-EMA. However, a rejection from the 21-EMA, will signal weakness.
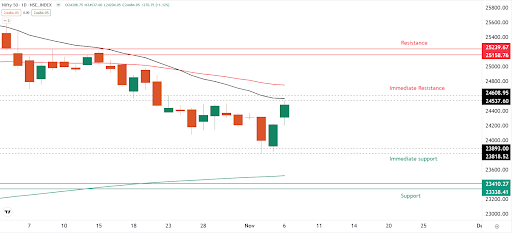
On the 15-minute chart, the index is broadly trading in the range of 24,600 and 23,800. The index has immediate support between 24,300 and 24,350 range. If the index slips below this zone, it may extend the weakness till 24,000. However, if the index sustain above 24,600, then it may extend the gains till 24,800.
The open interest data for today’s expiry has highest call base at 24,500 and 25,000 strikes, indicating that the index may face resistance around these levels. On the flip side, the index saw the substantial put build-up at 24,000 strike, indicating support for the index around this zone.
BANK NIFTY
- November Futures: 52,393 (▲1.5%)
- Open Interest: 1,64,535 (▼9.2%)
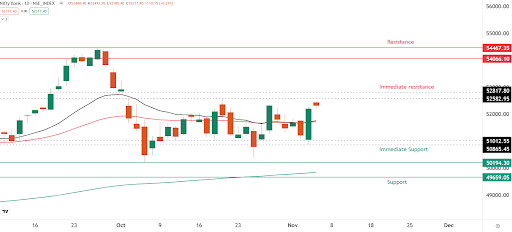
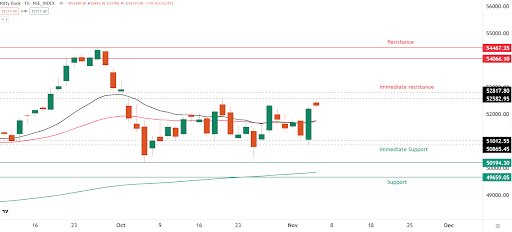
The BANK NIFTY index extended its gains for the second day in a row, trading in a narrow range on the weekly options expiry. The index has formed a doji candlestick pattern on the daily chart, indicating a pause after the formation of the bullish engulfing pattern on the 5th.
The technical structure of the index is currently at a crucial juncture. The index formed a neutral candle, but closed above the high of the bullish engulfing candle on 5th November. Traders can watch the price action around the immediate resistance zone of 52,600 and 52,800. If the index captures this area on a closing basis, it could extend its gains towards the 54,000, which is the zone of the previous all-time high. Conversely, a close below the 50 EMA will negate the bullish engulfing pattern.
FII-DII activity
Stock scanner
Short build-up: NIL
Under F&O ban: NIL
In Futures and Options or F&O, long build-up means an increase in Open Interest (OI) along with an increase in price, and short build-up means an increase in Open Interest(OI) along with a decrease in price.
Source: Upstox and NSE.
Disclaimer: Derivatives trading must be done only by traders who fully understand the risks associated with them and strictly apply risk mechanisms like stop-losses. The information is only for consumption by the client and such material should not be redistributed. We do not recommend any particular stock, securities and strategies for trading. The securities quoted are exemplary and are not recommendatory. The stock names mentioned in this article are purely for showing how to do analysis. Take your own decision before investing.
About The Author
Next Story
