Market News
Trade Setup for Nov 29: Will NIFTY50 confirm the bullish hammer on the weekly chart?
.png)
4 min read | Updated on November 29, 2024, 07:21 IST
SUMMARY
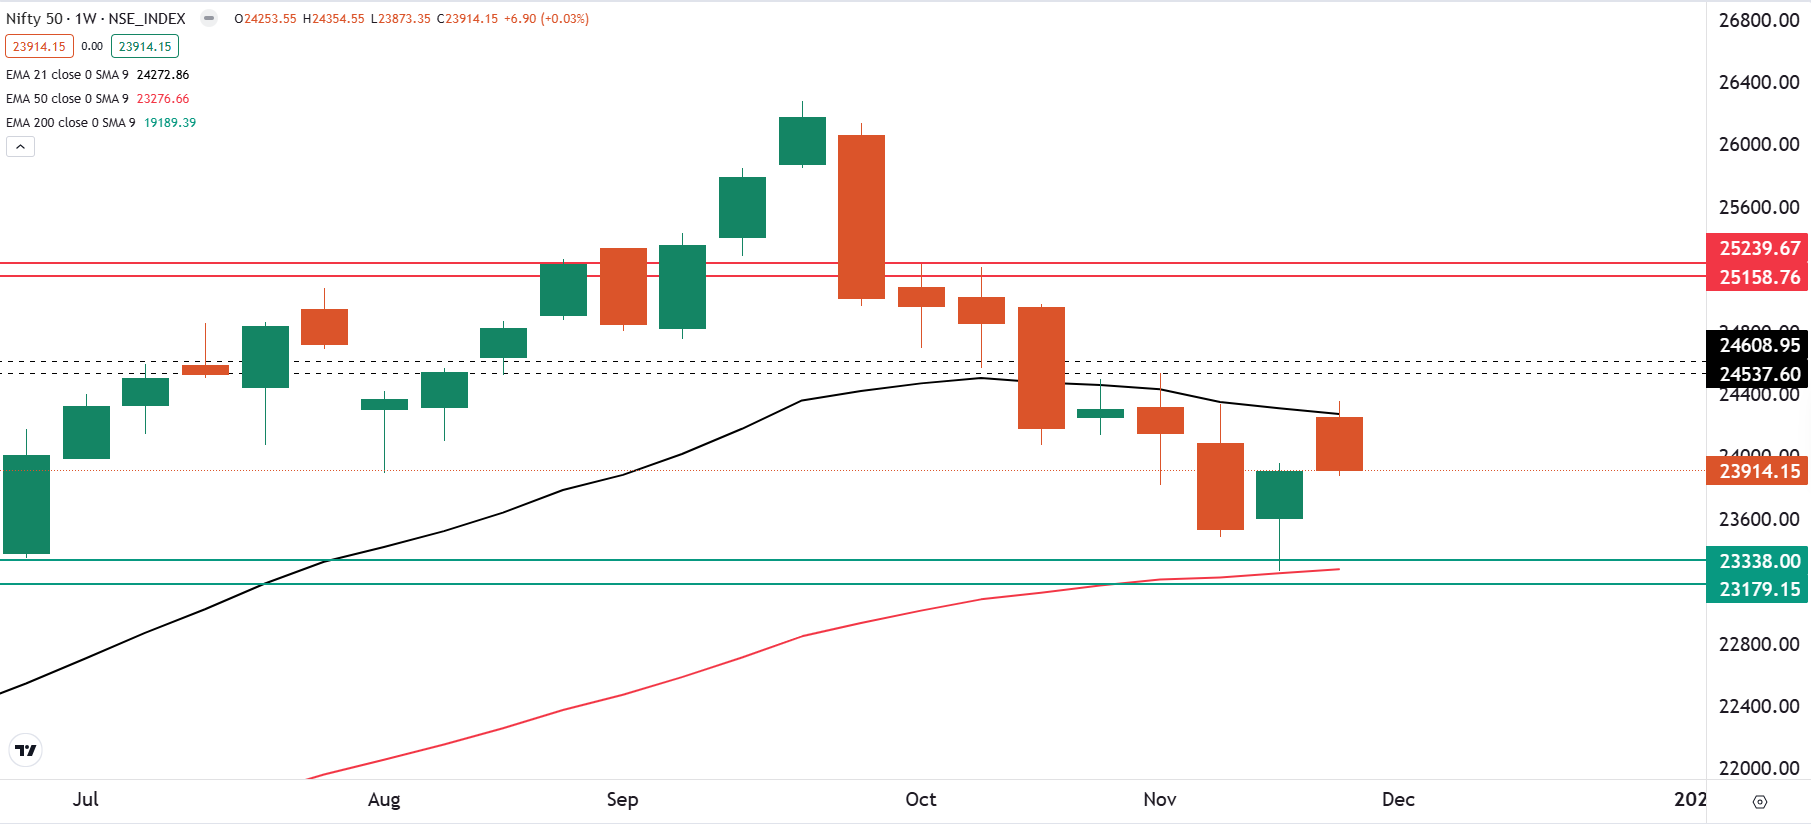
Last week, the NIFTY50 index formed a hammer candlestick pattern, typically regarded as a bullish reversal signal. Although the index attempted a recovery up to its 50 EMA, it struggled to sustain the gains, leaving it at a pivotal point. A close above the previous week’s high would confirm the reversal pattern, suggesting strength and potential upside. Conversely, a close below the previous week’s high would invalidate the pattern, signaling continued weakness.
Stock list
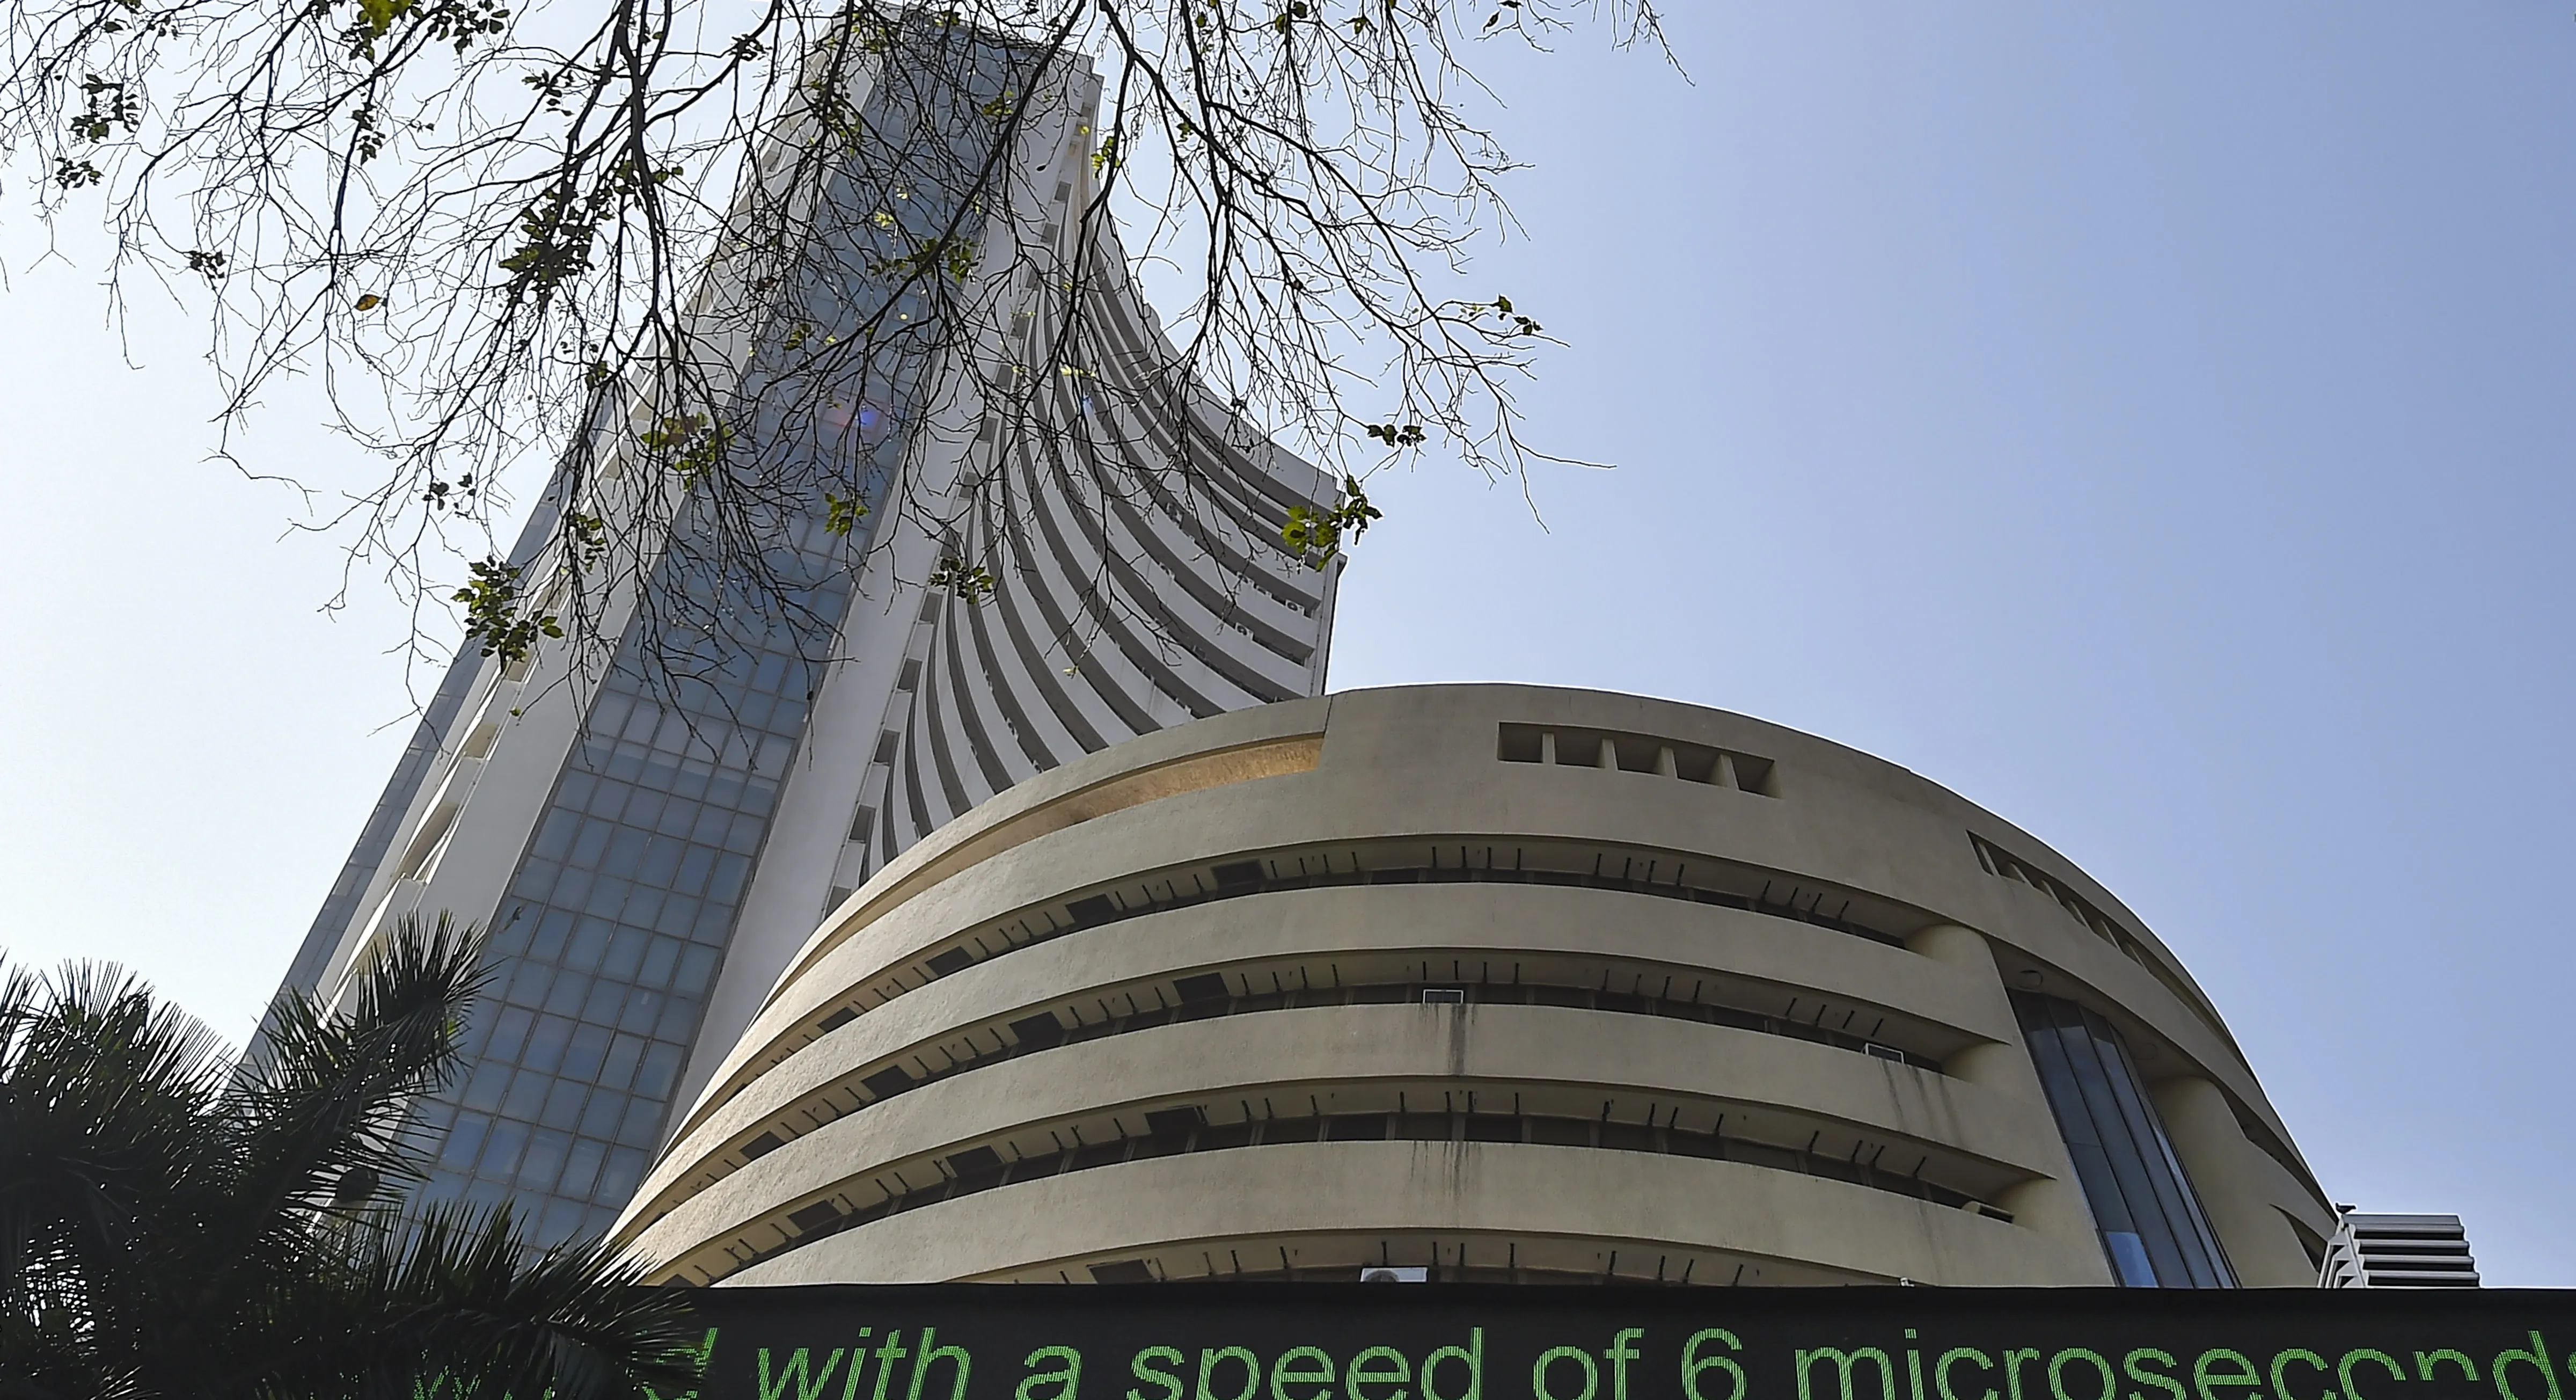
After a flat start, the NIFTY50 index ended the the three day consolidation and closed the monthly expiry of its F&O contracts on negative note.
Asian markets @ 7 am
- GIFT NIFTY: 24,131 (+0.05%)
- Nikkei 225: 38,099 (-0.65%)
- Hang Seng: 19,400 (+0.17%)
U.S. market update
In observance of the Thanksgiving holiday, U.S. stock markets were closed on Thursday, 28 November and will close early on Friday, 29 November.
NIFTY50
- December Futures: 24,155 (▼1.2%)
- Open Interest: 4,71,427 (▲68.0%)
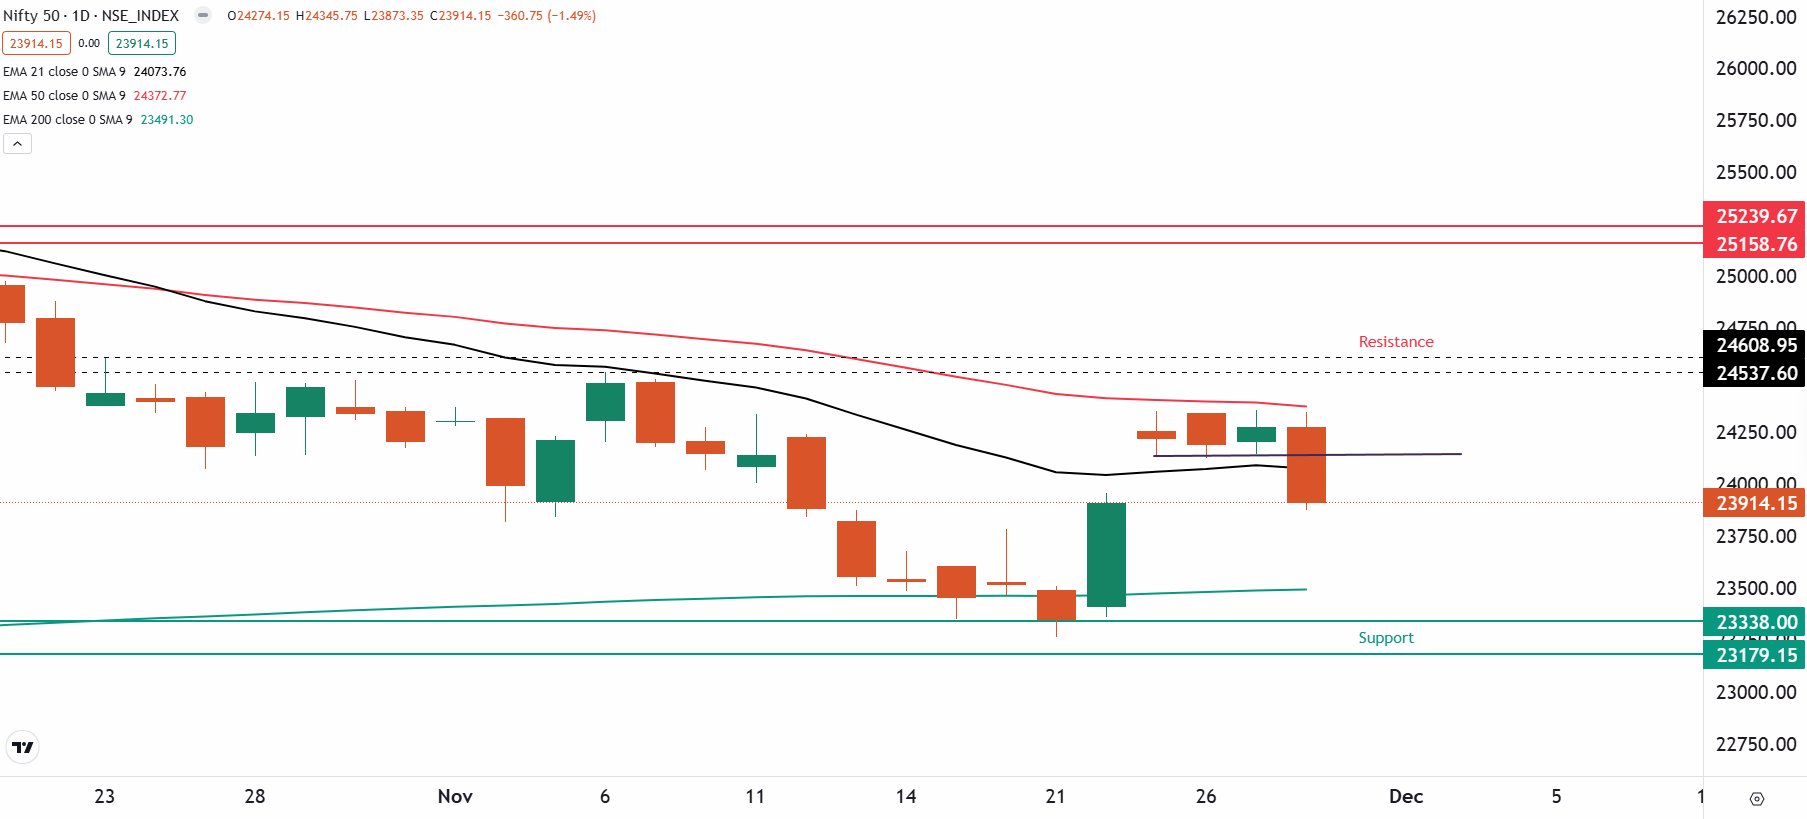
After a flat start, the NIFTY50 index ended the the three day consolidation and closed the monthly expiry of its F&O contracts on negative note, shedding over 1%. The index formed a bearish marubozu candle on the daily chart, ending the day below 21 day exponential moving average (EMA).
On the weekly chart, the NIFTY50 index is currently trading below the previous week's high, signaling potential weakness. Last week, the index formed a hammer candlestick pattern, typically seen as a bullish reversal signal. In today’s session, traders should carefully watch the weekly close. A close above the previous week’s high could confirm the reversal, paving the way for further upside. Conversely, if the index closes below the previous week’s high, it may continue to exhibit weakness, potentially declining toward the 50-week EMA, around 23,200.
The daily chart’s technical structure turned bearish as the NIFTY50 index slipped below the immediate support at 24,150, breaking its three-day consolidation. From a positional perspective, if the index closes below 23,800, it may retest the 200-day EMA near 23,500. However, a close above 24,600 could shift momentum back in favor of the bulls
SENSEX
- Max call OI: 82,000
- Max put OI: 77,000
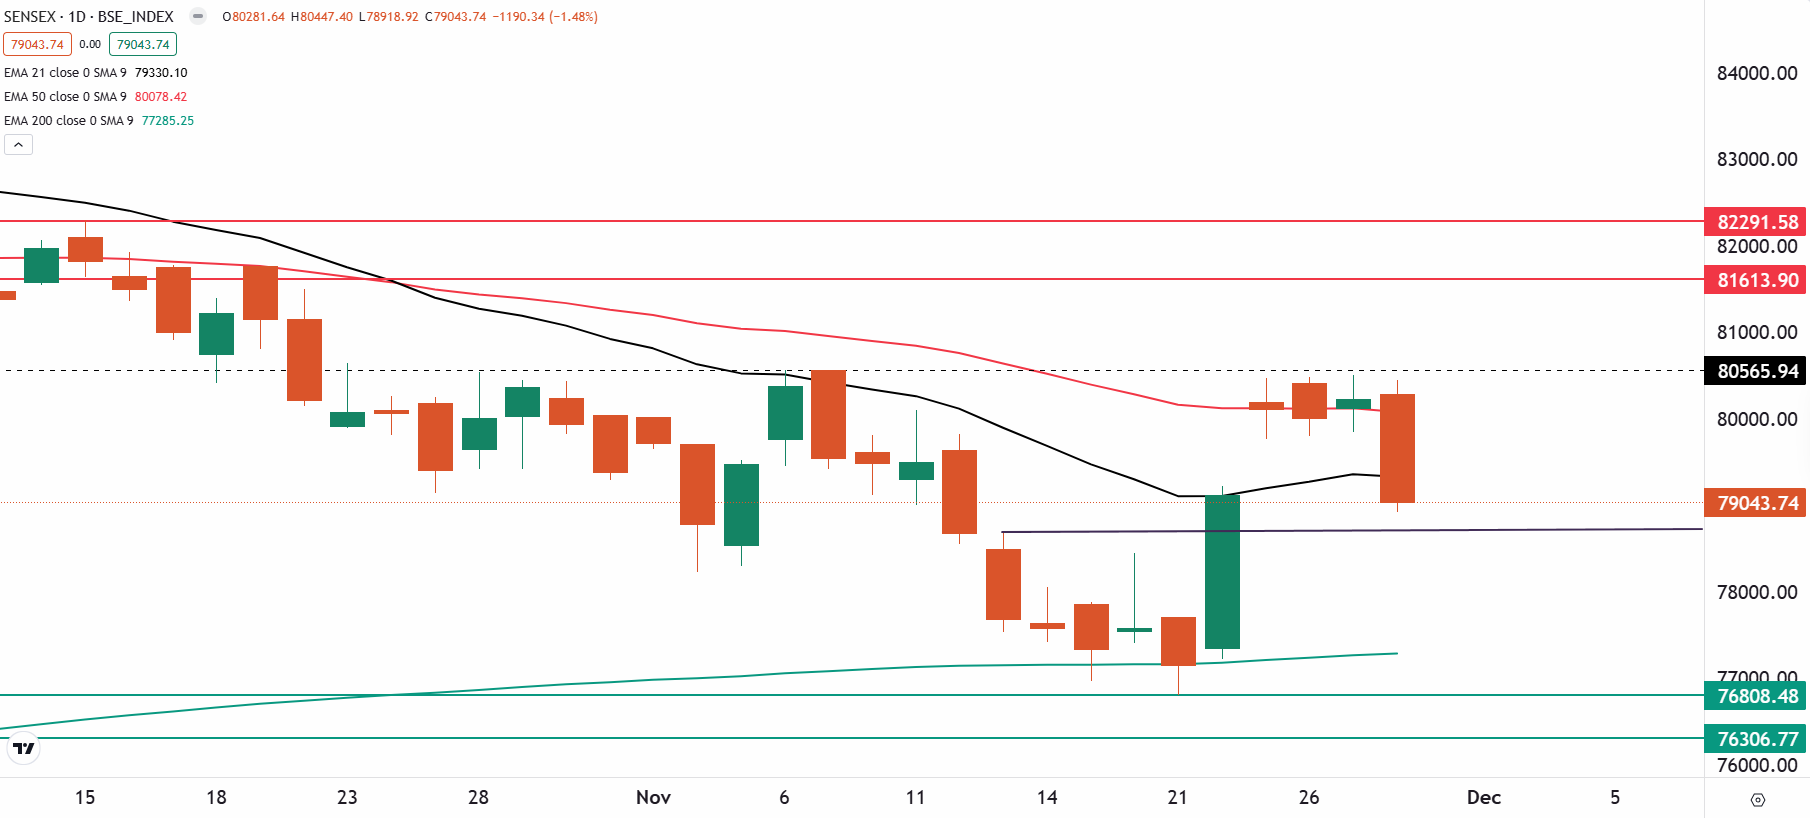
The SENSEX also lost over 1% ahead of the monthly expiry of its options contracts, forming a bearish candlestick pattern on the daily chart. The index also surrendered the 21 EMA on the daily chart, indicating weakness for the upcoming sessions.
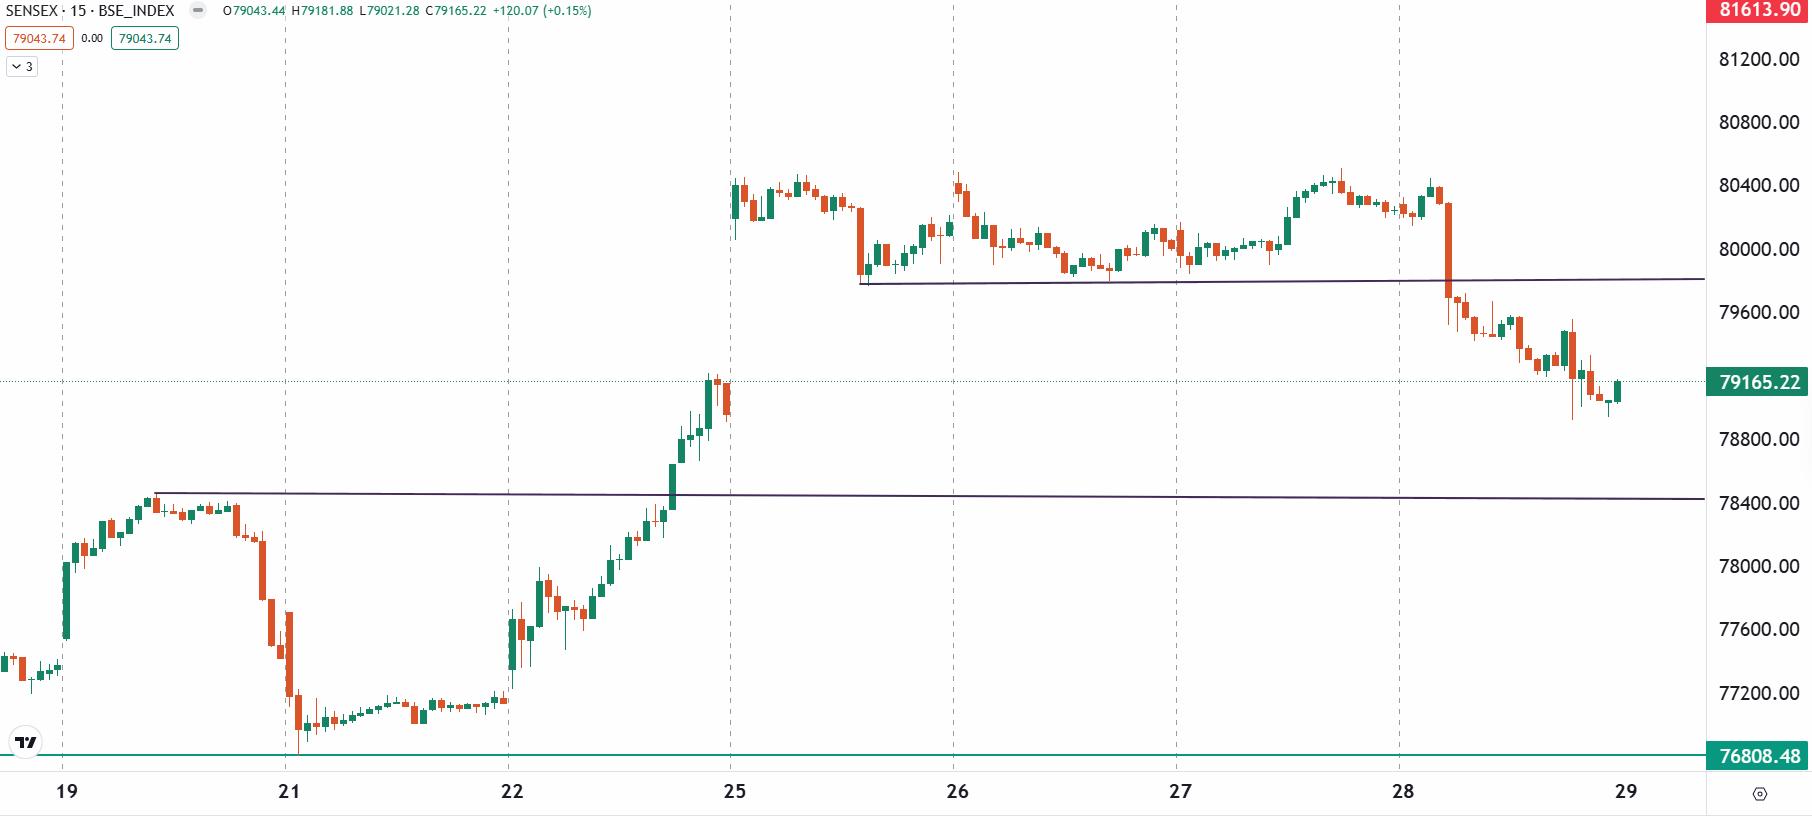
On the daily chart, the index faces immediate resistance near the 80,500 zone, concluding its three-day consolidation with a negative bias. On the downside, the immediate support lies around 78,700. A breach below this level could extend weakness toward the 77,300 zone, aligning with its 200 EMA.
For today’s expiry, traders should focus on the highlighted range on the 15-minute chart. A breakout above the 80,200 zone with a strong candle could propel the index toward the 80,500 resistance. Conversely, a decisive close below 78,400 would signal further downside potential.
FII-DII activity
Stock scanner
- Long build-up: Exide Industries and ICICI Prudential
- Short build-up: SBI Life Insurance, HDFC Life, Adani Ports, Max Financial Services and Infosys
- Under F&O ban: NIL
In Futures and Options or F&O, long build-up means an increase in Open Interest (OI) along with an increase in price, and short build-up means an increase in Open Interest(OI) along with a decrease in price. Source: Upstox and NSE.
Disclaimer: Derivatives trading must be done only by traders who fully understand the risks associated with them and strictly apply risk mechanisms like stop-losses. The information is only for consumption by the client and such material should not be redistributed. We do not recommend any particular stock, securities and strategies for trading. The securities quoted are exemplary and are not recommendatory. The stock names mentioned in this article are purely for showing how to do analysis. Take your own decision before investing.
About The Author
Next Story

