Market News
Trade setup for March 7: NIFTY50 bounces back above 10-day EMA, eyes crucial 22,800 resistance
.png)
4 min read | Updated on March 07, 2025, 07:17 IST


SUMMARY
The NIFTY50 index rebounded above the 10-day exponential moving average after a gap of seventeen sessions, reclaiming the immediate resistance zone of 22,500 zone. For the upcoming sessions, traders can monitor the range of 22,250 and 22,800. A break of this range will provide further directional clues.

The NIFTY50 extended its bullish momentum for the second consecutive day, closing with nearly a one percent gain. | Image: Shutterstock
Asian markets @ 7 am
- GIFT NIFTY: 22,556 (-0.11%)
- Nikkei 225: 37,072 (-1.68%)
- Hang Seng: 24,182 (-0.77%)
U.S. market update
- Dow Jones: 42,579 (▼0.9%)
- S&P 500: 5,738 (▼1.7%)
- Nasdaq Composite: 18,069 (▼2.6%)
U.S. indices resumed their sell-off as the concessions from the White House on President Donald Trump’s concessions on trade tariffs failed to calm investors. Thursday's sell-off came as Canada and China responded with retaliatory tariffs of their own, while Mexico said it would announce measures over the weekend.
NIFTY50
- Max call OI: 23,000
- Max put OI: 22,500
- (10 Strikes from ATM, Expiry: 13 March)
The NIFTY50 extended its bullish momentum for the second consecutive day, closing with nearly a one percent gain. The sharp gains on the index was led by broad based gains across sectors. The index surged past the 22,500 resistance zone and reclaimed its 10-day exponential moving average.
The index formed a bullish candle on the daily chart leaving a long wick, signalling buying interest from lower levels. However, it also looks similar to the hanging man candlestick pattern which is a bearish reversal pattern. The pattern appears after an uptrend with a small body and long lower shadow, suggesting potential trend change at higher levels. The pattern gets confirmed if the close of the subsequent candle is below the reversal pattern
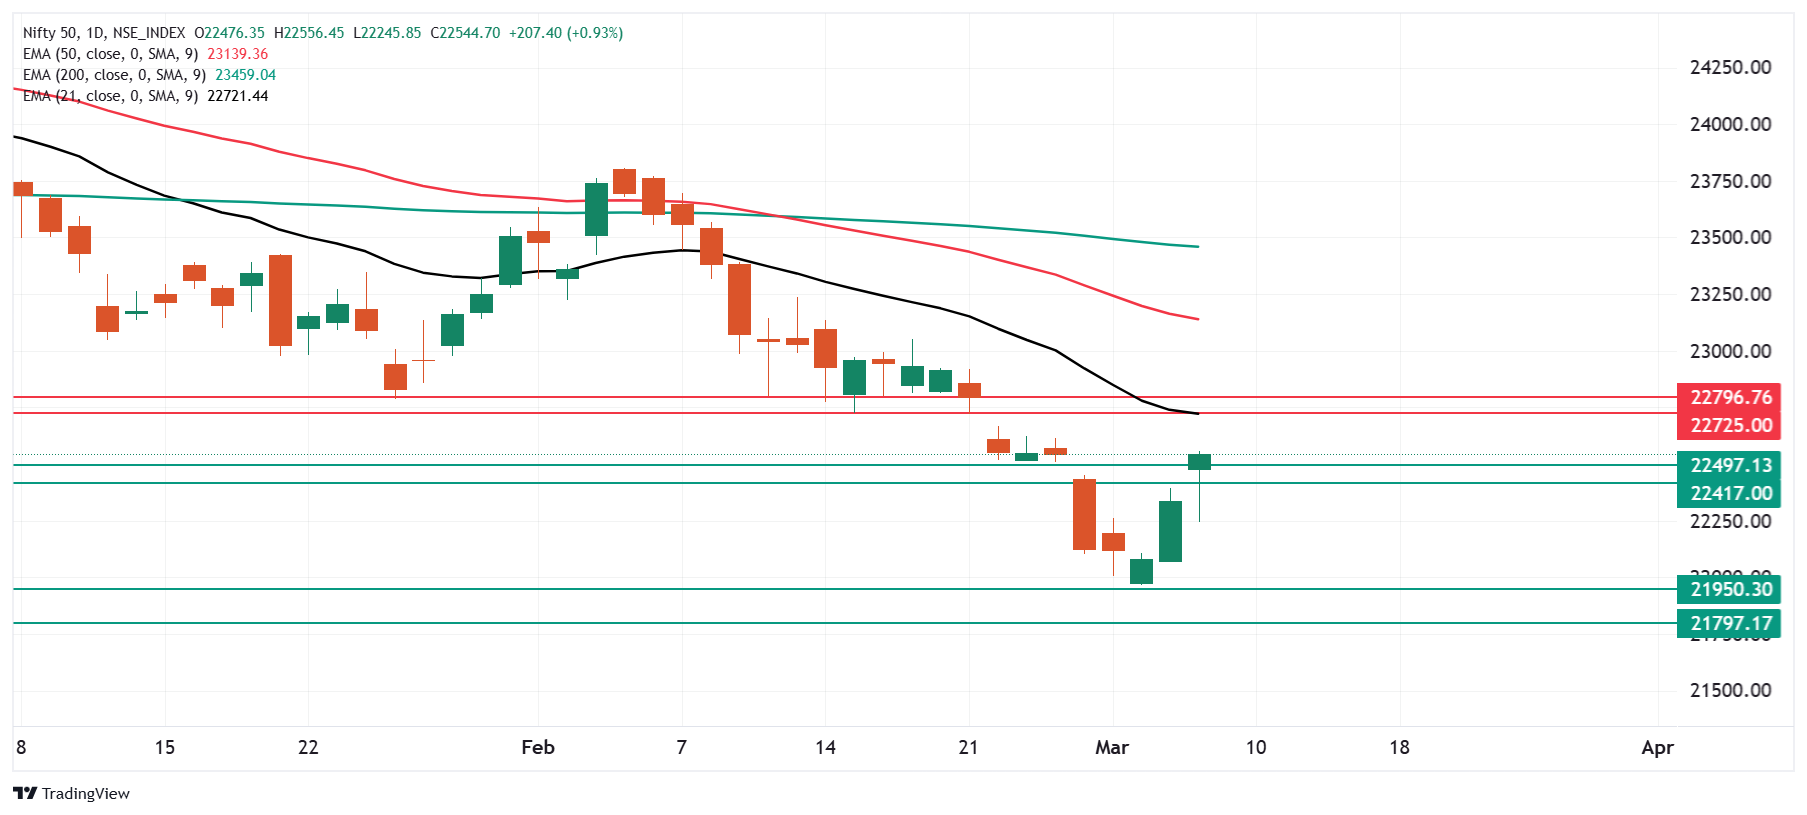
The immediate support for the index is around the 22,250 zone, while the crucial support for the index is around the 22,000 zone. Unless the index slips below this zone, the trend may remain bullish. The crucial resistance for the index is between the 21,700 and 21,800 zone. A close above this zone will further strengthen the bullish sentiment.
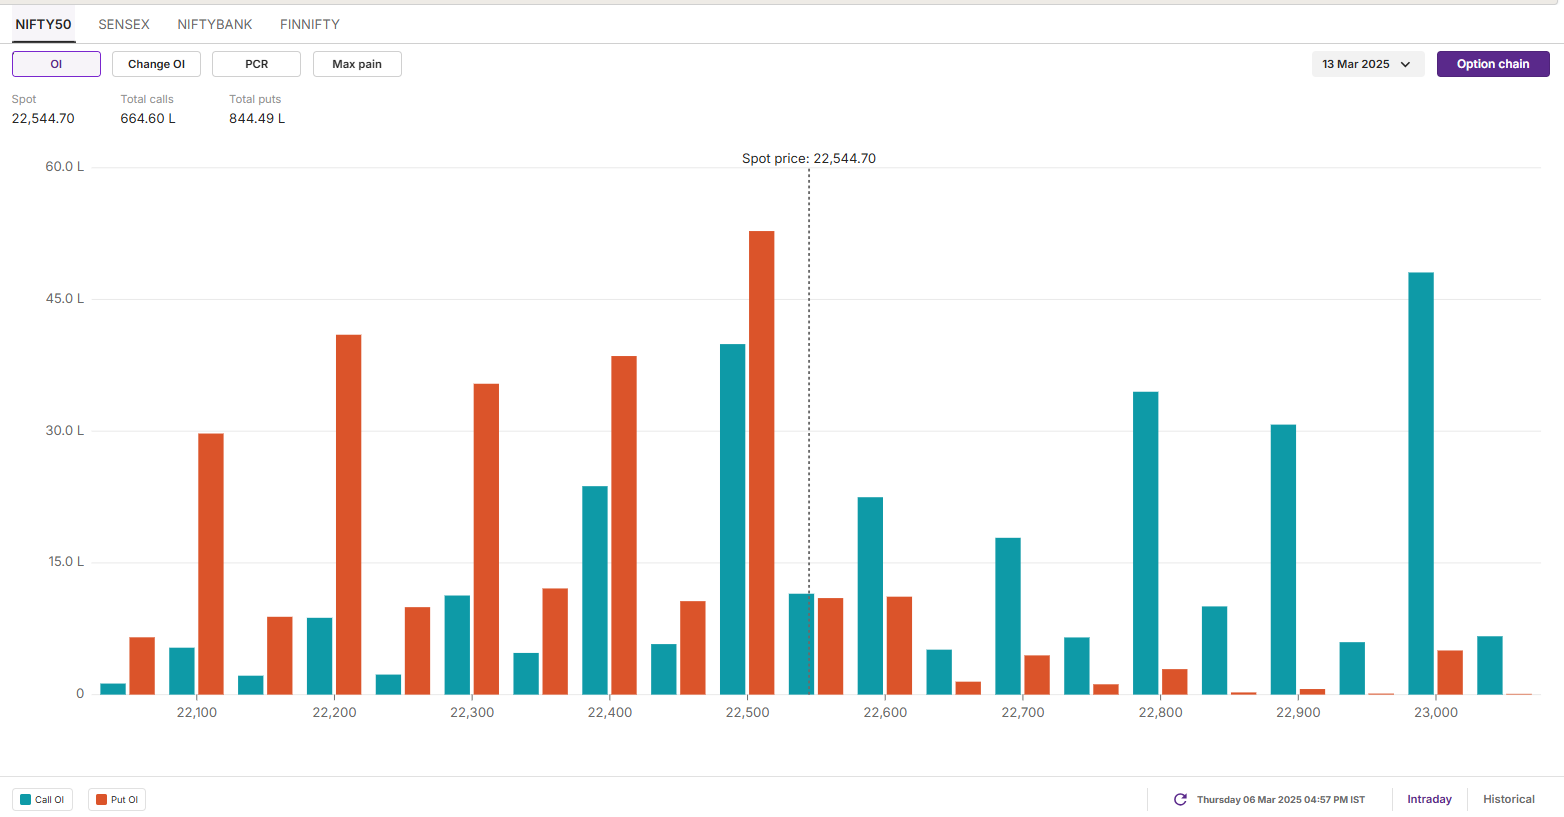
The initial open interest data for the 13 March expiry saw a significant call base at 23,000 strike, indicating resistance for the index around this level. Conversely, the put base was observed at 22,500 strike, suggesting support for the index around this zone.
SENSEX
- Max call OI: 75,000
- Max put OI: 74,000
- (10 Strikes from ATM, Expiry: 11 March)
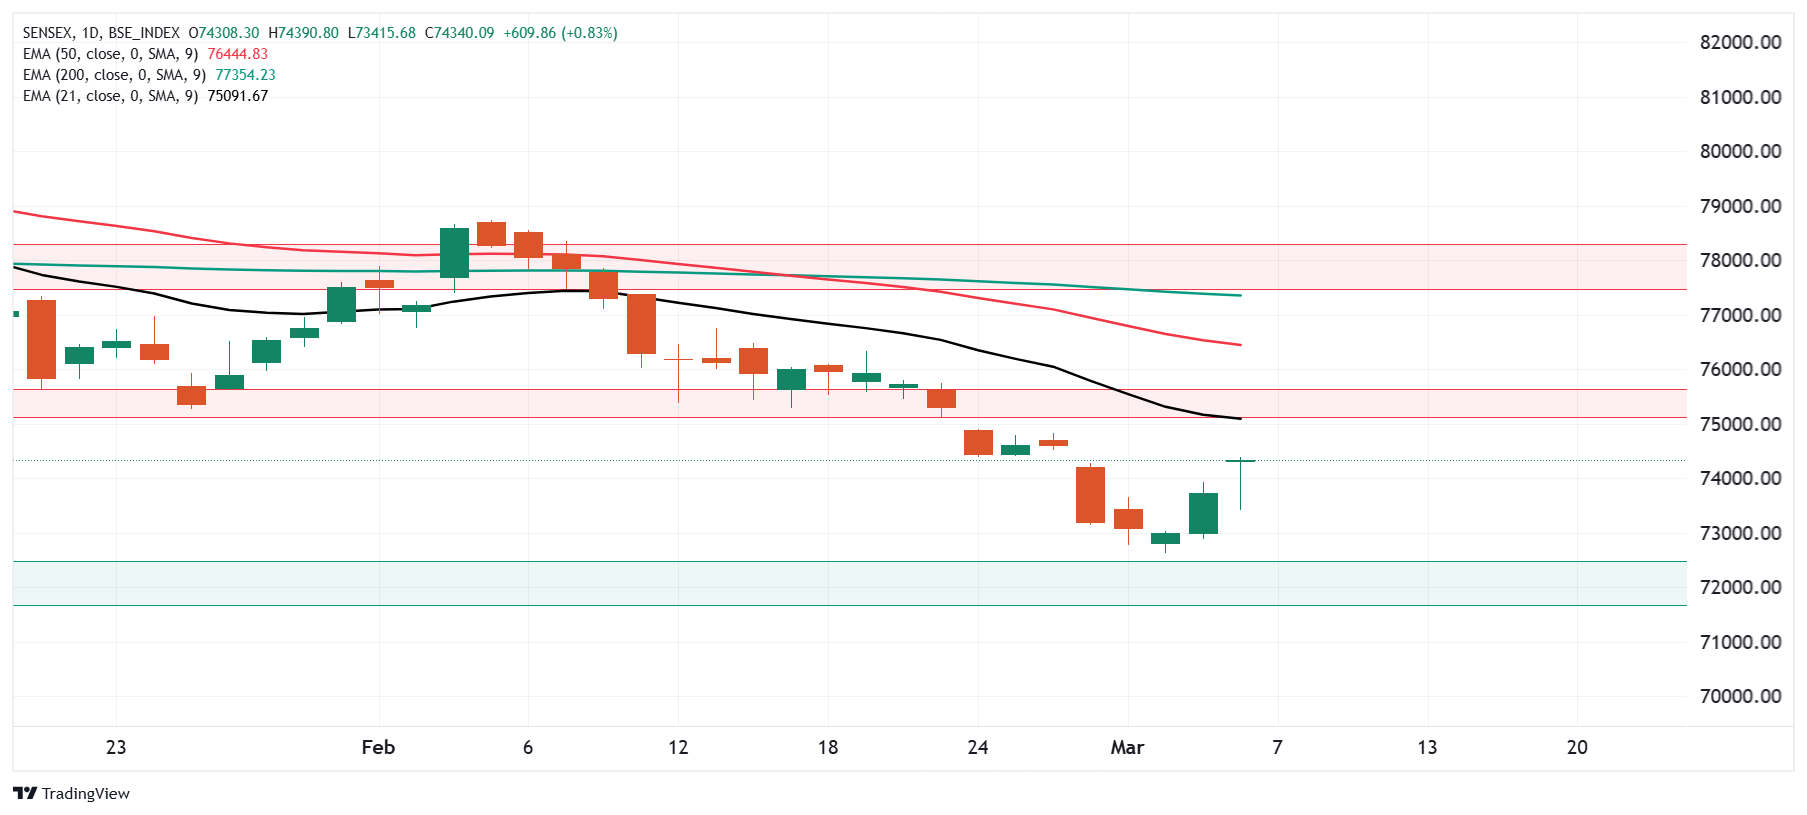
The SENSEX extended the rebound for the second day in a row forming the hanging man candlestick pattern on the daily chart. The index has immediate support around the 73,400 zone with crucial support around the 72,400 zone. Unless the index slips below these zones on a closing basis, the trend may remain bullish.
However, the immediate resistance zone for the index is around the 75,500 zone, which also coincides with its 21-day exponential moving average. If the index closes above this zone then it will extend the bullish momentum towards the 78,000 zone.
The open interest data for the 11 March expiry saw a significant call base at 75,000 strike, suggesting immediate resistance for the index around this zone. Meanwhile, the put base of the index was observed at 74,000 strike, indicating support for the index around this zone.
FII-DII activity
Stock scanner
- Long build-up: IIFL Finance, Jindal Stainless, Nykaa, Apollo Tyres and IREDA
- Short build-up: Kalyan Jewellers, Tech Mahindra, BSE, Persistent Systems and JSW Energy
- Top traded futures contracts: HDFC Bank, Reliance Industries, Tata Steel, Axis Bank and ICICI Bank
- Top traded options contracts: Reliance 1200 CE, Bajaj Finance 8400 CE, Tata Steel 150 CE, HDFC Bank 1700 CE and BSE 4300 CE
- Under F&O ban: Manappuram Finance
In Futures and Options or F&O, long build-up means an increase in Open Interest (OI) along with an increase in price, and short build-up means an increase in Open Interest(OI) along with a decrease in price. Source: Upstox and NSE.
Disclaimer: Derivatives trading must be done only by traders who fully understand the risks associated with them and strictly apply risk mechanisms like stop-losses. The information is only for consumption by the client and such material should not be redistributed. We do not recommend any particular stock, securities and strategies for trading. The securities quoted are exemplary and are not recommendatory. The stock names mentioned in this article are purely for showing how to do analysis. Take your own decision before investing.
About The Author
Next Story


