Market News
Trade setup for March 3: NIFTY50 extends losing streak for eight days, slips to 22,000 support zone
.png)
4 min read | Updated on March 03, 2025, 07:23 IST


SUMMARY
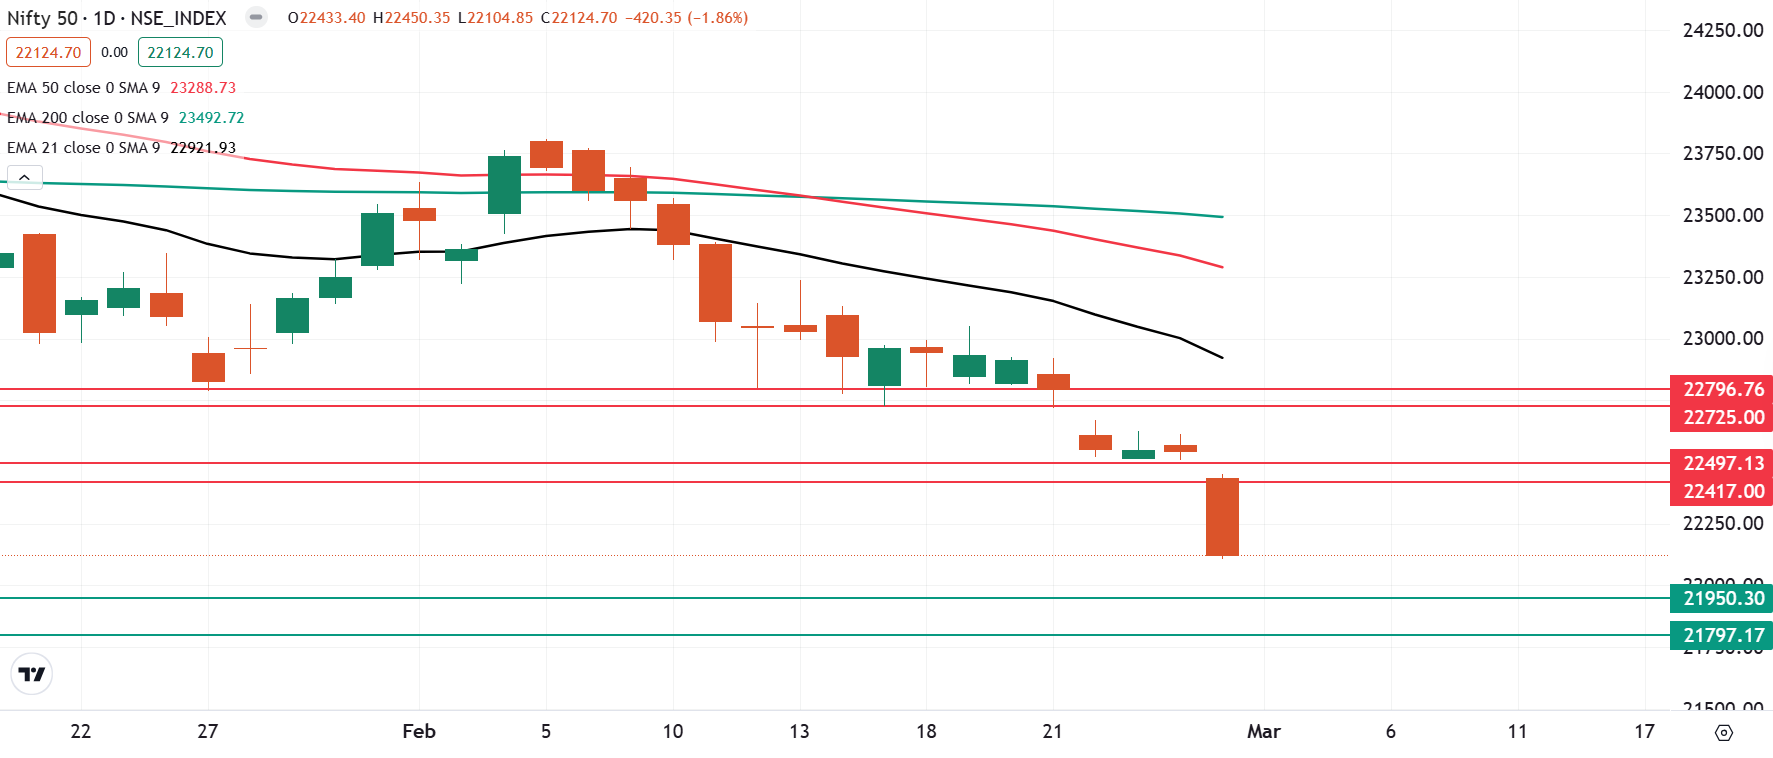
The NIFTY50 extended its losing streak to eight consecutive sessions, forming a bearish candle on the daily chart. The index's short-term structure has entered oversold territory, having failed to close above the previous session’s high for 17 straight sessions, signaling persistent weakness.
Stock list
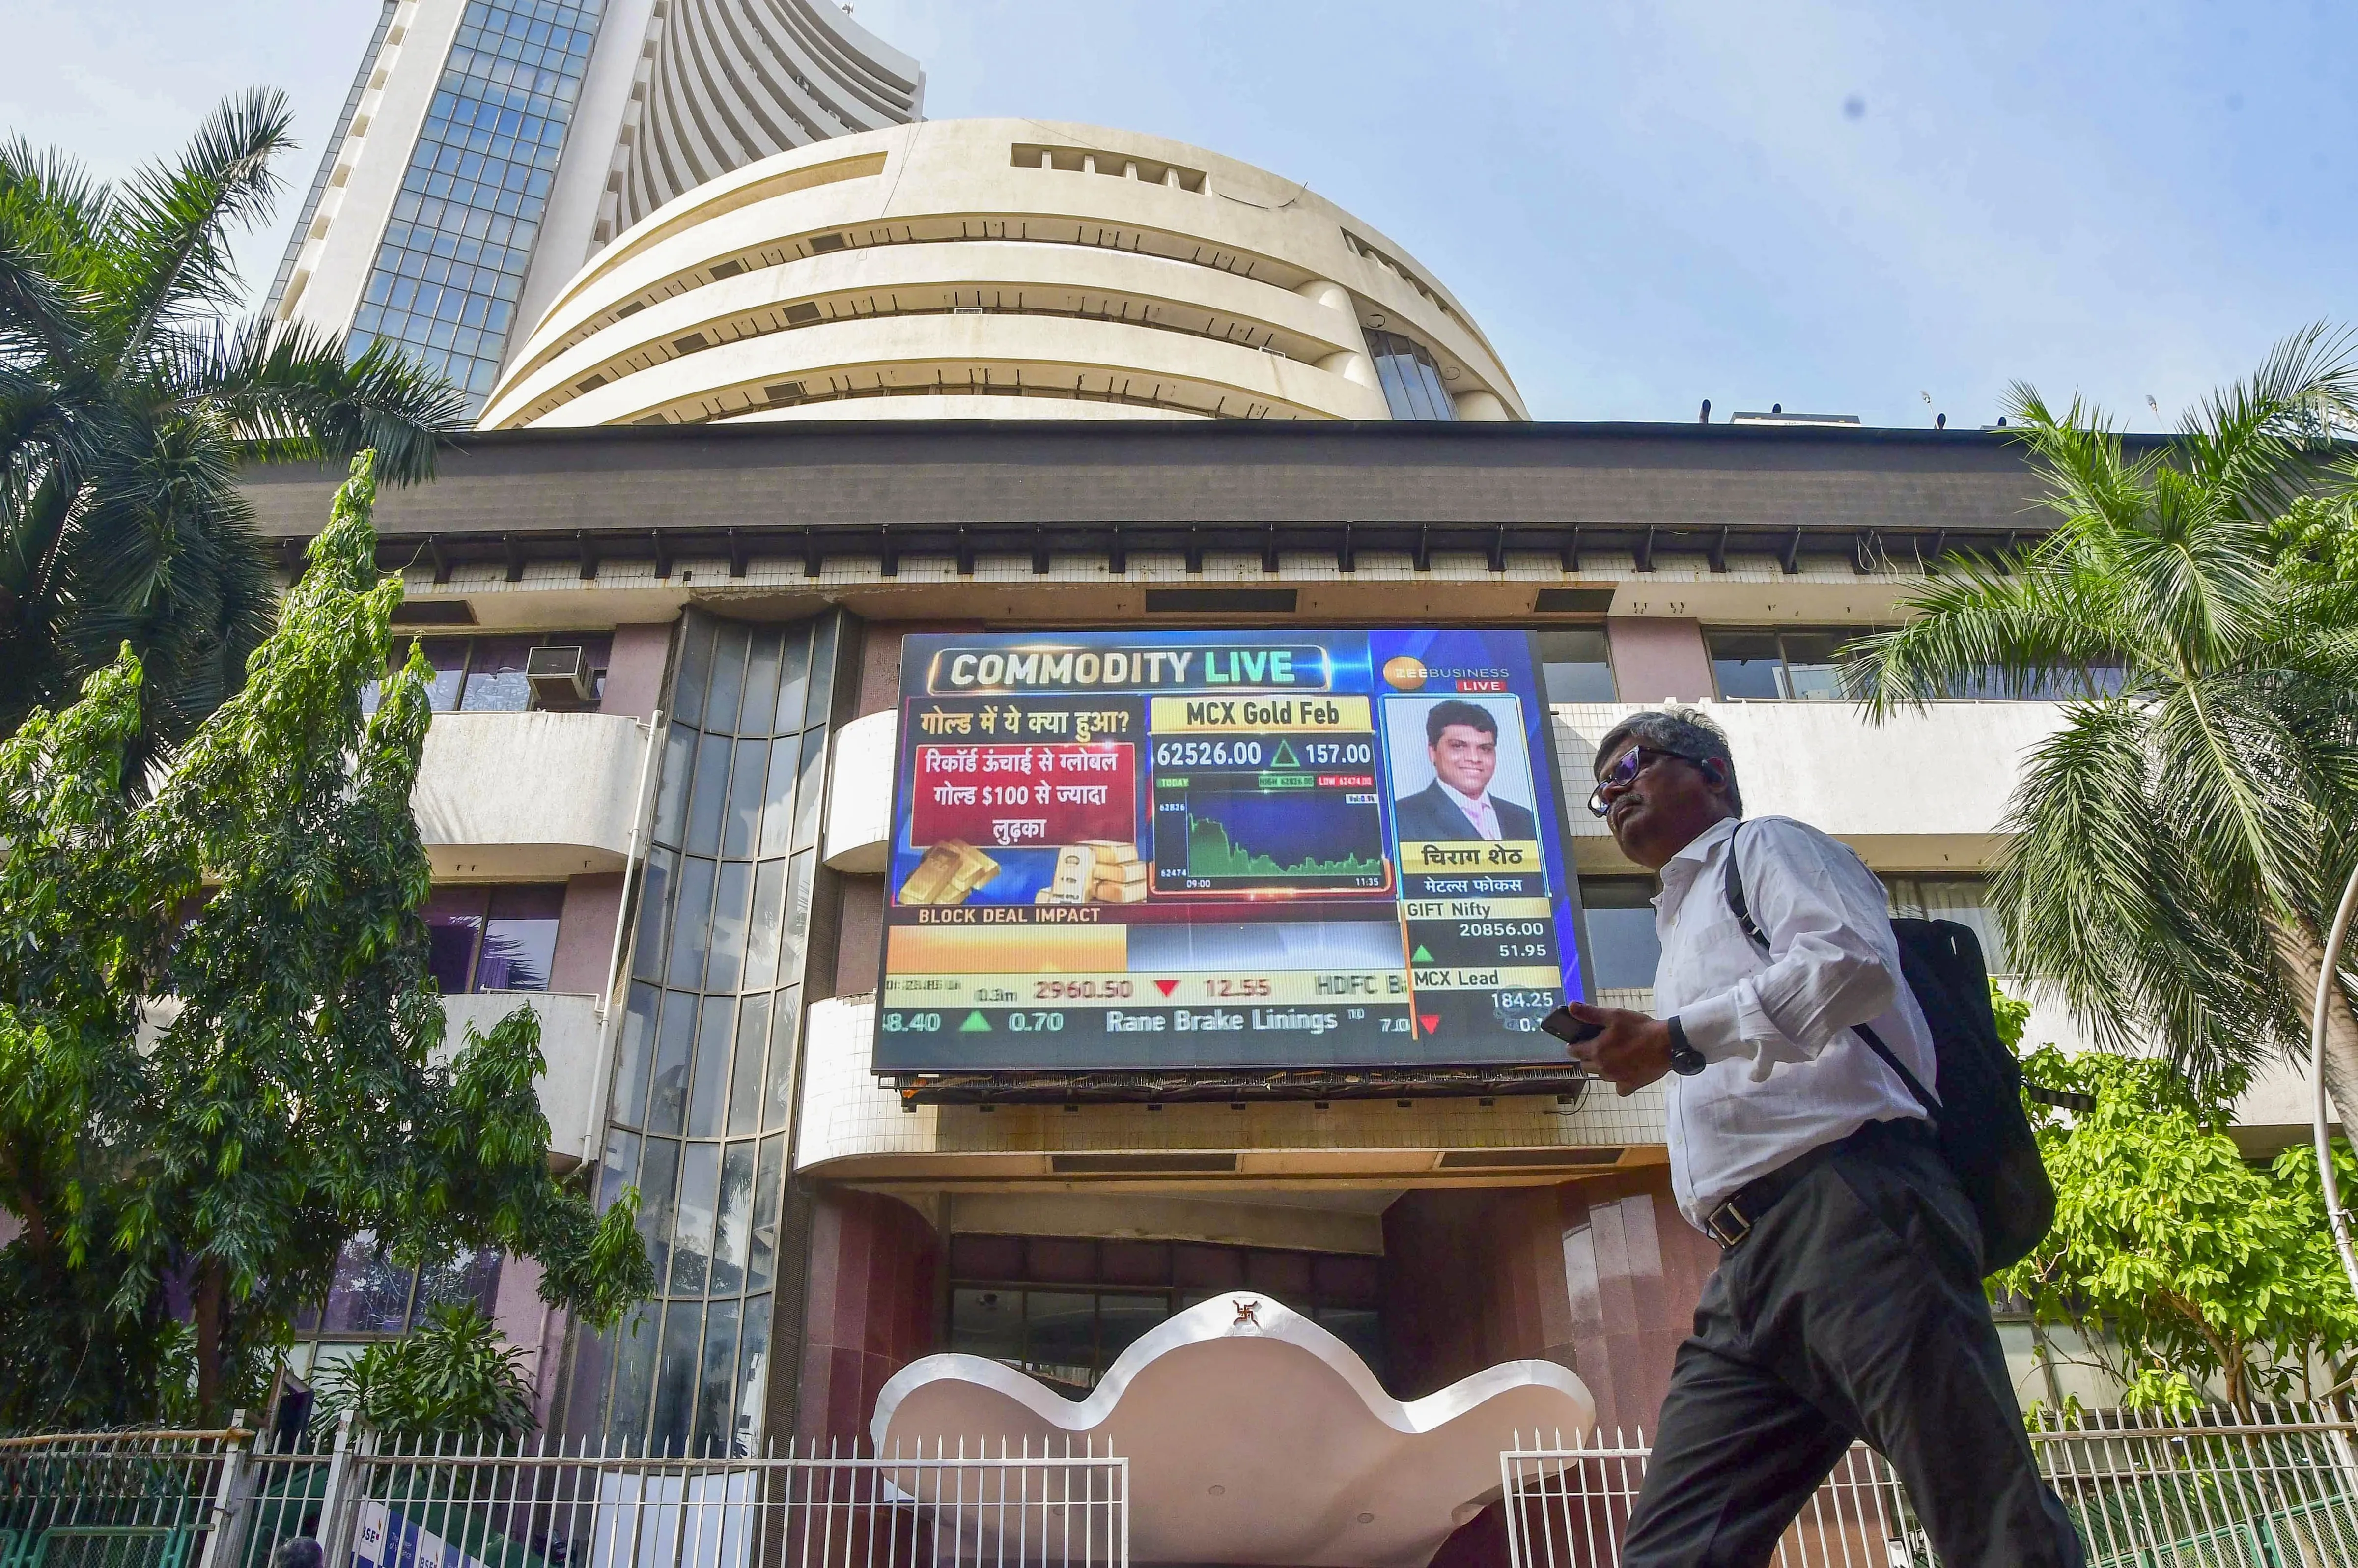
The NIFTY50 index extended its losses for the eighth session in a row and ended the Friday’s session to an eighth-month low. | Image: PTI
Asian markets @ 7 am
- GIFT NIFTY: 22,363 (+0.42%)
- Nikkei 225: 37,536 (+1.03%)
- Hang Seng: 23,155 (+0.93%)
U.S. market update
- Dow Jones: 43,840 (▲1.3%)
- S&P 500: 5,945 (▲1.5%)
- Nasdaq Composite: 18,847 (▲1.6%)
U.S. markets closed higher on Friday, recovering from early losses after the Federal Reserve’s preferred inflation gauge, the Personal Consumption Expenditures (PCE) index, eased to 2.6% in January. The reading met market expectations, reinforcing hopes of a continued downward inflation trend and boosting investor sentiment.
However, the optimism was briefly overshadowed by geopolitical tensions. Former President Donald Trump and Vice President JD Vance reportedly clashed with Ukrainian President Volodymyr Zelenskyy during an Oval Office meeting. Zelenskyy left the White House without signing a key mineral rights deal, which was seen as a potential step toward a ceasefire with Russia.
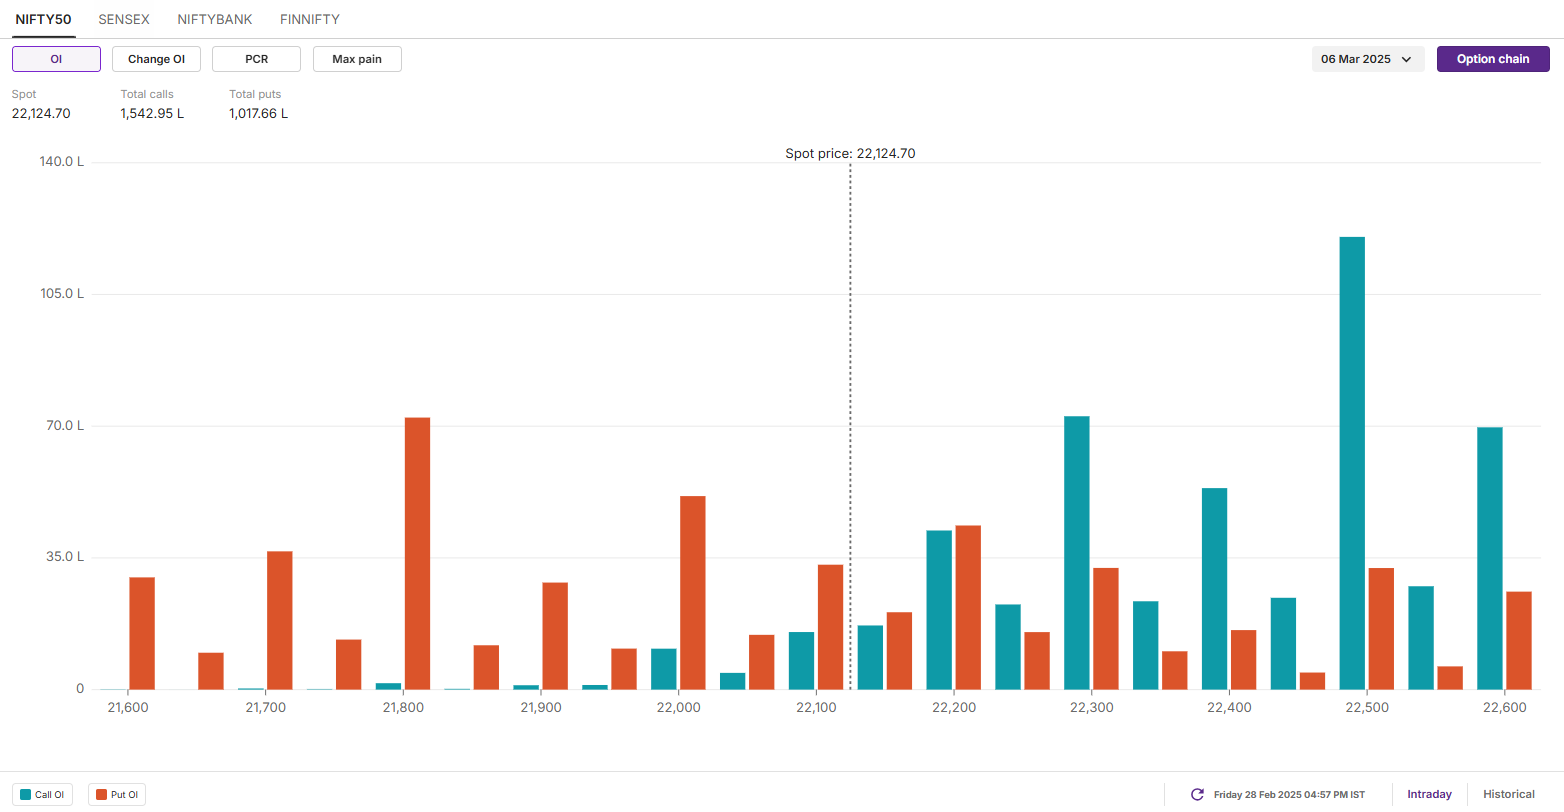
NIFTY50
- Max call OI: 22,500
- Max put OI: 21,800
- (10 Strikes from ATM, Expiry: 6 March)
The NIFTY50 index extended its losses for the eighth session in a row and ended the Friday’s session to an eighth-month low. The index slipped below the crucial support zone of 22,500 amid fresh tariff threats from the U.S. President Donald Trump.
The technical structure of the NIFTY50 index remains weak as per the daily chart with immediate resistance around the 22,800. Meanwhile, the next crucial support for the index is around the 21,800 zone. If the index breaks below this support zone, it may further extend the weakness.
The open interest (OI) data for the 6 March expiry saw significant call OI build-up at 22,500 strike, indicating resistance for the index around this zone. On the flip side, the put base was observed at 21,800 strike, suggesting support for the index around this level.
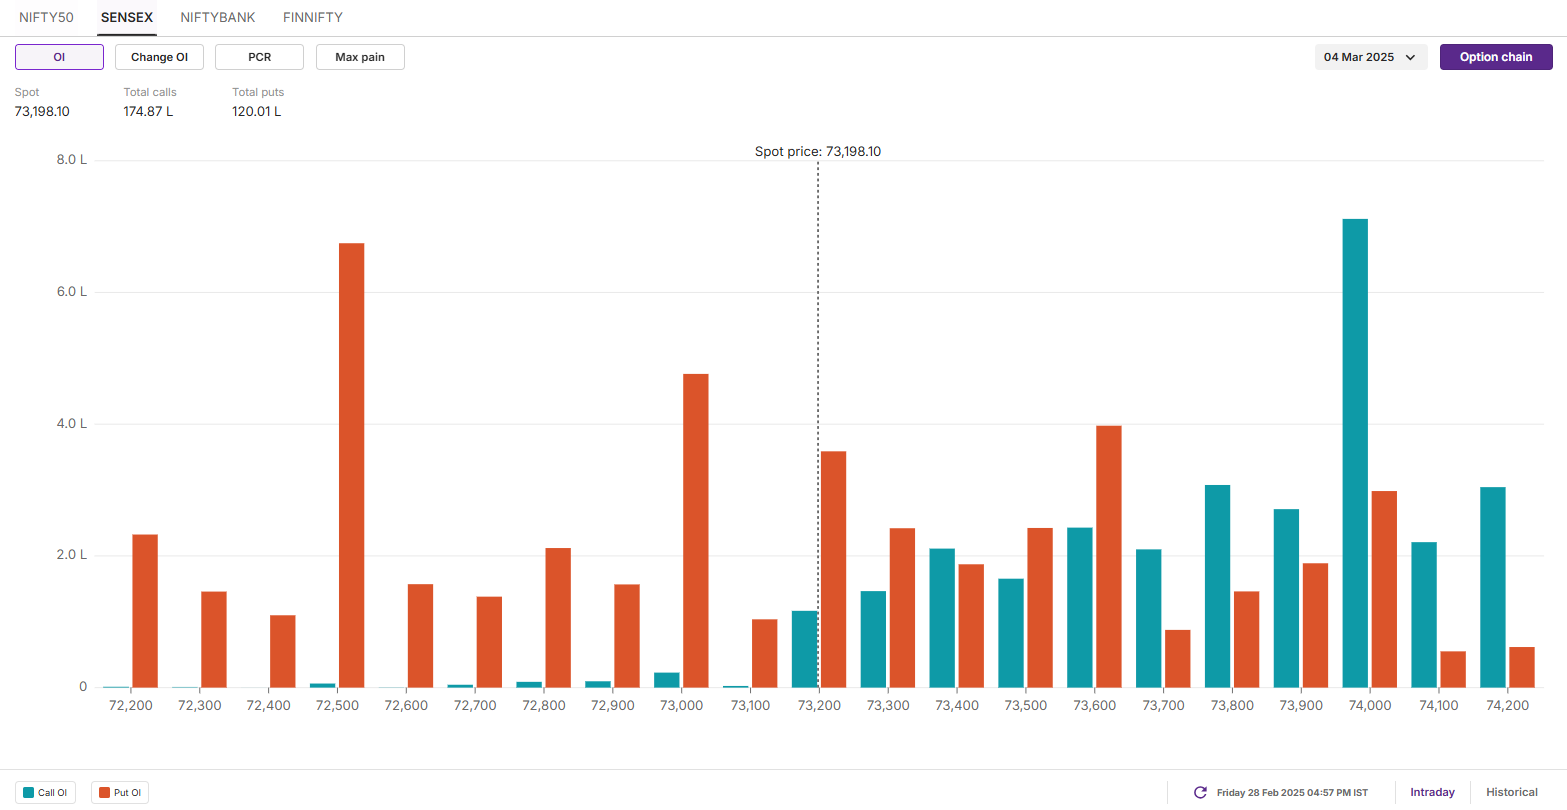
SENSEX
- Max call OI: 74,000
- Max put OI: 72,500
- (10 Strikes from ATM, Expiry: 4 March)
The SENSEX also extended the losing streak for the eighth day in a row and formed a bearish candle on the daily chart. It surrendered the crucial support zone of 74,000 zone on closing basis, signaling continued weakness.
As per the daily chart, the technical structure of the index remains weak with immediate resistance of the index around the 75,000 zone. On the flip side, the next crucial support for the index is around 72,000 zones.
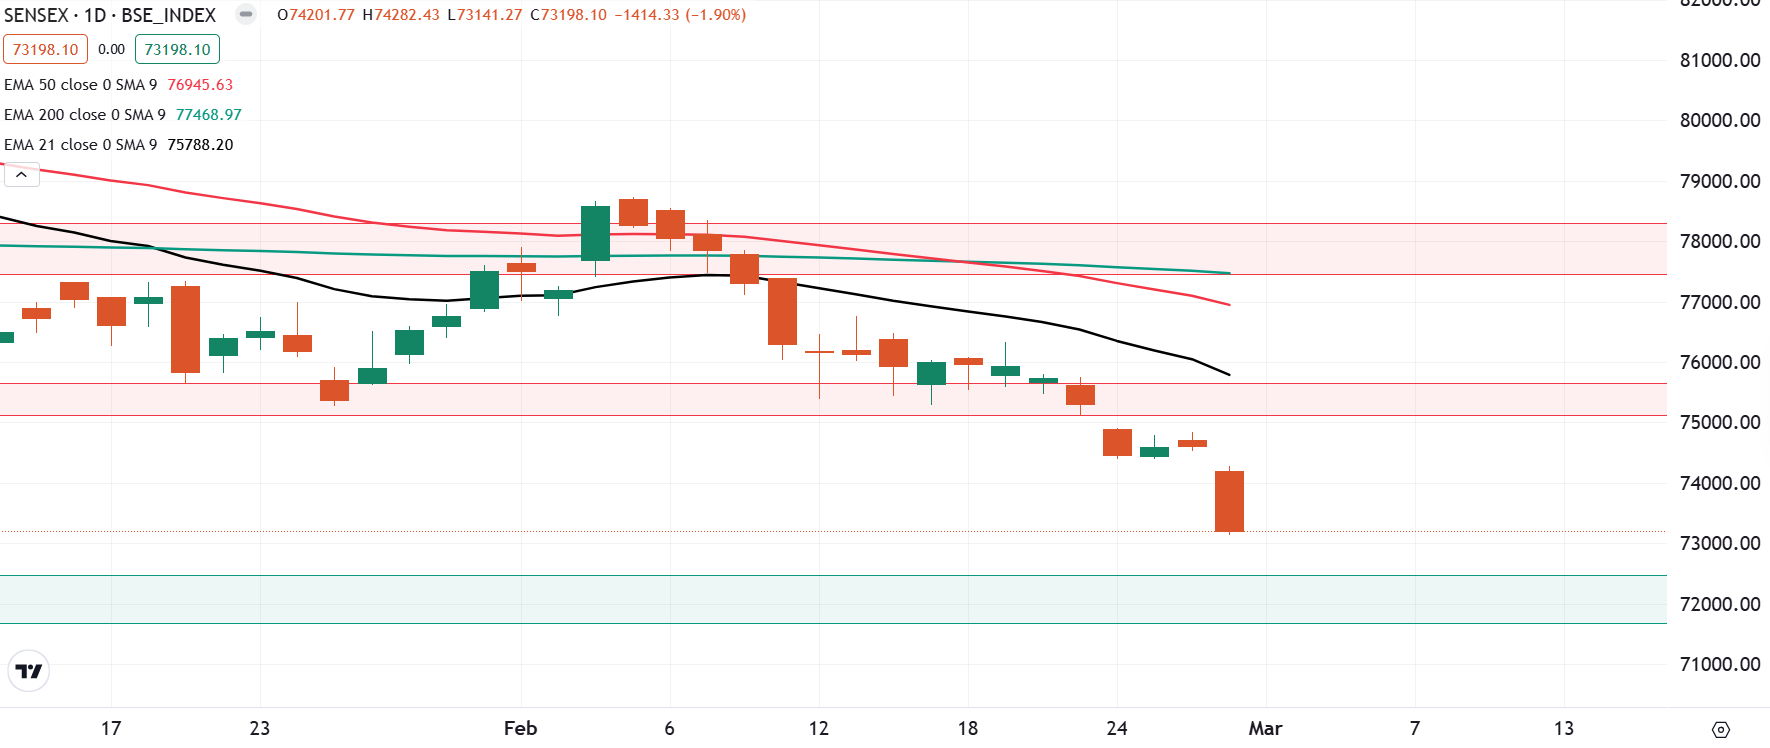
The open interest (OI) data for the 4 March expiry saw significant call OI base at 74,000 strike, indicating resistance for the index around this zone. Conversely, the put base of the index was seen at 72,500 strike, suggesting support for the index around this zone.
FII-DII activity
Stock scanner
- Long build-up: Phoenix
- Short build-up: IndusInd Bank, Tech Mahindra, Jio Financials, Adani Green and Bharti Airtel
- Top traded futures contracts: HDFC Bank, IndusInd Bank, ICICI Bank, Reliance Industries and BSE
- Top traded options contracts: BSE 4500 PE, Polycab 4800 CE, HDFC Bank 1700 CE, Reliance 1200 CE and TCS 3500 PE
- Under F&O ban: N/A
In Futures and Options or F&O, long build-up means an increase in Open Interest (OI) along with an increase in price, and short build-up means an increase in Open Interest(OI) along with a decrease in price. Source: Upstox and NSE.
Disclaimer: Derivatives trading must be done only by traders who fully understand the risks associated with them and strictly apply risk mechanisms like stop-losses. The information is only for consumption by the client and such material should not be redistributed. We do not recommend any particular stock, securities and strategies for trading. The securities quoted are exemplary and are not recommendatory. The stock names mentioned in this article are purely for showing how to do analysis. Take your own decision before investing.
About The Author
Next Story