Market News
Trade setup for March 21: NIFTY50 bounces back above 50-EMA, resistance looms at 200-EMA
.png)
4 min read | Updated on March 21, 2025, 07:21 IST


SUMMARY
The NIFTY50 maintained its bullish momentum, reclaiming the 50-day exponential moving average after 29 sessions. Meanwhile, the volatility index fell over 5% to 12.6, its lowest level since October 2024.
Stock list
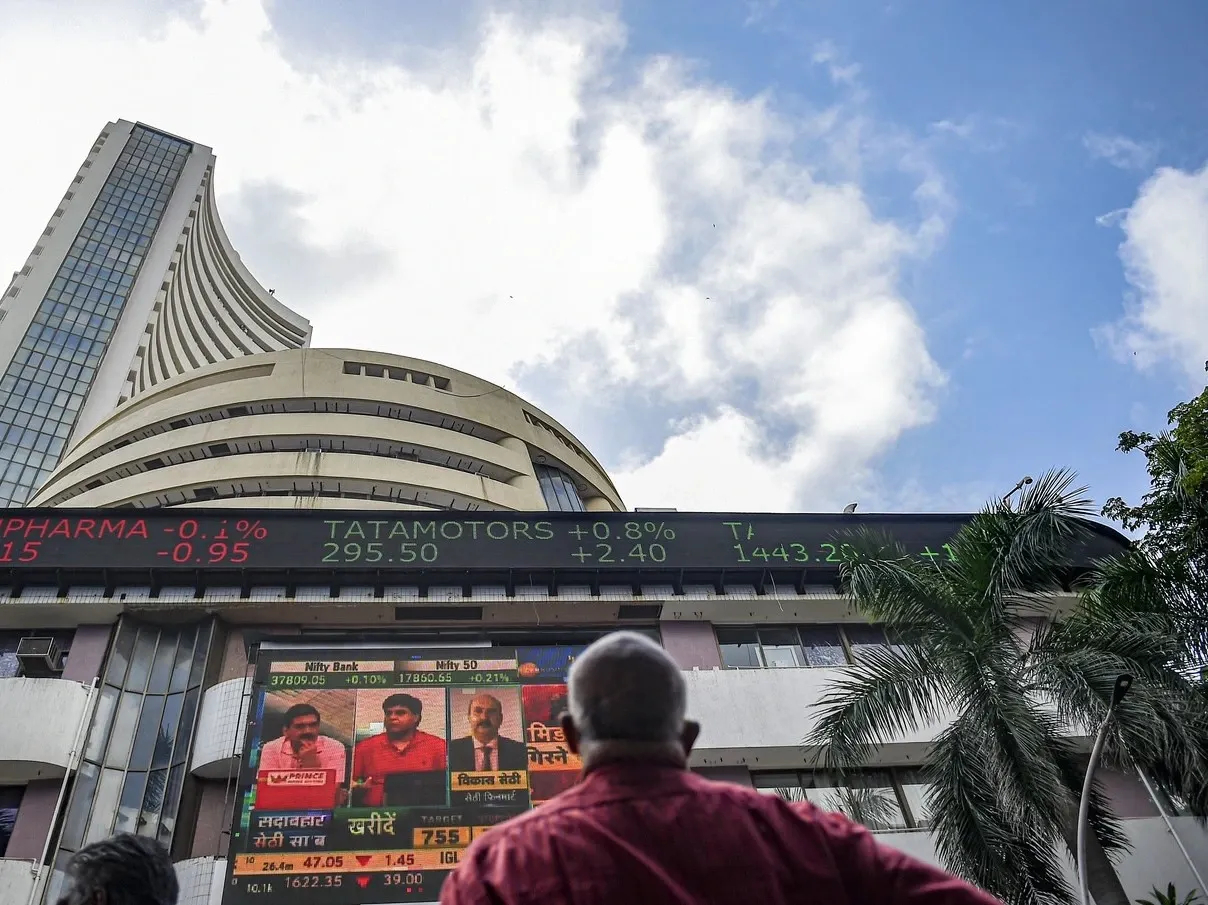
The NIFTY50 index started the Thursday’s session on a positive note and extended the bullish momentum for the fourth session in a row. | Image: PTI
Asian markets @ 7 am
- GIFT NIFTY: 23,211 (+0.18%)
- Nikkei 225: 37,948 (+0.52%)
- Hang Seng: 24,033 (-0.77%)
U.S. market update
- Dow Jones: 41,953 (▼0.0%)
- S&P 500: 5,662 (▼0.2%)
- Nasdaq Composite: 17,691 (▼0.3%)
U.S. indices slipped on Thursday, failing to sustain the momentum from Wednesday’s rally after the central bank held interest rates steady. Meanwhile, the Fed chair Jerome Powell pointed to tariffs as a source of concern, which could put pressure on the economy. The central bank also raised its inflation outlook and lowered the economic projections
NIFTY50
- Max call OI: 23,500
- Max put OI: 23,000
- (10 Strikes from ATM, Expiry: 27March)
The NIFTY50 index started the Thursday’s session on a positive note and extended the bullish momentum for the fourth session in a row. Amid broad based buying across sectors the index reclaimed its 50-day exponential moving average after 29 trading sessions, forming a bullish candle on the daily chart.
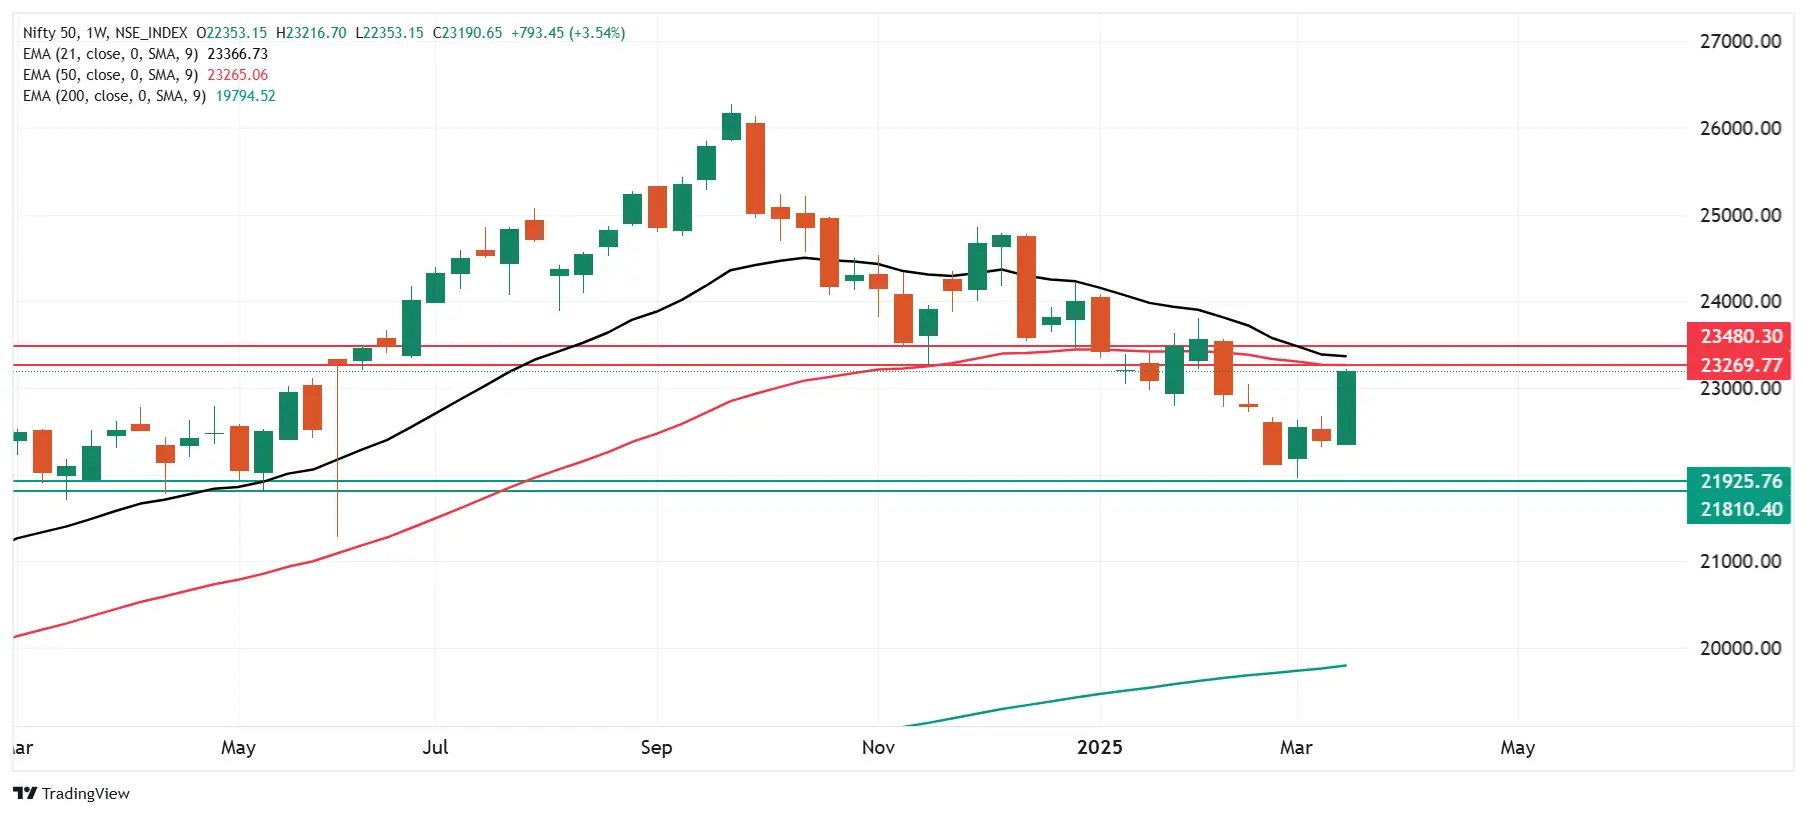
The weekly chart of the index is currently indicating formation of a bullish candle, hinting a close above the high of the previous four weeks. A close above four weeks high will signal continuation of bullish momentume. On the other hand, the crucial support for the index remains around 21,800 zone.
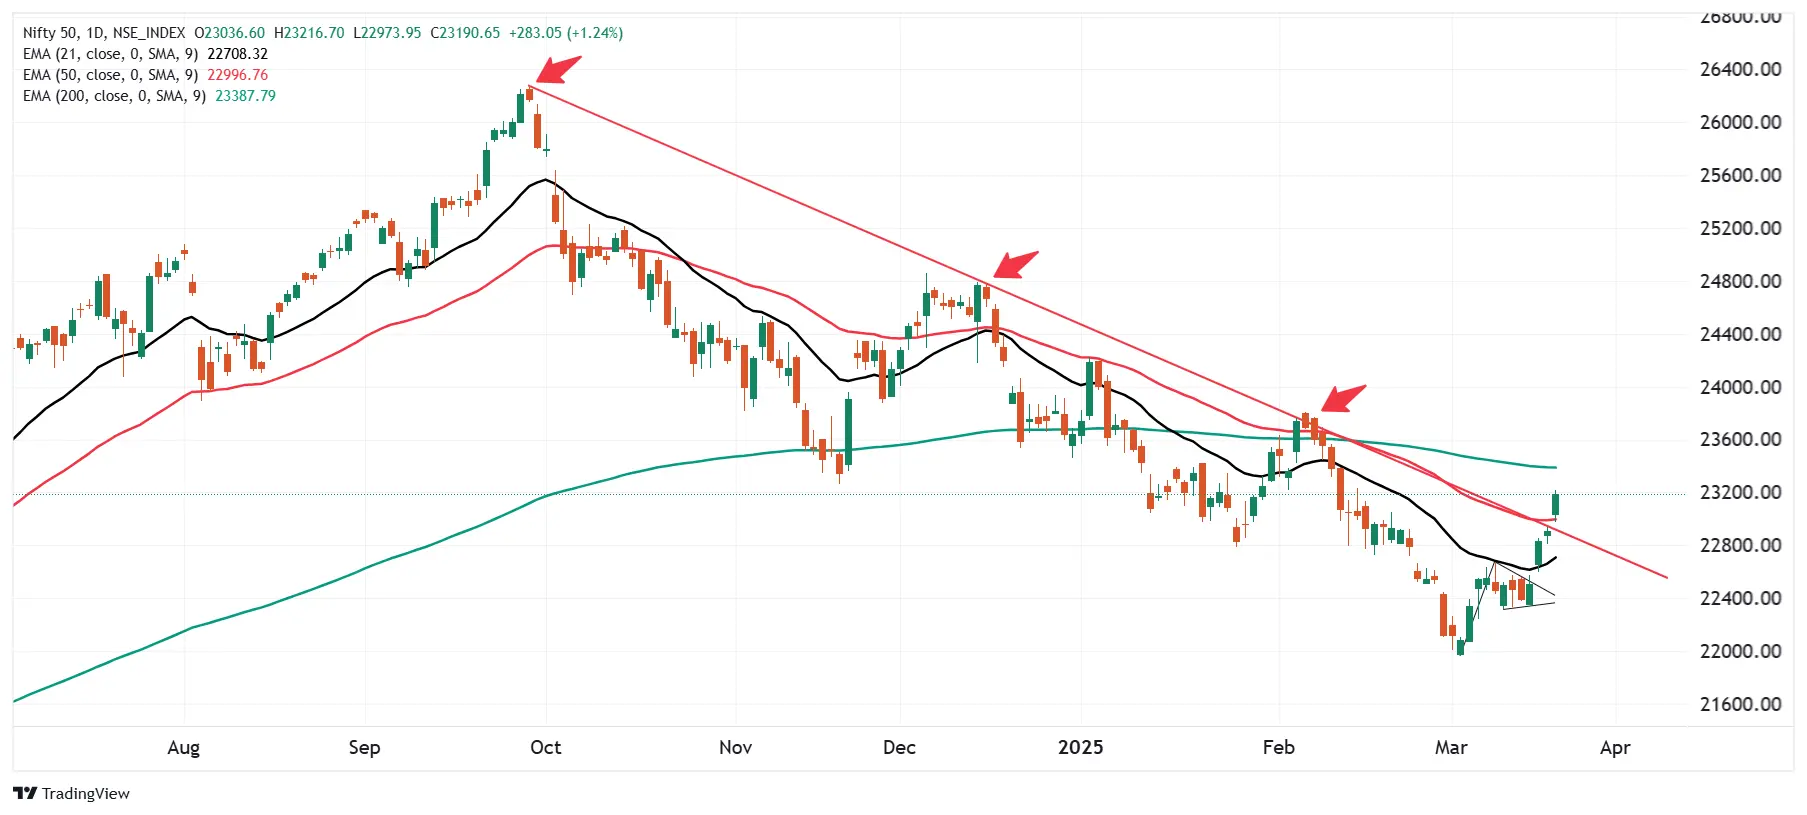
The technical structure of the index as per the daily chart remained bullish as it reclaimed the crucial 50-day EMA and the downward sloping trendline as shown on the chart below. This indicates that the index may extend its ongoing momentum up to 200-day EMA. Meanwhile, the immediate support for the index is around 21- EMA (around 22,700).
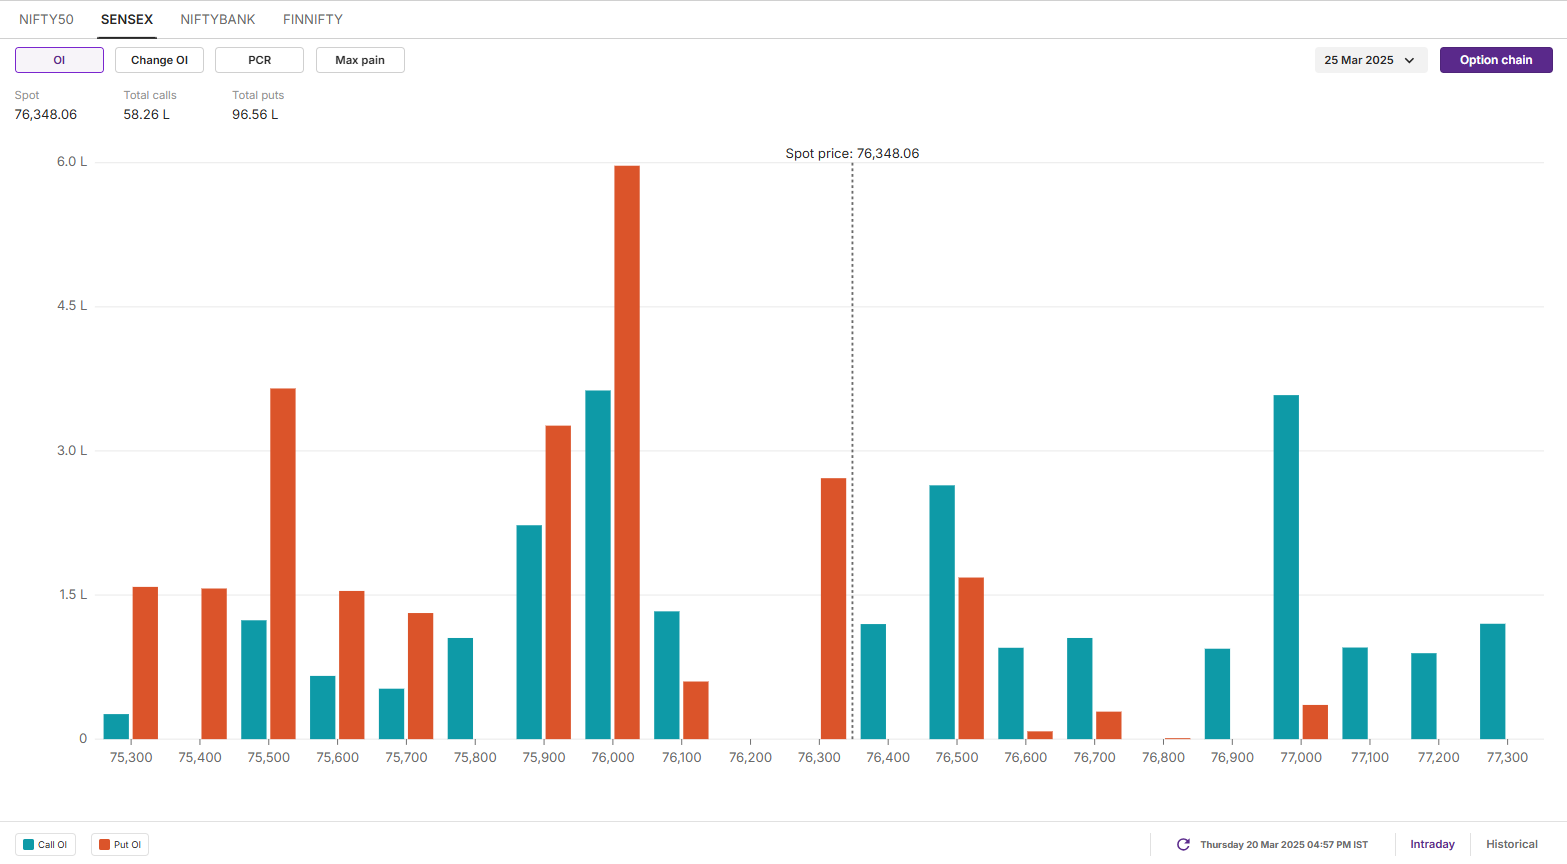
SENSEX
- Max call OI: 77,000
- Max put OI: 76,000
- (10 Strikes from ATM, Expiry: 25 March)
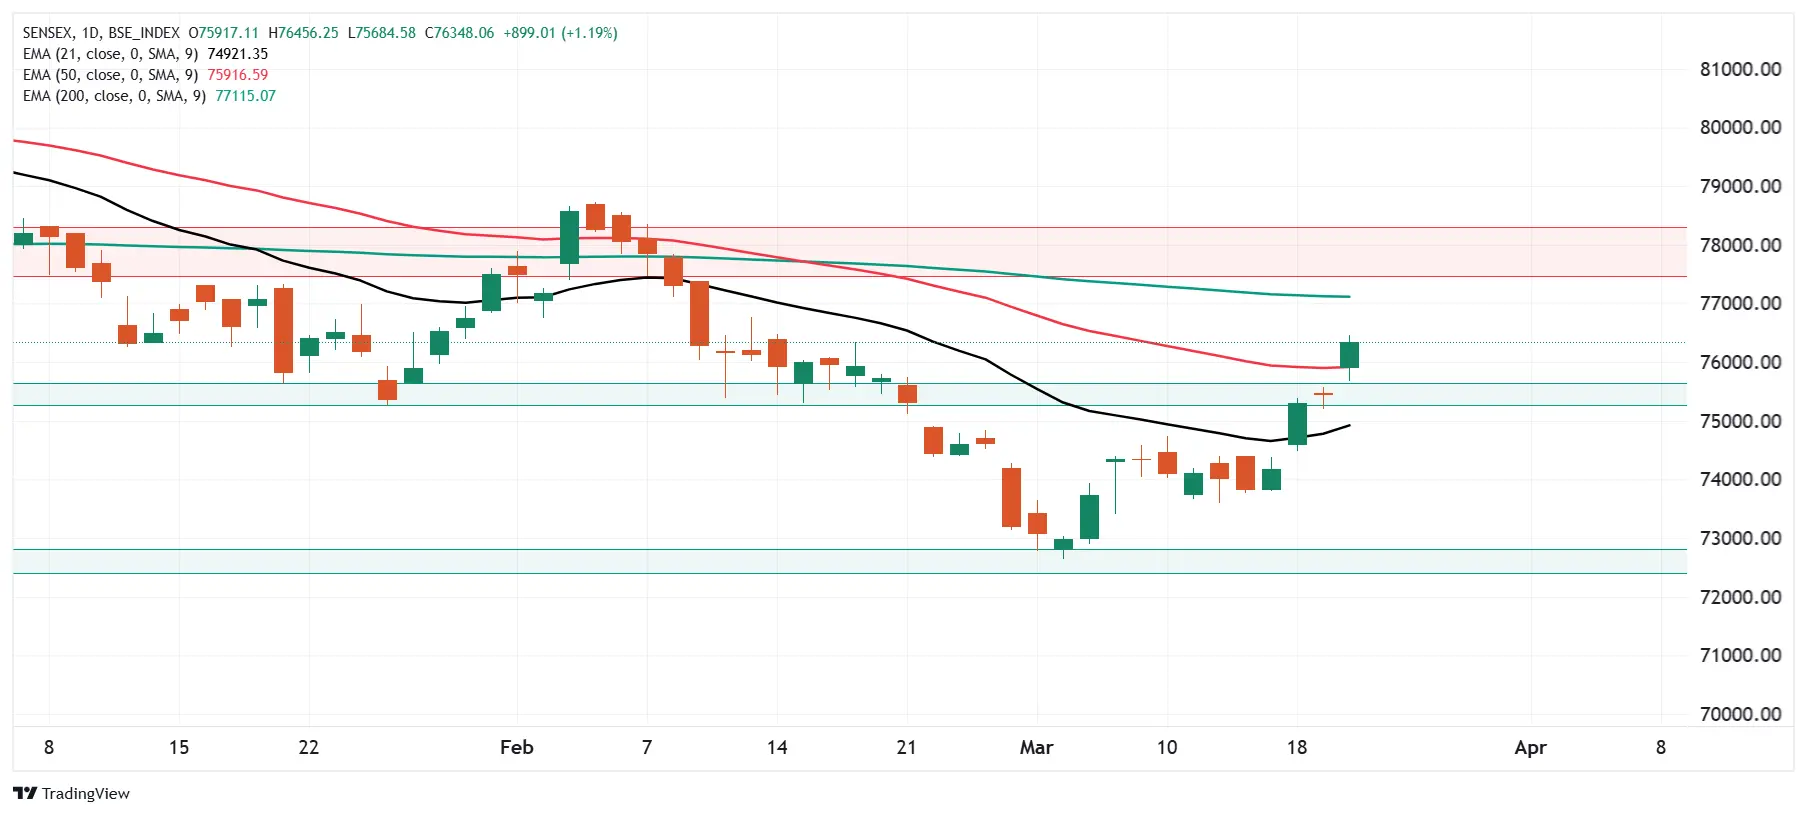
The SENSEX extended its bullish momentum for the fourth straight session, reclaiming the 50-day EMA and key resistance at 75,600 on the daily chart. Traders should watch its price action around the 200-day EMA in the coming sessions. A decisive close above this level could fuel further gains. On the downside, immediate support now lies near 75,600.
The open interest (OI) data for the March 25 expiry saw significant put OI base at 76,000 strike, suggesting support for the index around this zone. Conversely, the call options base was observed at 77,000 strike, indicating resistance for the index around this level.
FII-DII activity
Stock scanner
- Long build-up: NCC, Manappuram Finance, Bharat Forge and Phoenix
- Short build-up: KEI Industries, Polycab, Havells India and Computer Age Management Services
- Top traded futures contracts: Reliance Industries, HDFC Bank, Polycab, ICICI Bank and Infosys
- Top traded options contracts: Polycab 5,000 PE, BSE 4,500 CE, HAL 3,800 CE, Bharti Aitel 1,700 CE and Reliance 1,260 CE
- Under F&O ban: Hindustan Copper, IndusInd Bank, Manappuram Finance, Polycab and Steel Authority of India
- Out of F&O ban: Manappuram Finance and Polycab
In Futures and Options or F&O, long build-up means an increase in Open Interest (OI) along with an increase in price, and short build-up means an increase in Open Interest(OI) along with a decrease in price. Source: Upstox and NSE.
Disclaimer: Derivatives trading must be done only by traders who fully understand the risks associated with them and strictly apply risk mechanisms like stop-losses. The information is only for consumption by the client and such material should not be redistributed. We do not recommend any particular stock, securities and strategies for trading. The securities quoted are exemplary and are not recommendatory. The stock names mentioned in this article are purely for showing how to do analysis. Take your own decision before investing.
About The Author
Next Story


