Market News
Trade setup for March 19: NIFTY50 rebounds above 21-EMA after 24 sessions, targets 23,000
.png)
4 min read | Updated on March 19, 2025, 07:20 IST


SUMMARY
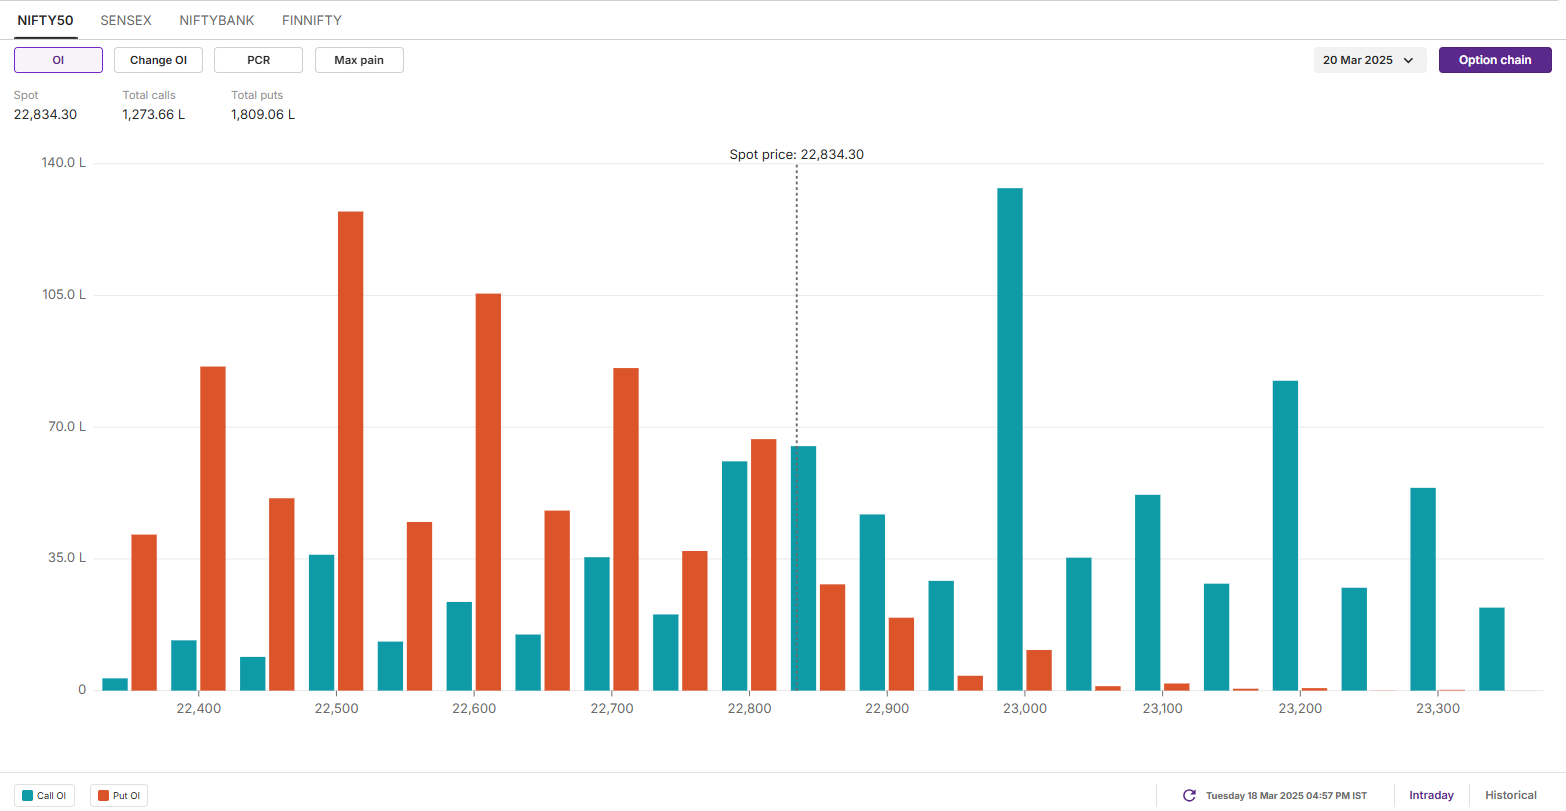
Weekly options data for the NIFTY50 index showed a strong call build-up at the 23,000 strike, signaling resistance in this zone. Meanwhile, the put base at the 22,500 strike indicates support around this level.
Stock list

NIFTY50's short-term technical structure turned bullish on the daily chart. | Image: Shutterstock
Asian markets @ 7 am
- GIFT NIFTY: 22,962 (+0.29%)
- Nikkei 225: 38,083 (+0.63%)
- Hang Seng: 24,697 (-0.17%)
U.S. market update
- Dow Jones: 41,581 (▼0.6%)
- S&P 500: 5,614 (▼1.0%)
- Nasdaq Composite: 17,504 (▼1.7%)
U.S. indices resumed the sell-off and snapped two-days winning momentum ahead of the U.S. Federal Reserve’s two-day meeting. The Fed officials are expected to hold the interest rates between 4.25%-4.5%. Meanwhile, shares of Tesla fell more than 5% after Chinese electric vehicle maker BYD unveiled an ultra-fast charger it claims can deliver a full charge in as little as five minutes.
NIFTY50
- Max call OI: 23,000
- Max put OI: 22,500
- (10 Strikes from ATM, Expiry: 20 March)
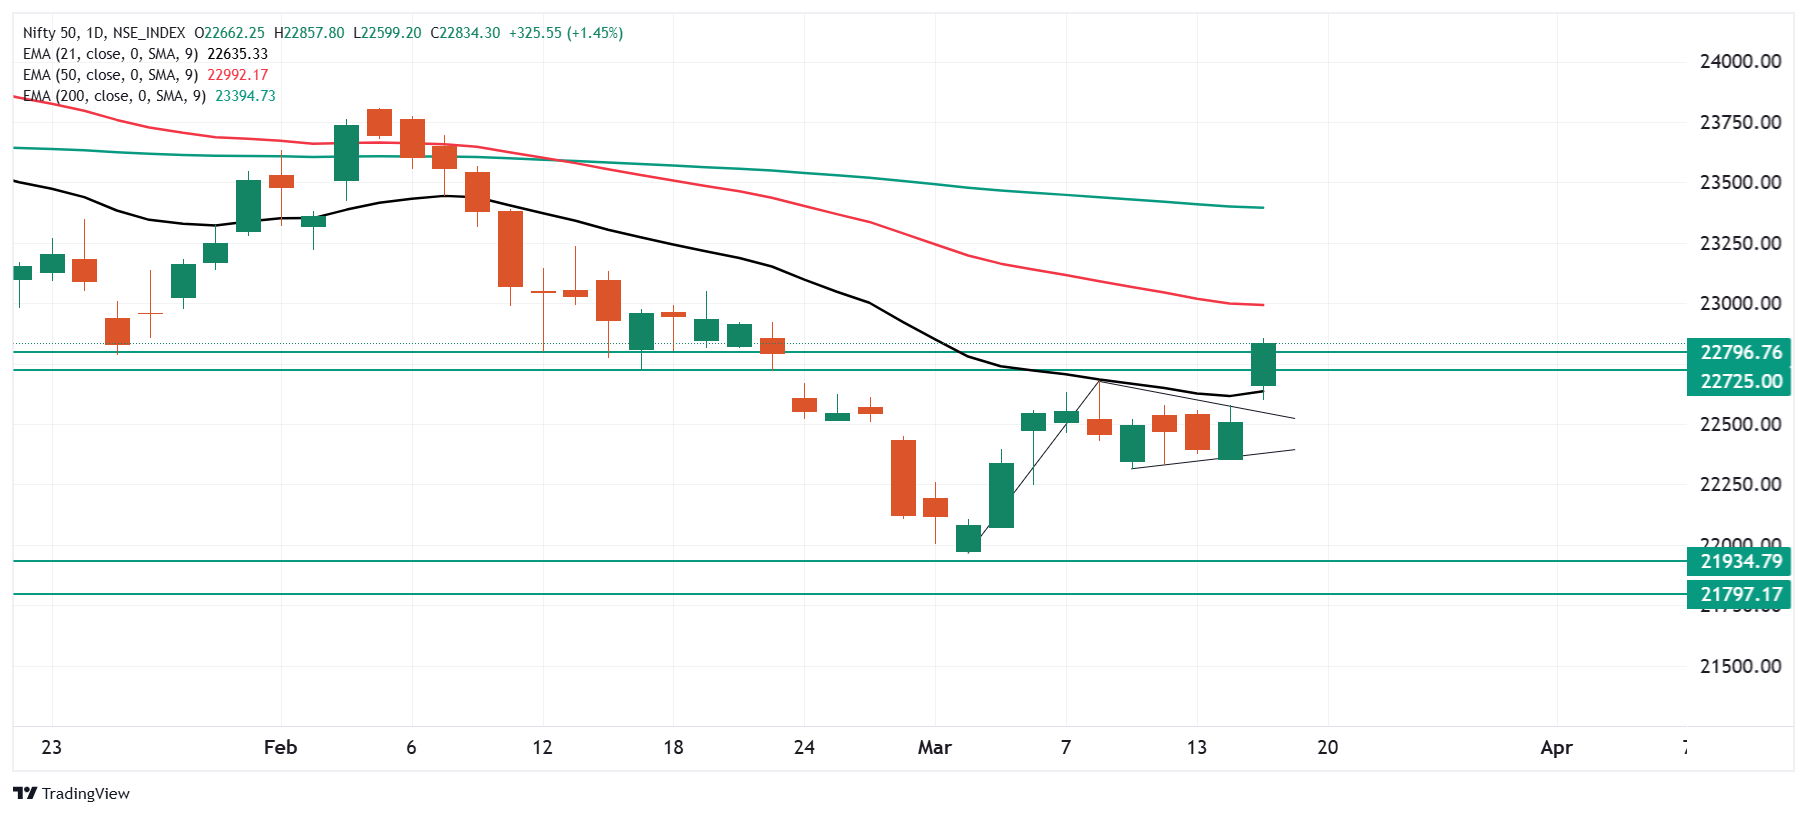
The NIFTY50 index started the day on a positive note and broke the five-day consolidation. The index formed a bullish candle on the daily chart, reclaiming its 21-day exponential moving average after twenty four trading sessions. The sharp recovery was led by buying across major sectors and positive global cues.
The index's short-term technical structure turned bullish on the daily chart after reclaiming the immediate resistance zone of 22,700–22,800. As long as the index holds this zone on a closing basis, the bullish trend may continue, potentially extending gains toward the 23,000 zone.
The open interest data for the March 20th expiry saw significant call options base at 23,000 strike, indicating resistance for the index around this zone. On the flip side, the put options base was observed at 22,500 strike, suggesting support for the index around this level.
SENSEX
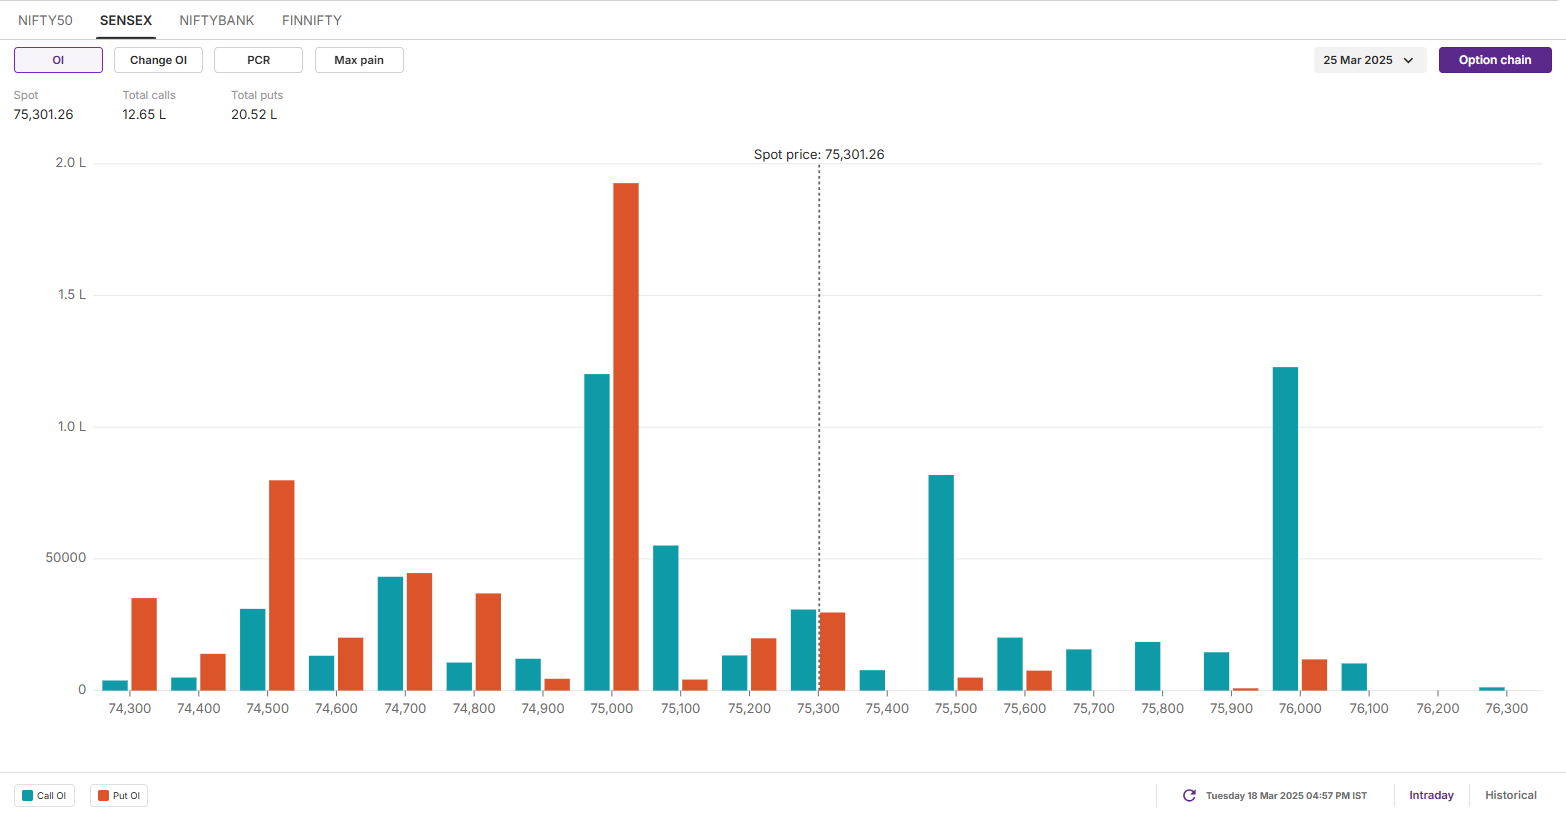
- Max call OI: 76,000
- Max put OI: 75,000
- (10 Strikes from ATM, Expiry: 25 March)
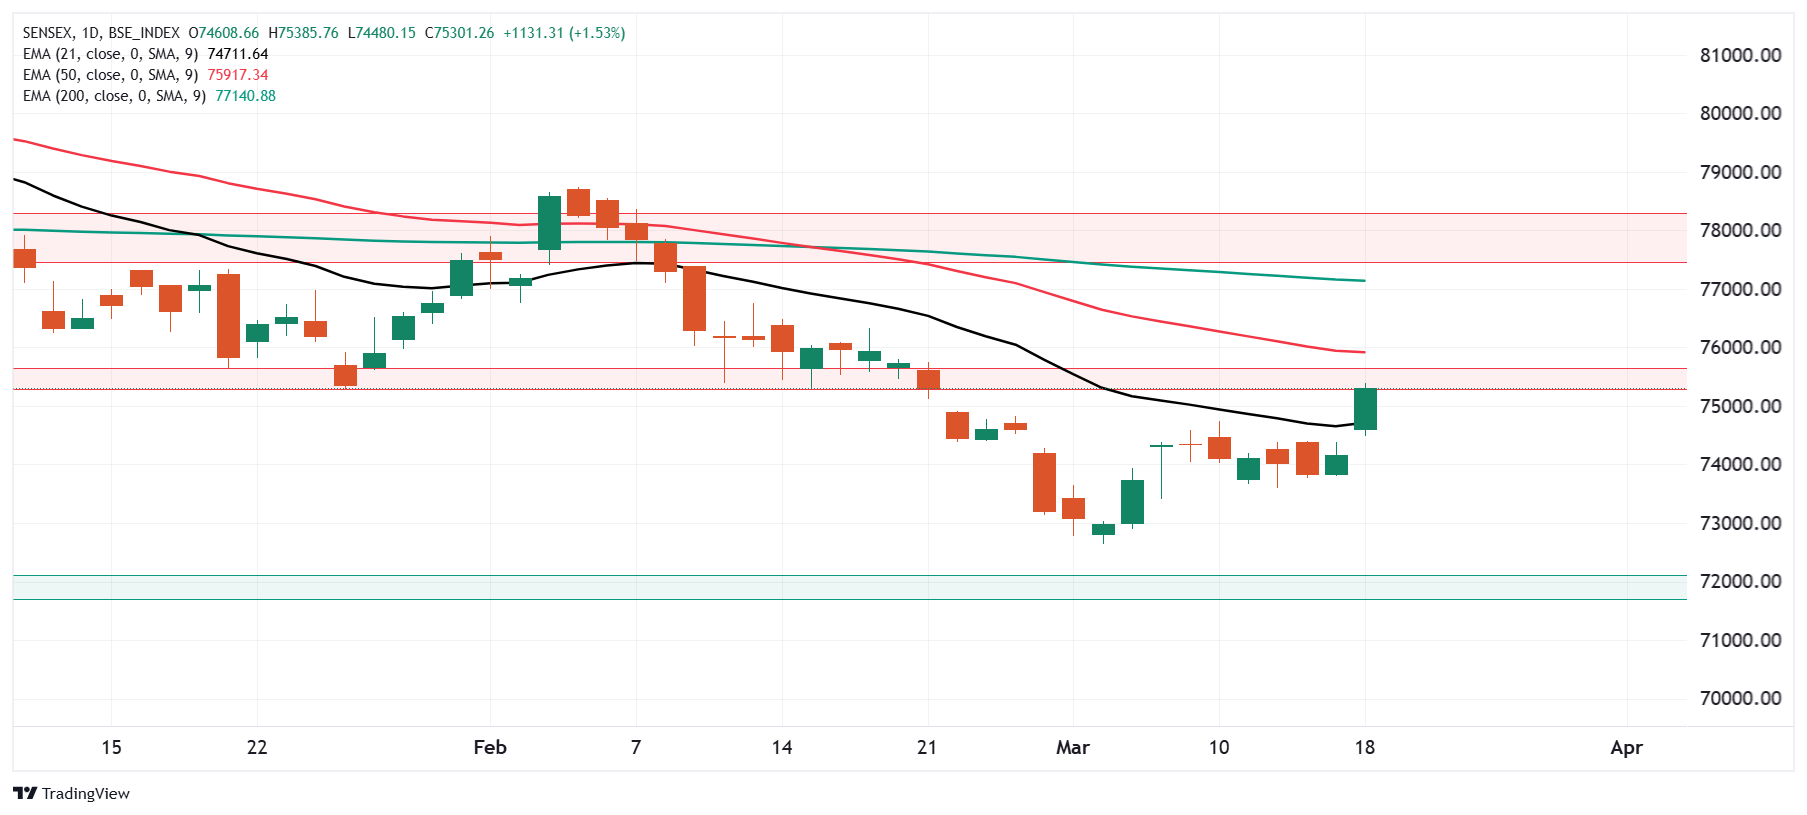
The SENSEX also extended the positive momentum for the second day in a row and reclaimed its 21-day EMA on the daily chart. The index formed a bullish candle on the daily chart and broke the consolidation zone of 74,700 and 73,600 on a closing basis.
From the technical standpoint, the index has reclaimed its 21-day EMA and is currently trading near the immediate resistance zone of 50-day EMA and 75,600 zone. A close above this zone on the daily chart, will signal bullish continuation and index can test its 200-day EMA. Meanwhile, the immediate support for the index is around the 74,400.
The open interest (OI) data for the March 25th expiry saw significant put OI base at 75,000 strike, pointing at support for the index around this zone. On the flip side, the call options base was observed at 76,000 strike, indicating resistance for the index around this level.
FII-DII activity
Stock scanner
- Long build-up: PB Fintech (Policy Baazar), Paytm (One 97 Communications), IREDA, IIFL and Poonawalla Fincorp
- Short build-up: Nil
- Top traded futures contracts: ICICI Bank, HDFC Bank, Reliance Industries, Kotak Mahindra Bank and Bajaj Finance
- Top traded options contracts: ICICI Bank 1,300 CE, Bajaj Finance 8,600 CE, Paytm 700 CE, HAL 3,500 CE and HDFC Bank 1,720 CE
- Under F&O ban: BSE, Hindustan Copper, IndusInd Bank, Manappuram Finance and Steel Authority of India
In Futures and Options or F&O, long build-up means an increase in Open Interest (OI) along with an increase in price, and short build-up means an increase in Open Interest(OI) along with a decrease in price.
Source: Upstox and NSE.
Disclaimer: Derivatives trading must be done only by traders who fully understand the risks associated with them and strictly apply risk mechanisms like stop-losses. The information is only for consumption by the client and such material should not be redistributed. We do not recommend any particular stock, securities and strategies for trading. The securities quoted are exemplary and are not recommendatory. The stock names mentioned in this article are purely for showing how to do analysis. Take your own decision before investing.
About The Author
Next Story


