Market News
Trade setup for March 11: NIFTY50 faces rejection from 21-EMA, forms shooting star pattern
.png)
4 min read | Updated on March 11, 2025, 07:19 IST


SUMMARY
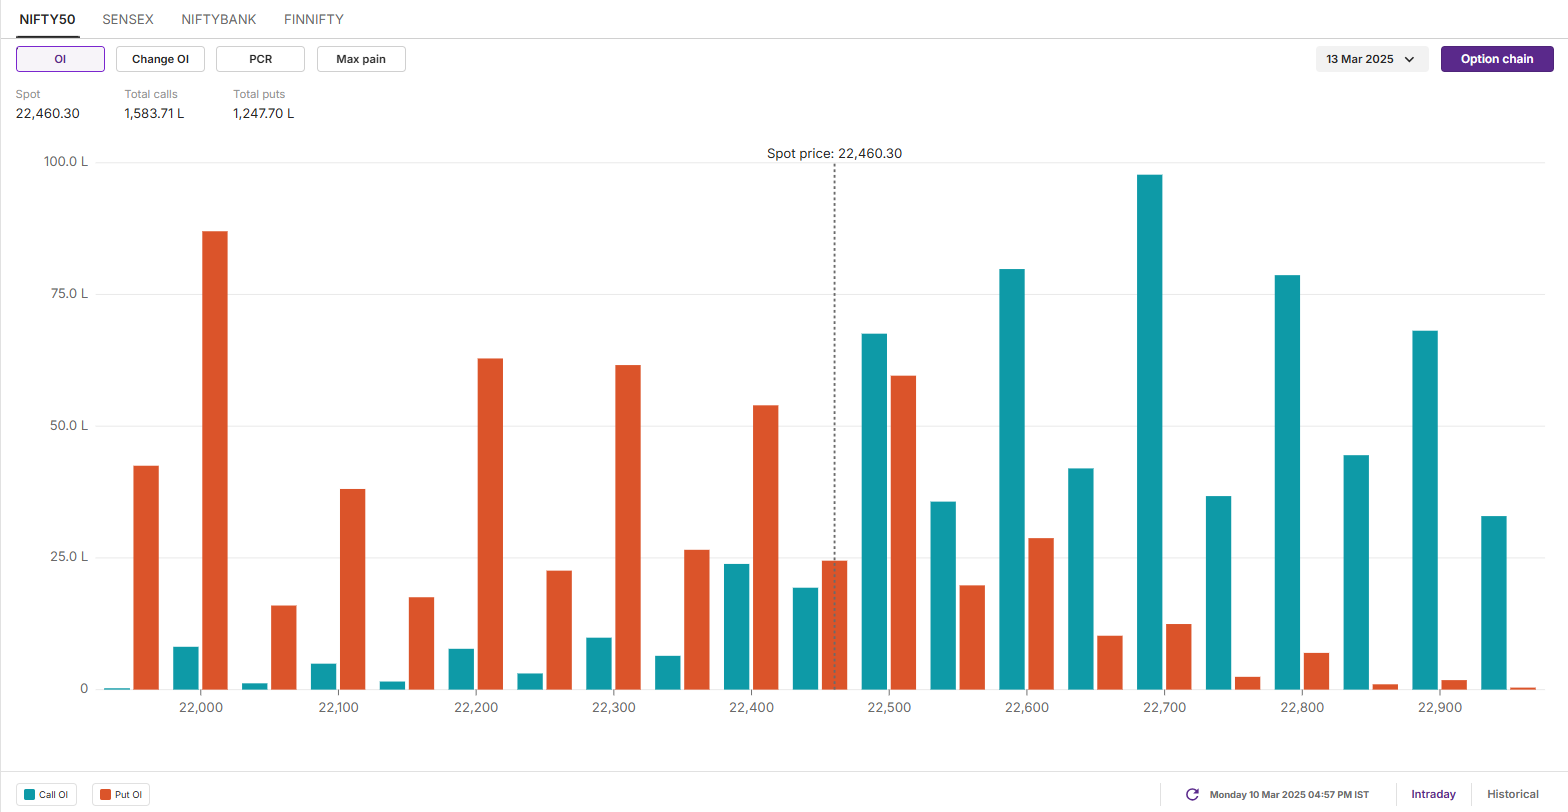
For the March 13 expiry, NIFTY 50’s weekly options data shows a significant call open interest buildup at the 22,800 strike. This level aligns with the 21-EMA, reinforcing it as an immediate resistance zone for the index.

The NIFTY50 index rebounded towards the 21-day exponential moving average (EMA) but failed to sustain its gains on a closing basis. | Image: Shutterstock
Asian markets @ 7 am
- GIFT NIFTY: 22,358 (-0.60%)
- Nikkei 225: 36,198 (-2.24%)
- Hang Seng: 23,274 (-2.19%)
U.S. market update
- Dow Jones: 41,911 (▼2.0%)
- S&P 500: 5,614 (▼2.7%)
- Nasdaq Composite: 17,468 (▼4.0%)
U.S. indices suffered their worst day of 2025 on Monday as investors remained worried about the tariff uncertainties, leading economy into recession. This comes after U.S. President Donald Trump said that economy was going through the transition, responding to the question of a possibility of a recession.
NIFTY50
- Max call OI: 22,700
- Max put OI: 22,000
- (10 Strikes from ATM, Expiry: 13 March)
The NIFTY50 index rebounded towards the 21-day exponential moving average (EMA) but failed to sustain its gains on a closing basis. The index faced rejection around the crucial rejection zone of 22,700-22,800, forming a shooting star candlestick pattern.
It is bearish reversal pattern that signals a potential reversal in an uptrend. It features a small red body and a long upper shadow, indicating that buyers pushed the price higher, but sellers took control before the close. However, the pattern gets confirmed if the close of the subsequent candle is below the reversal pattern.
On the daily chart, traders can monitor the price action of the index around the immediate support zone of 22,250 and 21,800. A close below these zones will indicate further weakness. Meanwhile, the immediate resistance for the index remains around 22,800 zone.
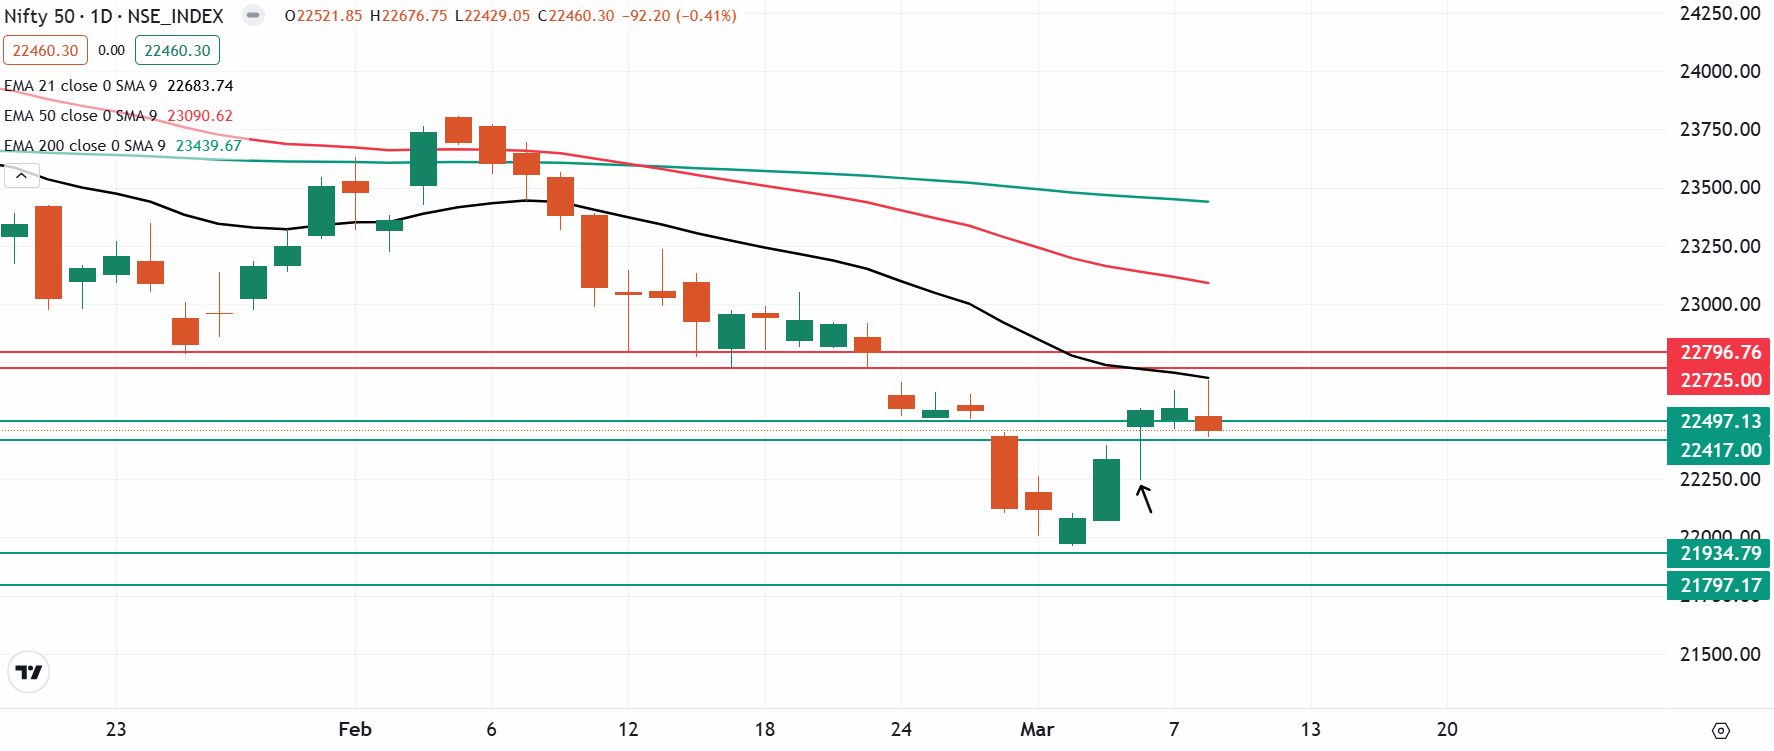
The open interest (OI) data for the March 13 expiry saw significant call OI build-up at 22,800 strike, suggesting resistance for the index around this zone. Conversely, the put OI base was seen at 22,000 strike, hinting support for the index around this zone.
SENSEX
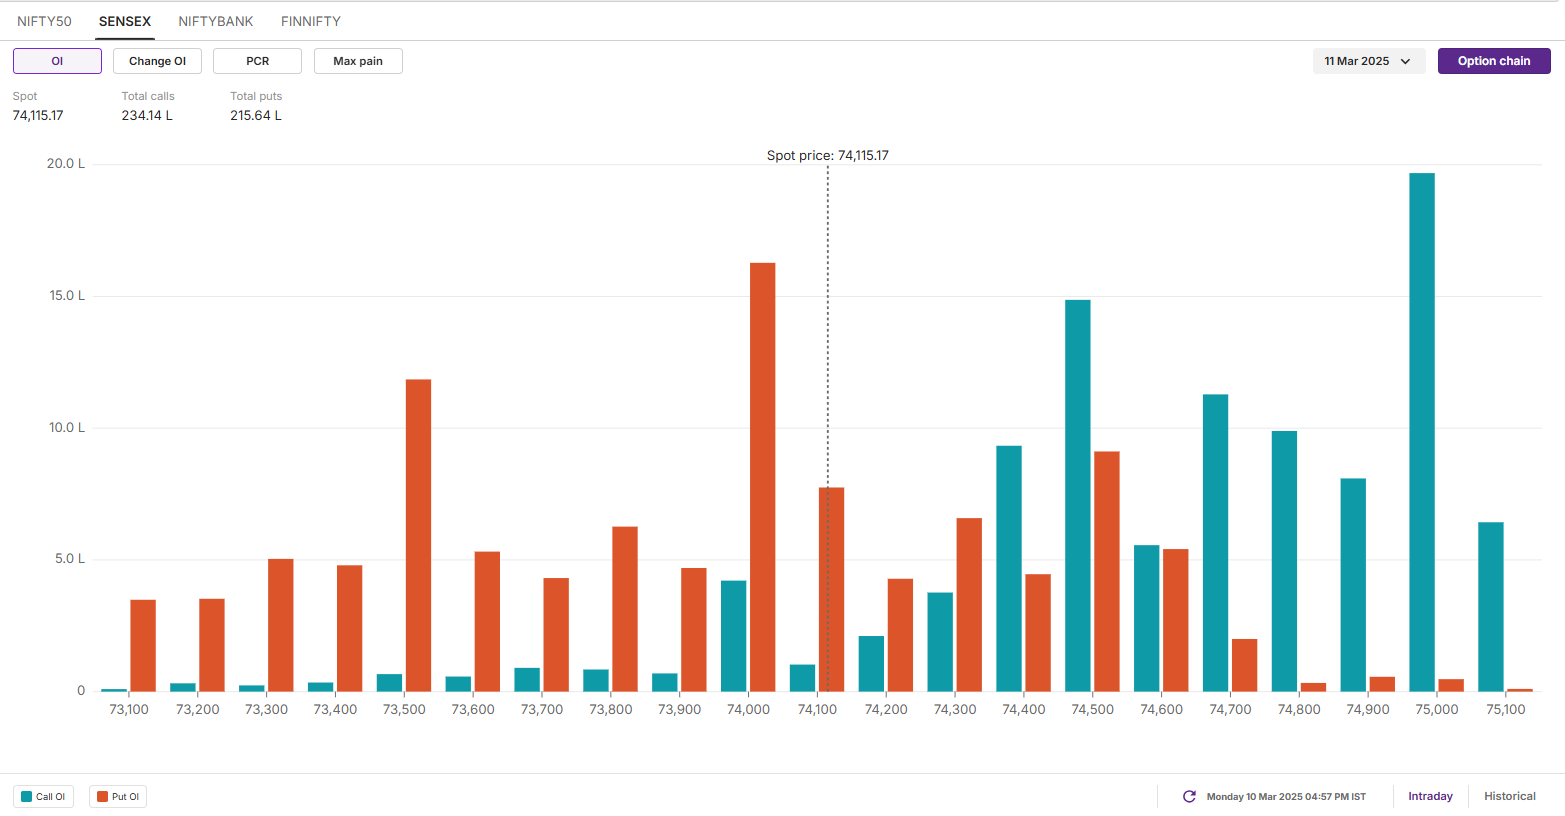
- Max call OI: 75,000
- Max put OI: 74,000
- (10 Strikes from ATM, Expiry: 11 March)
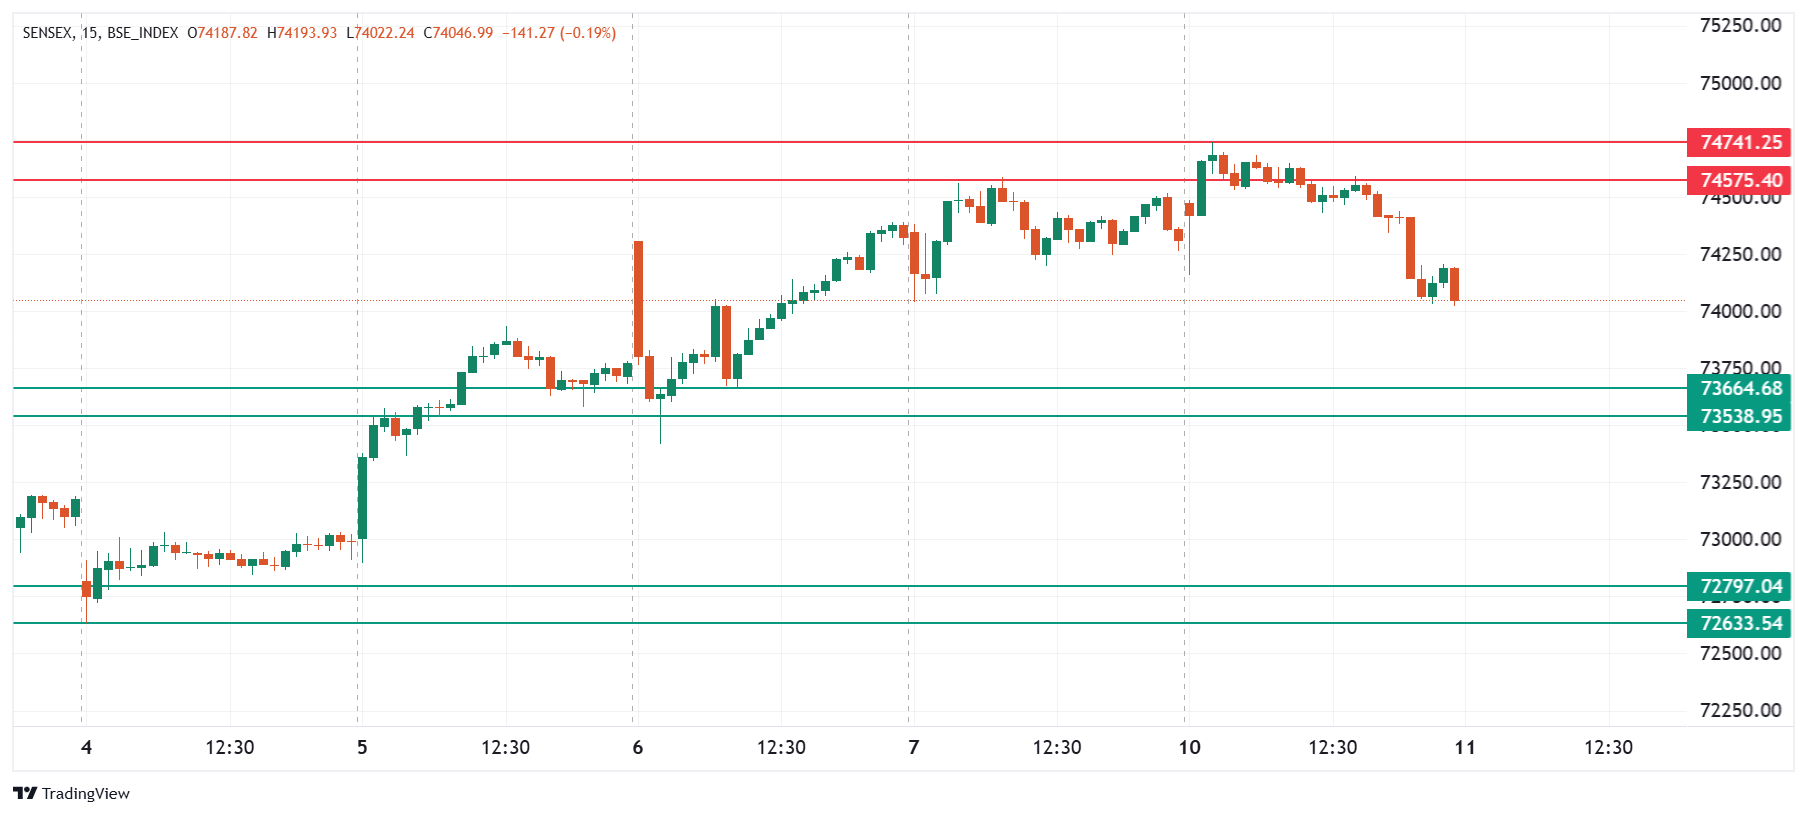
The SENSEX also started the Monday’s session on a positive note and but failed to sustain its gains at higher levels. The index faced resistance around the resistance zone of 21-EMA, forming the shooting star candlestick pattern on the daily chart.
For today's expiry, the SENSEX faces immediate resistance around 74,800 and has seen selling pressure at higher levels. The key support zone is near 73,500; a break below this could weaken sentiment further and push the index toward 73,800. However, a close above 74,700 would turn the trend in favor of the bulls.
The open interest (OI) data for the March 11 expiry saw significant call OI at 75,000 strike, suggesting resistance for the index around this level. Conversely, the put base was observed was 74,000 with low volume, suggesting support for the index around this zone.
FII-DII activity
Stock scanner
In Futures and Options or F&O, long build-up means an increase in Open Interest (OI) along with an increase in price, and short build-up means an increase in Open Interest(OI) along with a decrease in price. Source: Upstox and NSE.
Disclaimer: Derivatives trading must be done only by traders who fully understand the risks associated with them and strictly apply risk mechanisms like stop-losses. The information is only for consumption by the client and such material should not be redistributed. We do not recommend any particular stock, securities and strategies for trading. The securities quoted are exemplary and are not recommendatory. The stock names mentioned in this article are purely for showing how to do analysis. Take your own decision before investing.
About The Author
Next Story


