Market News
Trade setup for 8 July: BANK NIFTY forms indecision pattern — Will 52,000 support hold?
.png)
5 min read | Updated on July 08, 2024, 07:56 IST


SUMMARY
The BANK NIFTY index has formed a doji candlestick pattern on the daily as well as weekly chart. Traders can keep a eye on the low and high of the indecision candle as break of these levels will provide directional clues.

The weekly and daily charts of the NIFTY50 index have formed bullish candlesticks, indicating strength in the current trend.
Asian markets update
The GIFT NIFTY is down by 0.1%, pointing to a flat to negative start for the Indian equities. Other Asian markets are trading mixed. Japan’s Nikkei 225 is flat, while Hong Kong’s Hang Seng index is down 1%.
U.S. market update
- Dow Jones: 39,375 (▲0.1%)
- S&P 500: 5,567 (▲0.5%)
- Nasdaq Composite: 18,352 (▲0.9%)
U.S. indices closed at record highs on Friday after the release of the June jobs report, which increased the likelihood of a September interest rate cut. The U.S. economy added 2,06,000 jobs in June, more than the expected 1,90,000. However, the unemployment rate rose slightly to 4.1%, signalling that the labour market continues to cool.
In addition, the Bureau of Labor Statistics revised down the number of jobs created in April and May by 1,11,000, signalling a cooling economy. Traders are now pricing in a 75% chance of a cut in September, according to the CME's FedWatch tool.
NIFTY50
- July Futures: 24,379 (▲0.1%)
- Open Interest: 5,66,853 (▼2.5%)
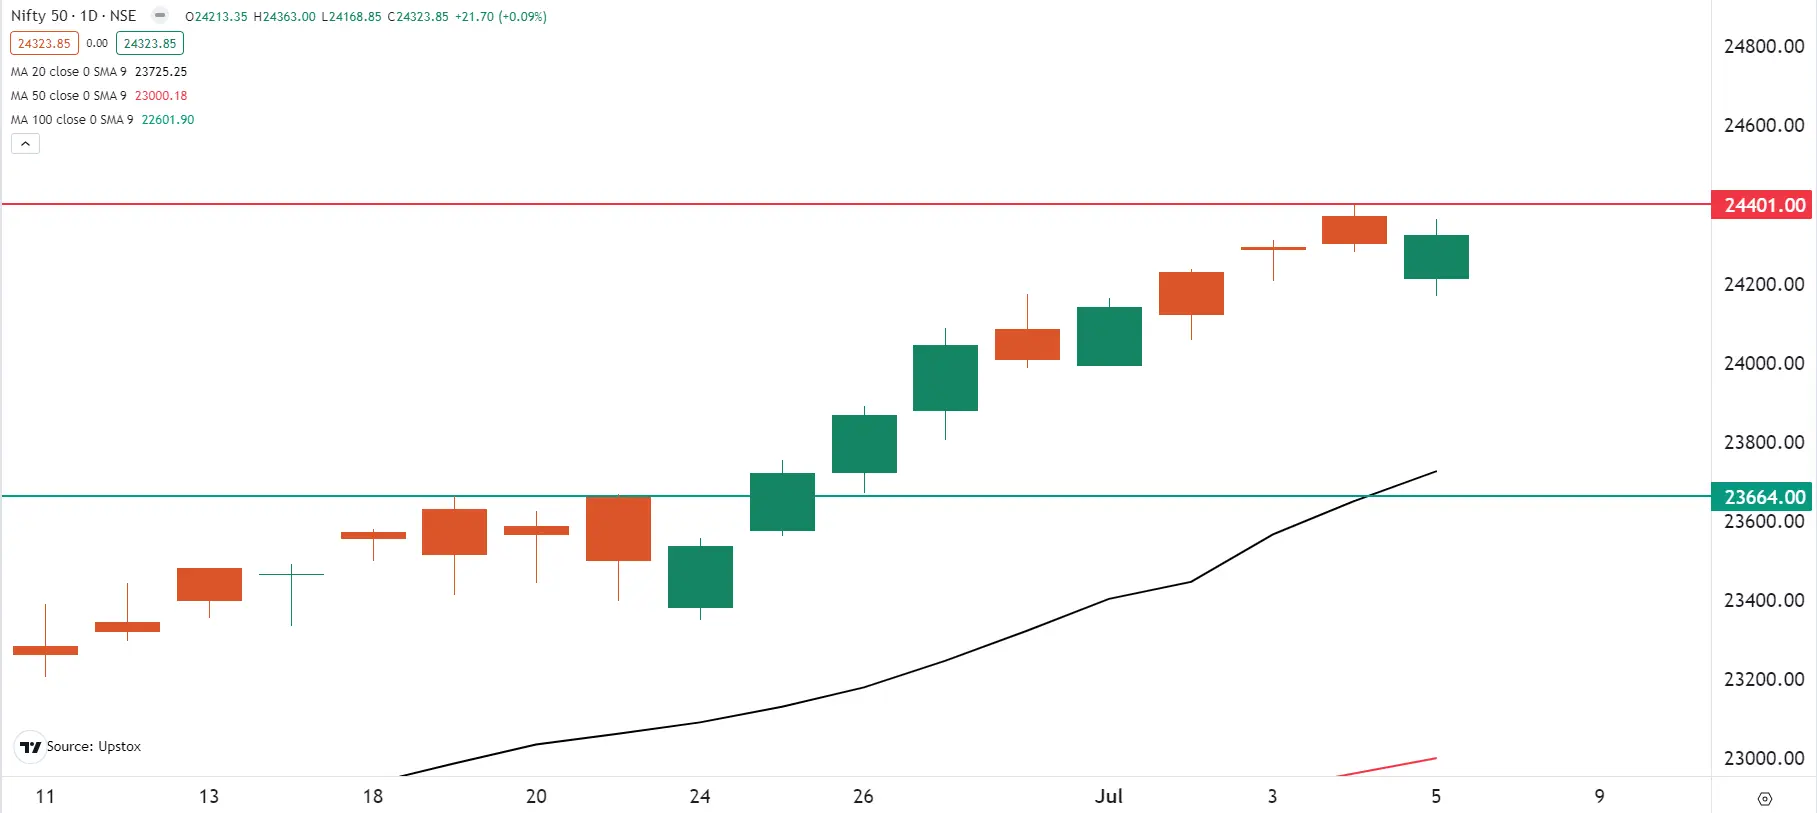
The NIFTY50 index closed Friday's session with a gap-down of nearly 100 points. The index slipped below the key support level of 24,200 on weakness in HDFC Bank. However, the index quickly recovered from the day’s low towards the end of the session and closed above previous week’s high.
The weekly and daily charts of the NIFTY50 index have formed bullish candlesticks, indicating strength in the current trend. On the daily chart, the NIFTY50 index has formed a bullish piercing candlestick pattern. A bullish piercing is a two-candlestick pattern that indicates a potential reversal. It is formed when a green candle opens below the close of the previous red candle after a downtrend and then closes above the midpoint of the red candle. To confirm this pattern, traders often wait for the next day's close to ensure that the bullish trend is sustained before taking action.
Positionally, the index has immediate support at 24,000, while resistance remains at 24,500. We believe that the index is currently consolidating within this range and a break above or below it on the daily chart will provide further directional clues.
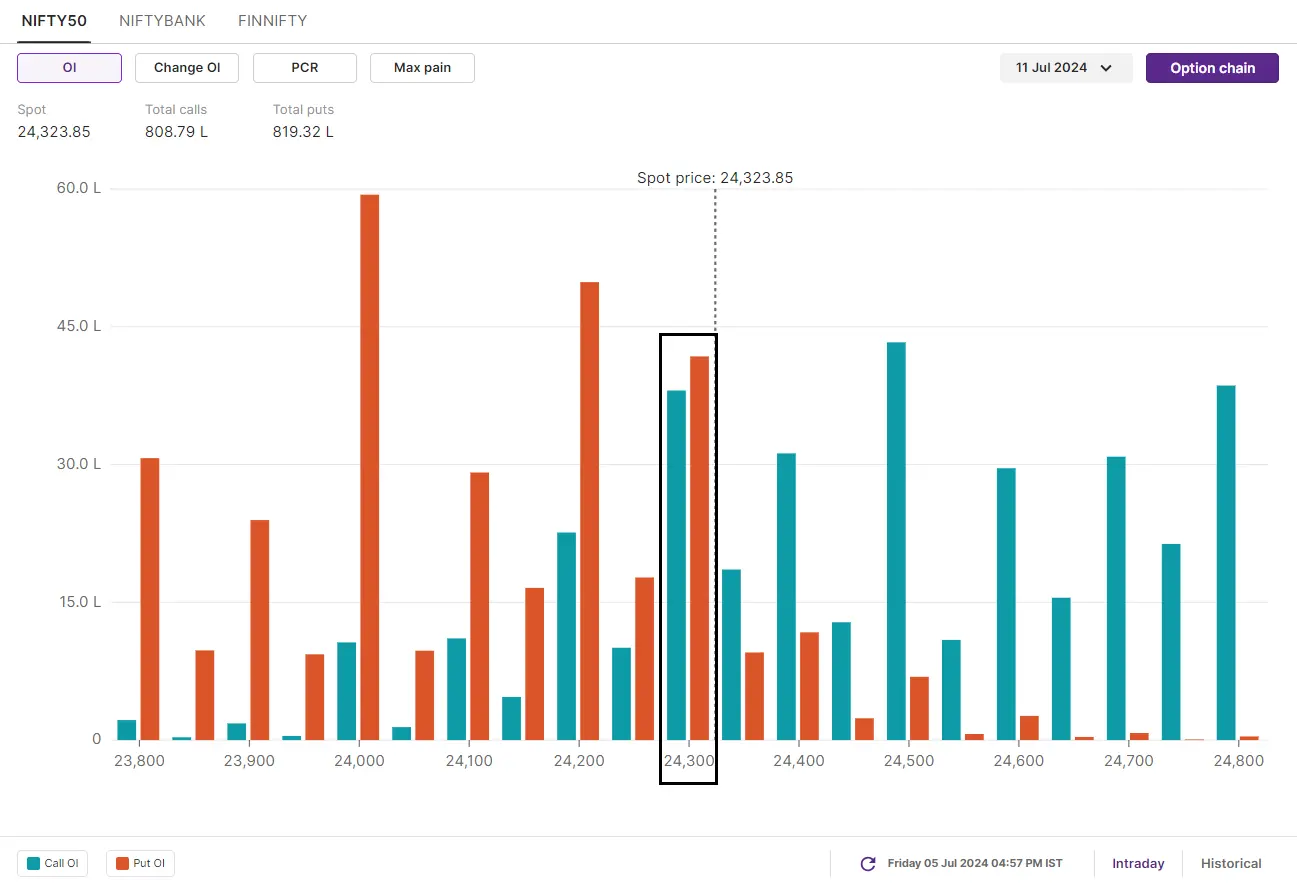
Open interest data for the 11 July expiry shows a significant call base at 24,500 and a put base at 24,000. There was also a significant call and put base at the 24,300 strike, suggesting range-bound activity at higher levels.
BANK NIFTY
- July Futures: 52,724 (▼0.8%)
- Open Interest: 1,73,854 (▼6.6%)
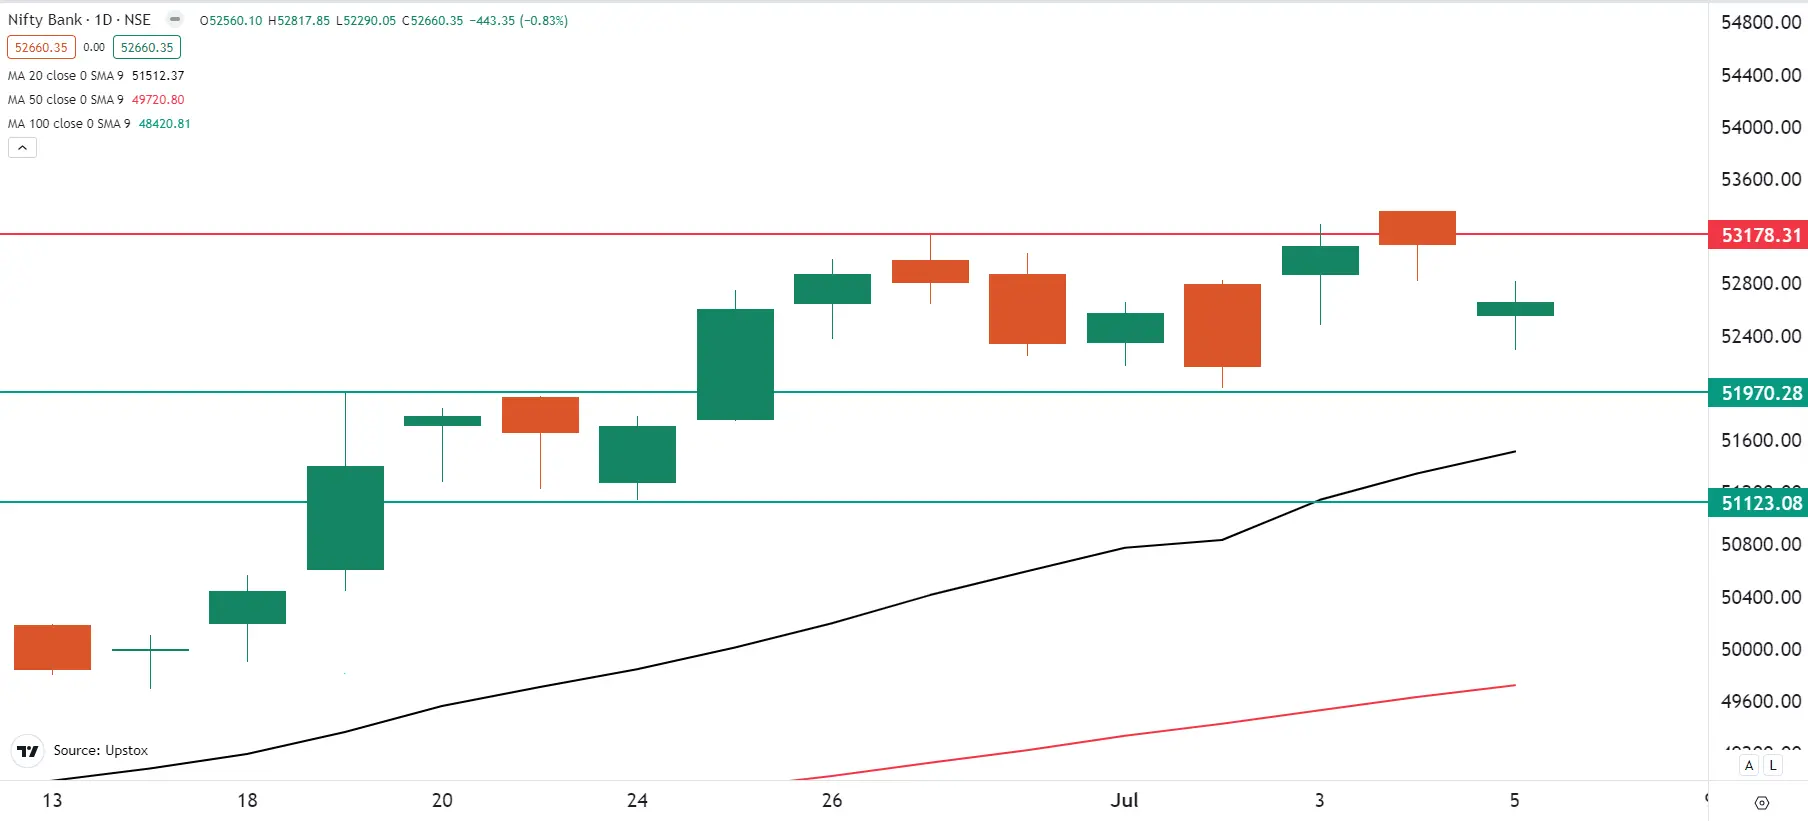
The BANK NIFTY also started Friday's session on a negative note, opening the day down by almost 600 points. The sharp fall in the index was led by HDFC Bank which fell over 4% on the back of weaker than expected Q1 FY25 business update. However, the index protected the 52,500 mark on closing basis as gains in State Bank of India, arrested the fall.
The technical structure of the BANK NIFTY has given mixed signals on the daily as well as weekly charts. The banking index has formed a neutral candlestick pattern after a gap-down start, while on the weekly chart the index failed to close above the previous week’s high and faced selling pressure at higher levels.
In the coming sessions, the immediate support for the index is around 52,000, a break of which will signal weakness. On the other hand, resistance remains at 53,200, which the index failed to breach on the last two attempts.
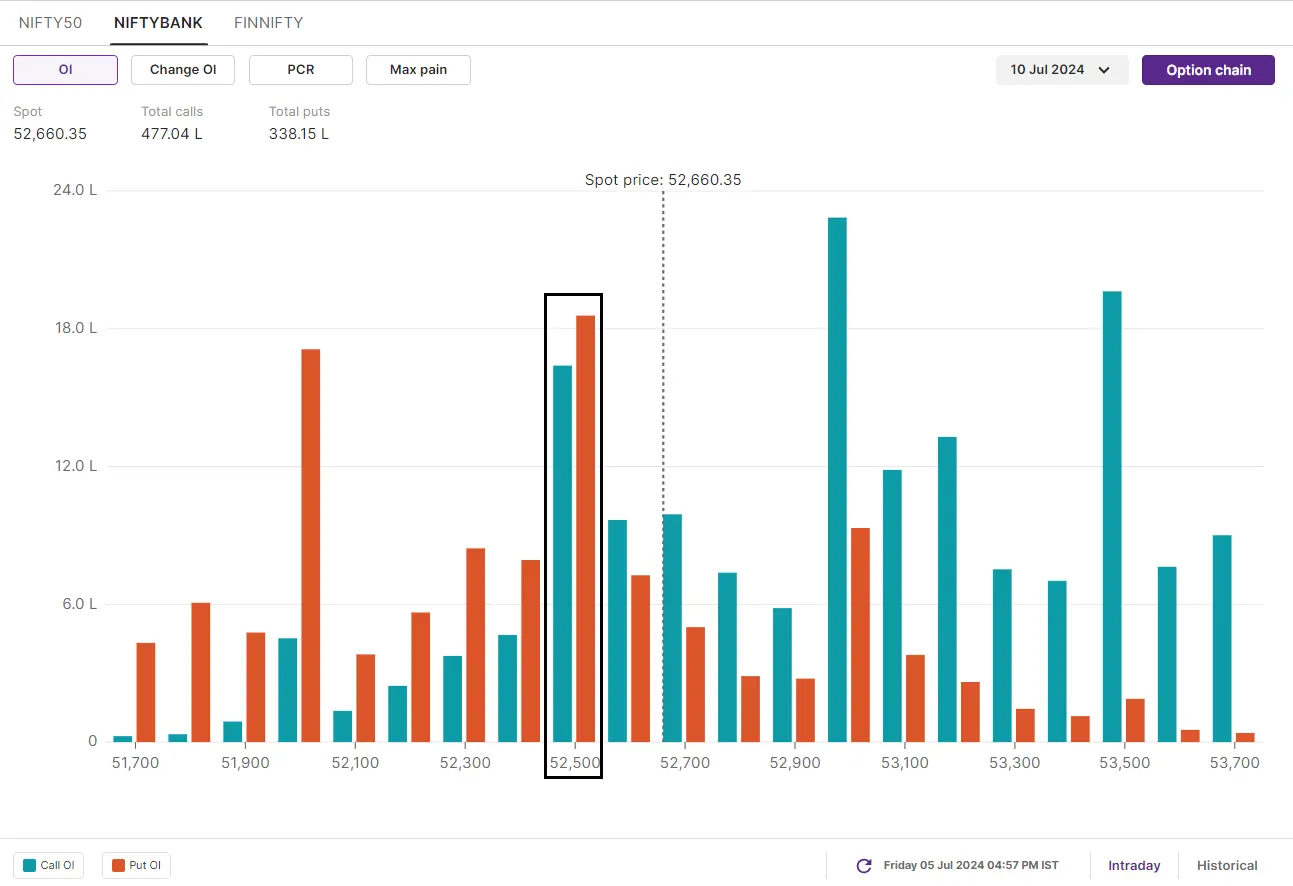
Meanwhile, the open interest data (OI) for the 10 July expiry has maximum call open interest at 53,000 strike, indicating resistance around this level. On the other hand, the put base is concentrated at 51,000 strike, which will act as a support. Indicative of range-bound activity, traders have also placed significant OI in both call and put options at the 52,500 strike.
FII-DII activity
Stock scanner
Long build-up: Laurus Labs, ONGC, Divi’s Laboratories, Federal Bank and Steel Authority of India
Short build-up: HDFC Bank, Indus Towers, Gujarat Narmada Valley Fertilisers & Chemicals, Titan and Metropolis
Under F&O Ban: Aditya Birla Fashion and Retail, Bandhan Bank, Gujarat Narmada Valley Fertilisers & Chemicals, Hindustan Copper, India Cements and Piramal Enterprises
In Futures and Options or F&O, long build-up means an increase in Open Interest (OI) along with an increase in price, and short build-up means an increase in Open Interest(OI) along with a decrease in price.
Source: Upstox and NSE.
Disclaimer: Derivatives trading must be done only by traders who fully understand the risks associated with them and strictly apply risk mechanisms like stop-losses. The information is only for consumption by the client and such material should not be redistributed. We do not recommend any particular stock, securities and strategies for trading. The securities quoted are exemplary and are not recommendatory. The stock names mentioned in this article are purely for showing how to do analysis. Take your own decision before investing.
About The Author
Next Story


