Market News
Trade Setup for January 1: NIFTY50 holds key 23,500 level, wraps up December with losses
.png)
4 min read | Updated on January 01, 2025, 07:16 IST
SUMMARY
The NIFTY50 index ended the December on the negative note and formed an inverted hammer candle on the monthly chart. It is a candlestick pattern that signals potential reversal after a downtrend. It features a small real body near the session's low and a long upper shadow, indicating buying pressure despite initial selling.

The SENSEX managed to defend its 200-day exponential moving average (EMA) after a weak start, closing Tuesday’s session on a flat note.
Asian markets @ 7 am
- GIFT NIFTY: 23,733 (0.04%)
- Nikkei 225: Closed
- Hang Seng: Closed
U.S. market update
- Dow Jones: 42,545 (▼0.0%)
- S&P 500: 5,881 (▼0.4%)
- Nasdaq Composite: 19,310 (▼0.9%)
U.S. indices extended the losing streak for the third session in a row and ended the last session of 2024 on a negative note. The S&P 500 is up more than 23% in 2024, building on a 24% gain in the previous year.
Enthusiasm for AI and potential to boost productivity helped push the major indices to a series of record highs throughout the year. The AI chip major Nvidia and iPhone giant Apple - members of the 'Magnificent 7' - soared 172% and 30% respectively, hitting new highs of their own in 2024.
NIFTY50
- January Futures: 23,805 (▲0.0%)
- Open interest: 5,31,648 (▲7.4%)
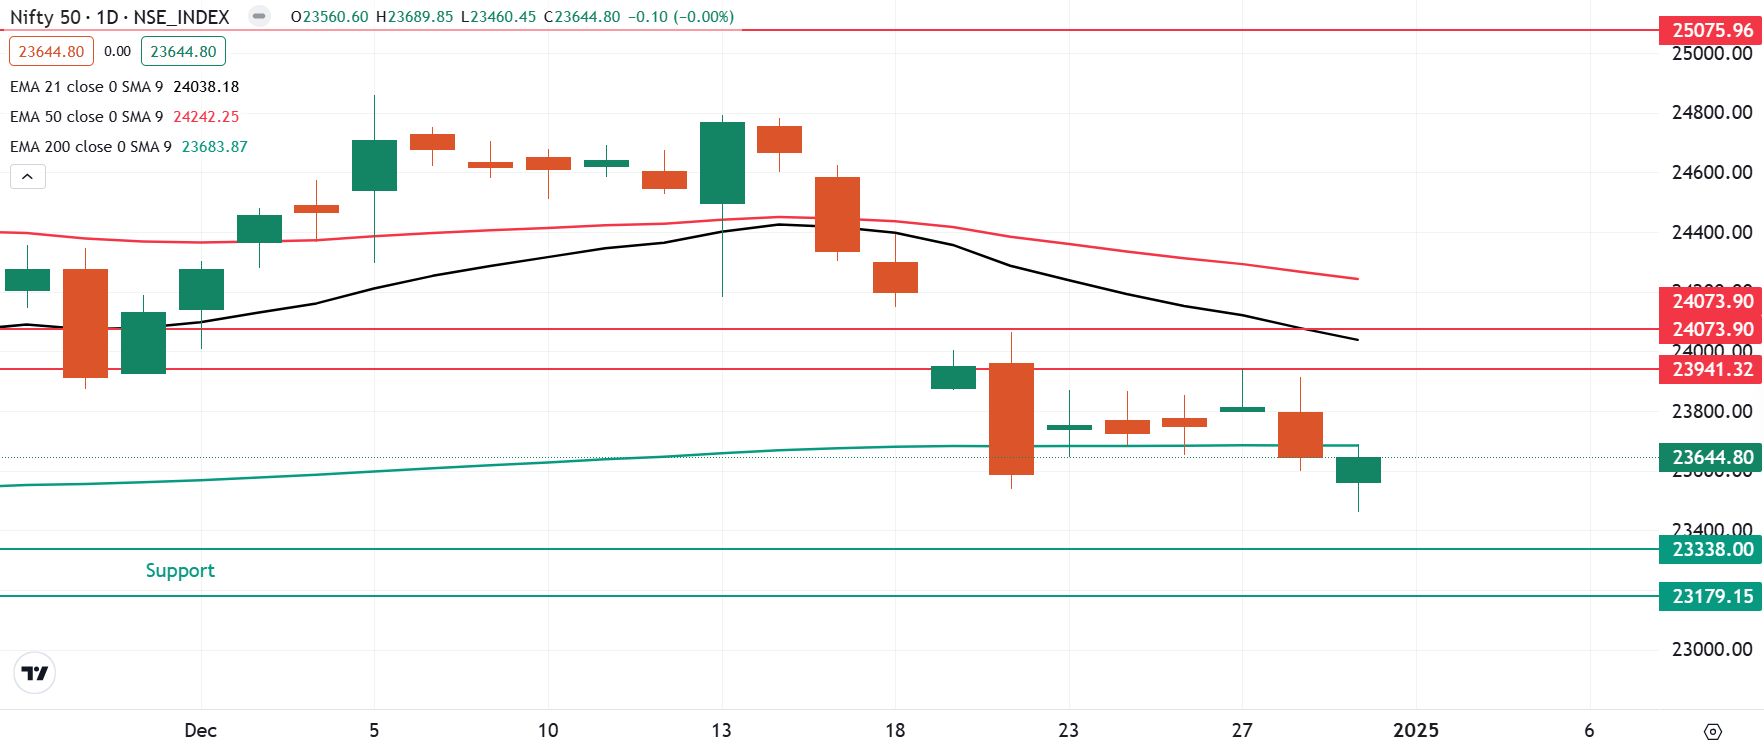
The NIFTY50 index started Tuesday’s session on a negative note and slipped below the 23,500 mark. However, the index made a sharp recovery of nearly 200 points from the day’s low and ended the day’s flat.
On the daily chart, the index dipped below the immediate support zone at 23,500, marking the low from December 20 and ending a five-day consolidation phase. However, it managed to hold above this critical support level at the close, signaling buyer activity around this area. Conversely, the index faces immediate resistance near the 24,000 level. Until the index decisively breaks out of this range, the trend is likely to remain sideways.

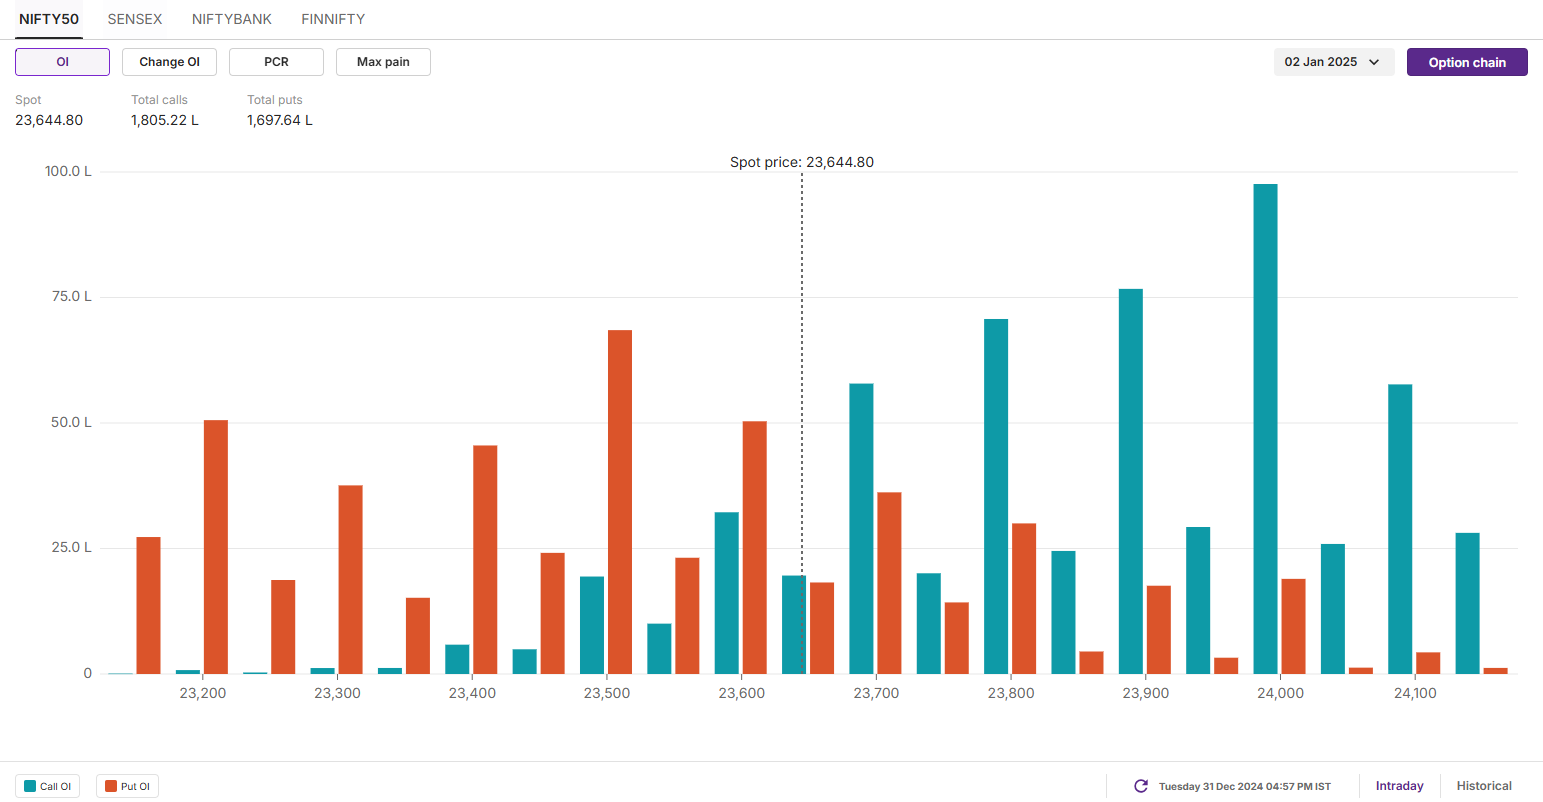
The open interest (OI) data for the 2 January expiry establishes highest call OI at 24,000 strike, making it as immediate resistance zone. On the other hand, the put base was seen at 23,500 strike, suggesting support for the index around this zone.

SENSEX
- Max call OI: 79,000
- Max put OI: 76,000
- (Expiry: 3 Jan)
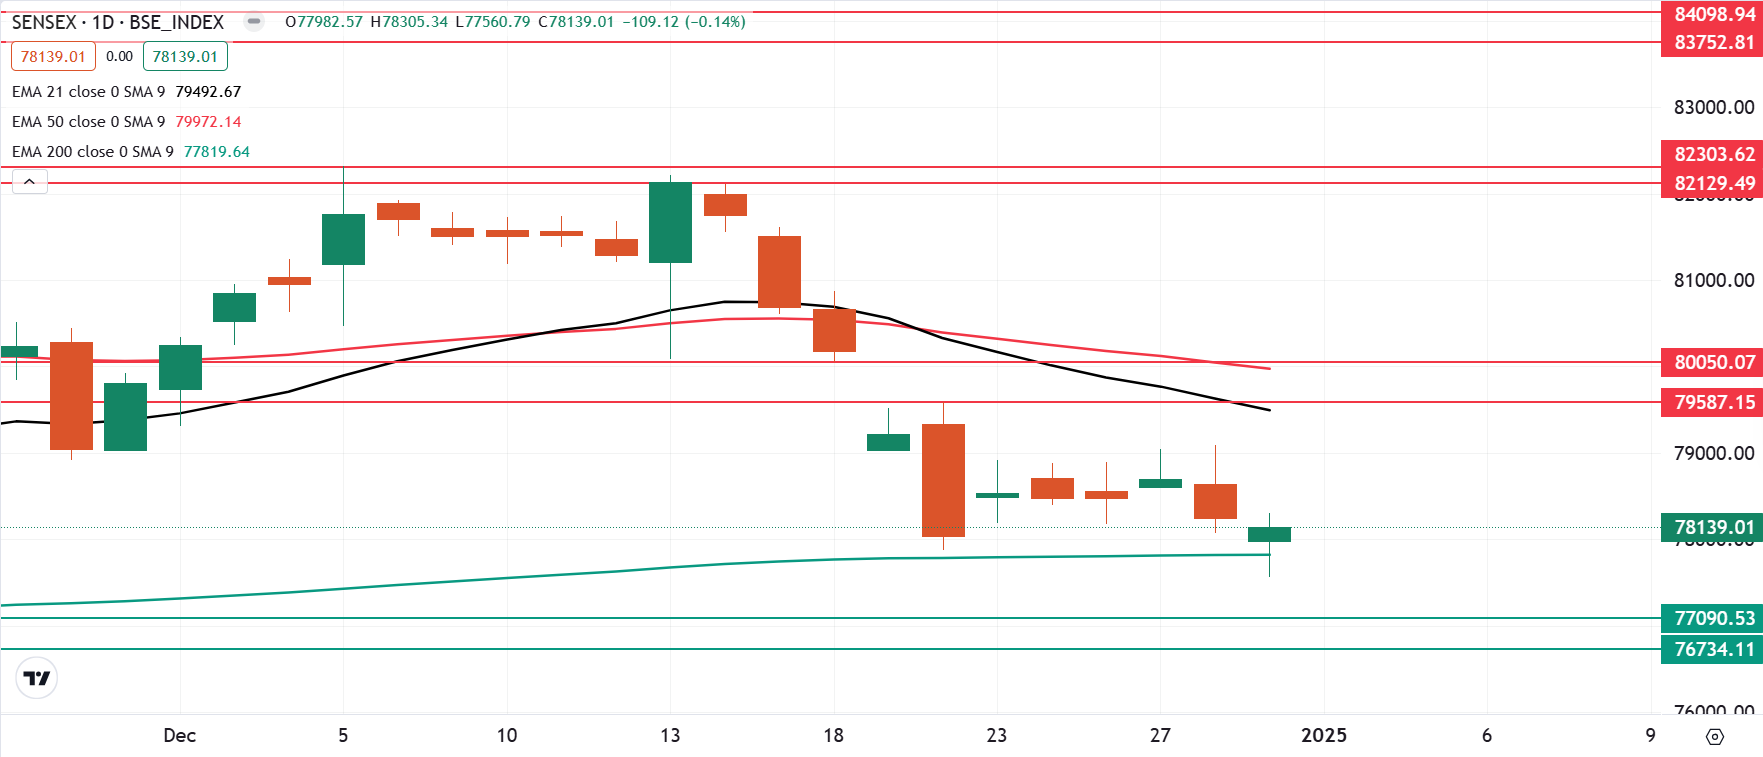
The SENSEX managed to defend its 200-day exponential moving average (EMA) after a weak start, closing Tuesday’s session on a flat note. The index rebounded sharply, recovering over 500 points from the day’s low, and formed a neutral candle on the daily chart.
Technically, the index continues to trade within the range established on December 20, with immediate support near 77,800 and resistance around 79,600. As long as the index stays within this range, the trend is expected to remain rangebound. A decisive breakout or breakdown on a closing basis could provide clearer directional cues.

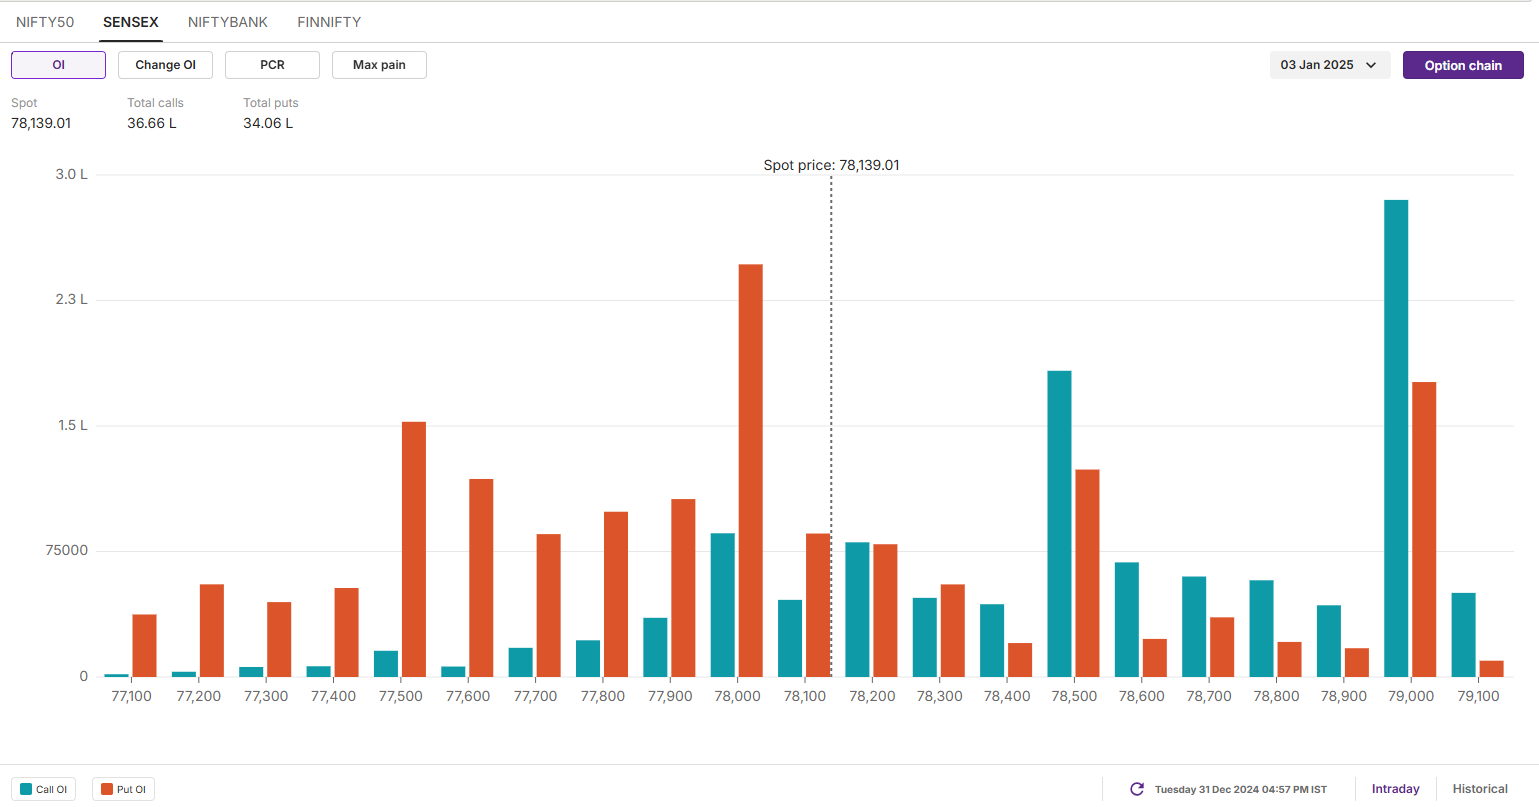
The open interest data for the 3 January expiry highlights significant call base at 79,000 strike, indicating resistance for the index in this zone. On the flip side, the put base was seen at 78,000 strike, pointing at support for the index around this level.

FII-DII activity
Stock scanner
- Long build-up: Adani Total Gas, IRB Infrastructure, Apl Apollo Tubes, Aurobindo Pharma and Oil India
- Short build-up: Birlasoft, Jio Financials and Tata Elxsi
- Under F&O ban: Nil
In Futures and Options or F&O, long build-up means an increase in Open Interest (OI) along with an increase in price, and short build-up means an increase in Open Interest(OI) along with a decrease in price.
Source: Upstox and NSE.
Disclaimer: Derivatives trading must be done only by traders who fully understand the risks associated with them and strictly apply risk mechanisms like stop-losses. The information is only for consumption by the client and such material should not be redistributed. We do not recommend any particular stock, securities and strategies for trading. The securities quoted are exemplary and are not recommendatory. The stock names mentioned in this article are purely for showing how to do analysis. Take your own decision before investing.
About The Author
Next Story

