Market News
Trade setup for Jan 24: NIFTY50 confirms bullish harami pattern, weekly close above 23,000?
.png)
5 min read | Updated on January 24, 2025, 07:20 IST
SUMMARY
The NIFTY50 index confirmed the bullish harami pattern formed on the 22 January and closed above the high of the reversal pattern. This indicates support based buying from the lower levels. However, it is important to note that the broader trend of the index remains as it is still trading below all its key daily exponential moving averages like 21, 50 and 200.
Stock list
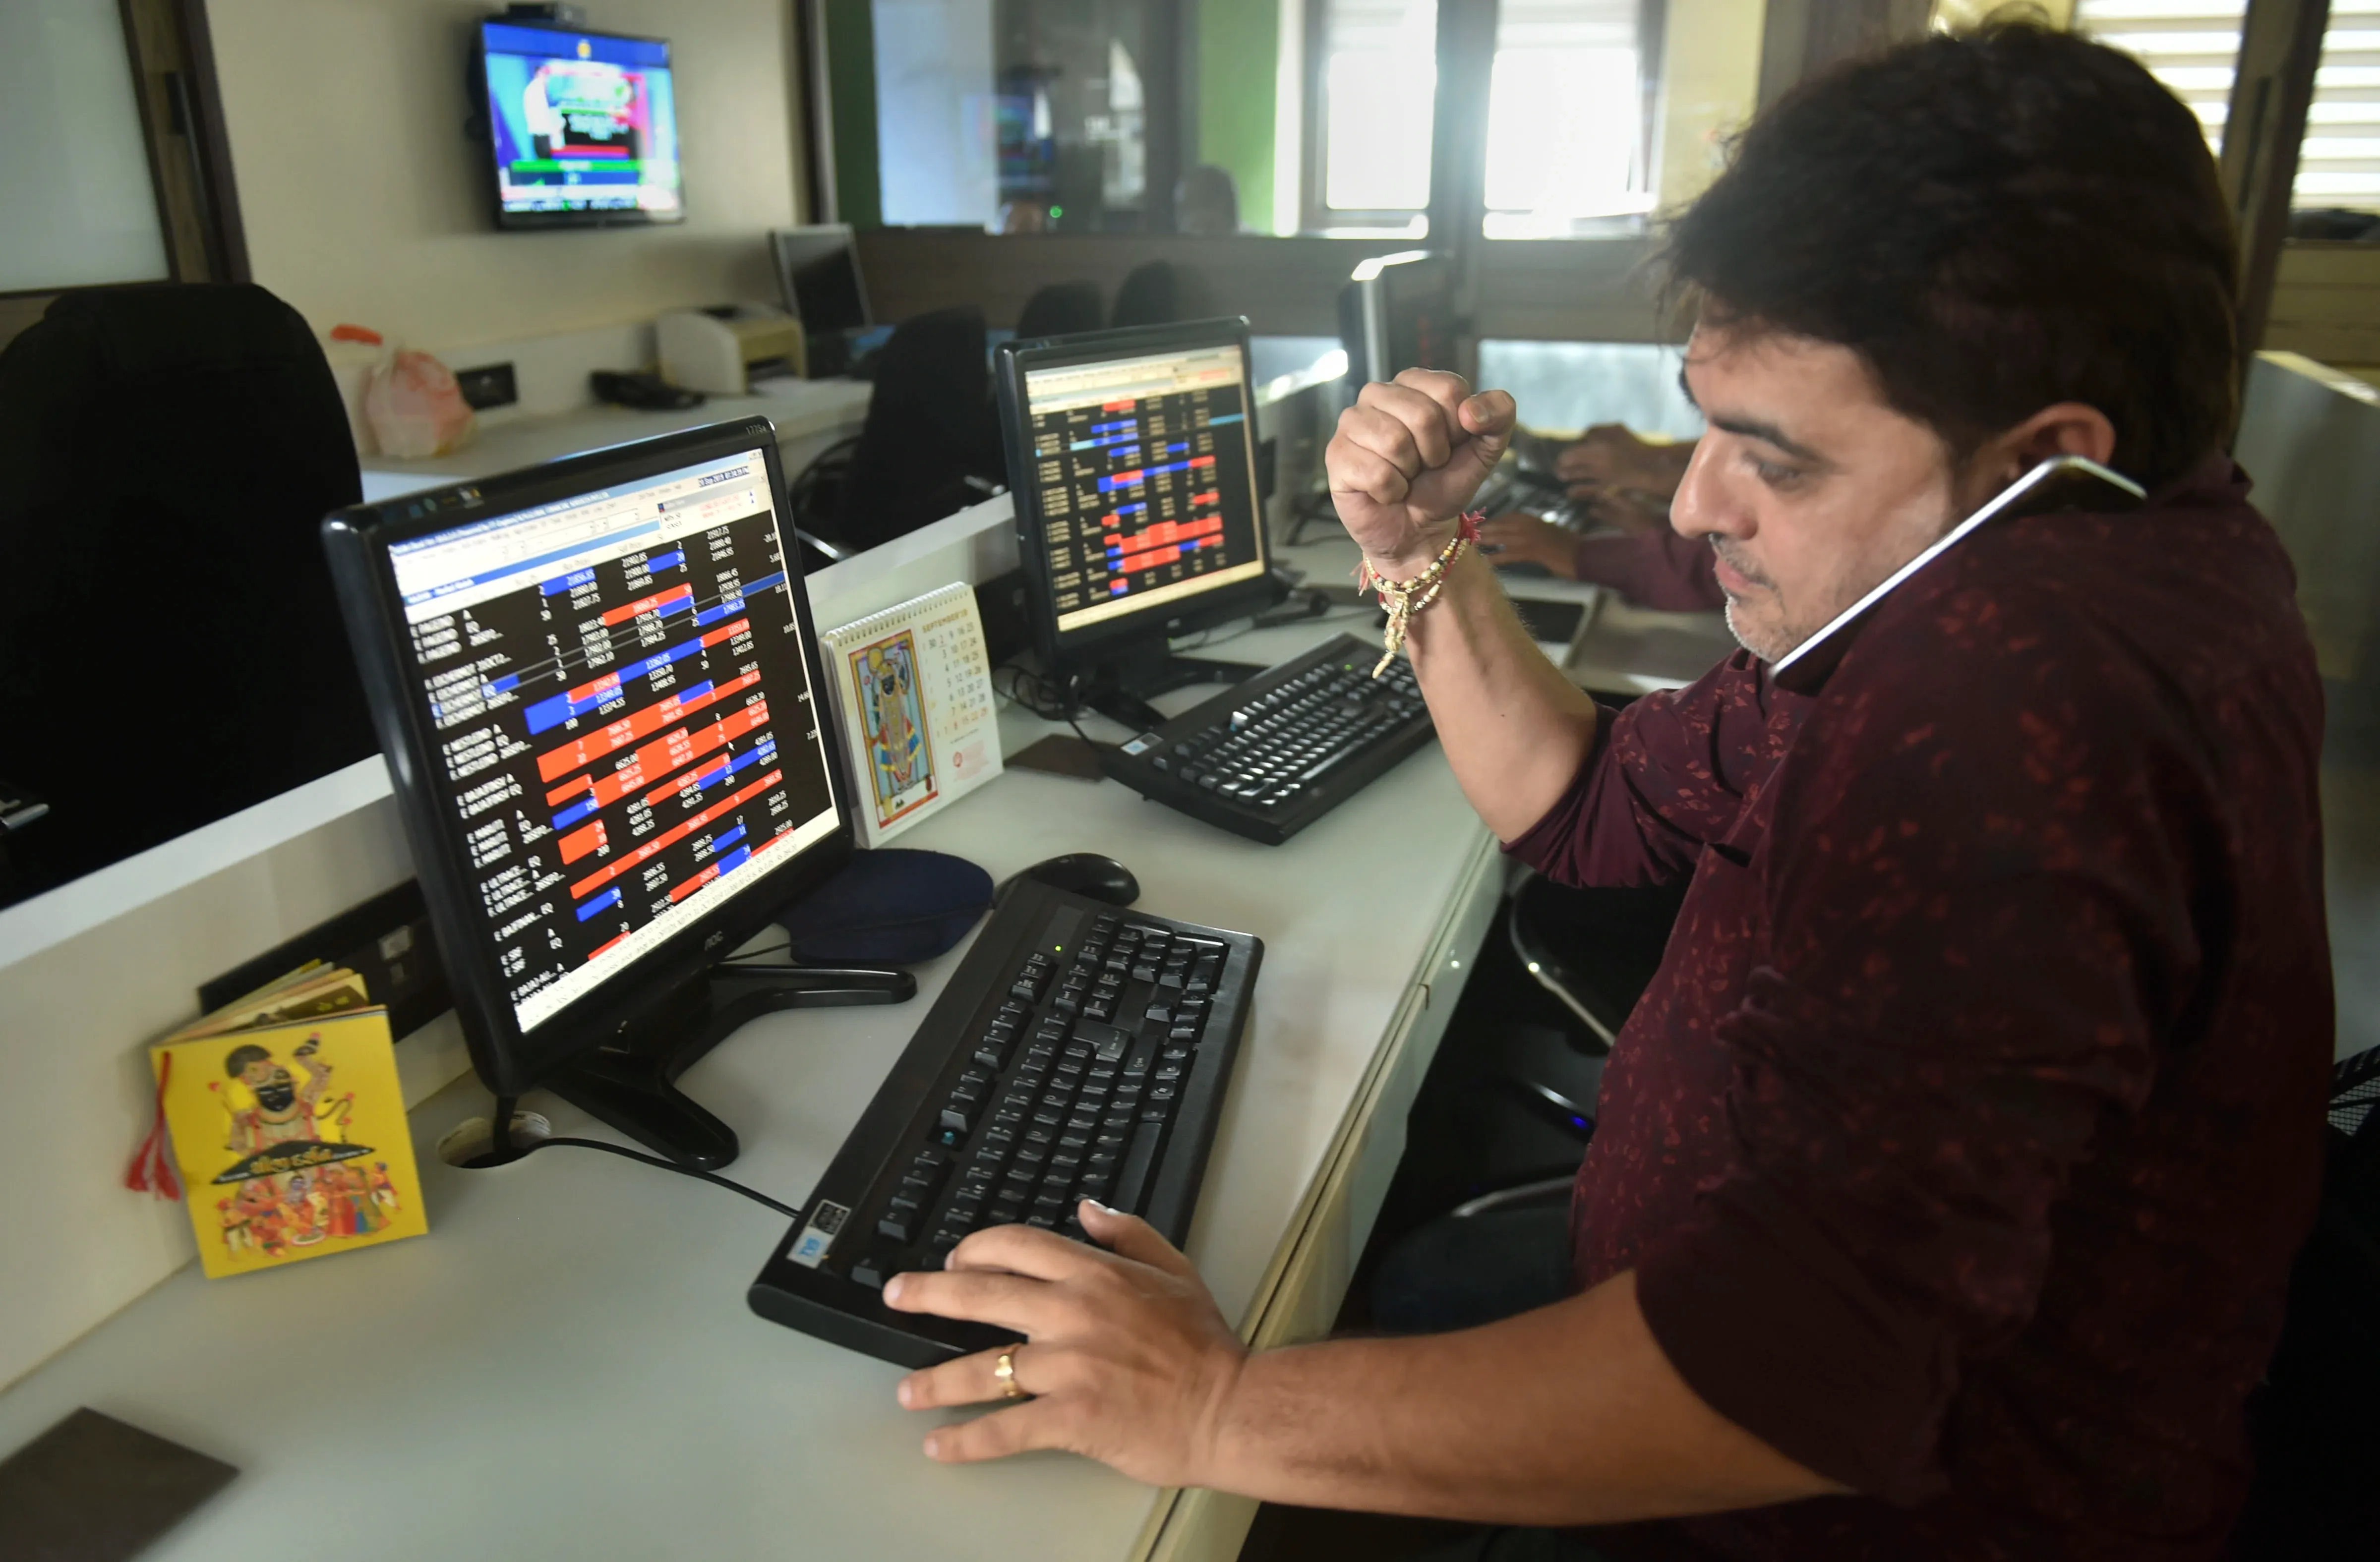
The SENSEX is currently oscillating between 77,300 and 75,800 and witnessed significant volatility throughout the week. | Image: PTI
Asian markets @ 7 am
- GIFT NIFTY: 23,299 (+0.16%)
- Nikkei 225: 40,035 (+0.19%)
- Hang Seng: 19,842 (+0.72%)
U.S. market update
- Dow Jones: 44,565 (▲0.9%)
- S&P 500: 6,118 (▲0.5%)
- Nasdaq Composite:20,053 (▲0.2%)
U.S. indices extended the winning momentum to the fourth day in a row with the S&P 500 index closing at a fresh all-time high in 2025. This comes after the U.S. President Donald Trump called for lower interest rates and cheaper oil prices.
In his virtual address at the Word Economic Forum he said that interest rates should drop immediately and he will ask Saudi Arabia and OPEC countries to lower the price of oil.
NIFTY50
- January Futures: 23,263 (▲0.2%)
- Open interest: 5,45,482(▼3.1%)
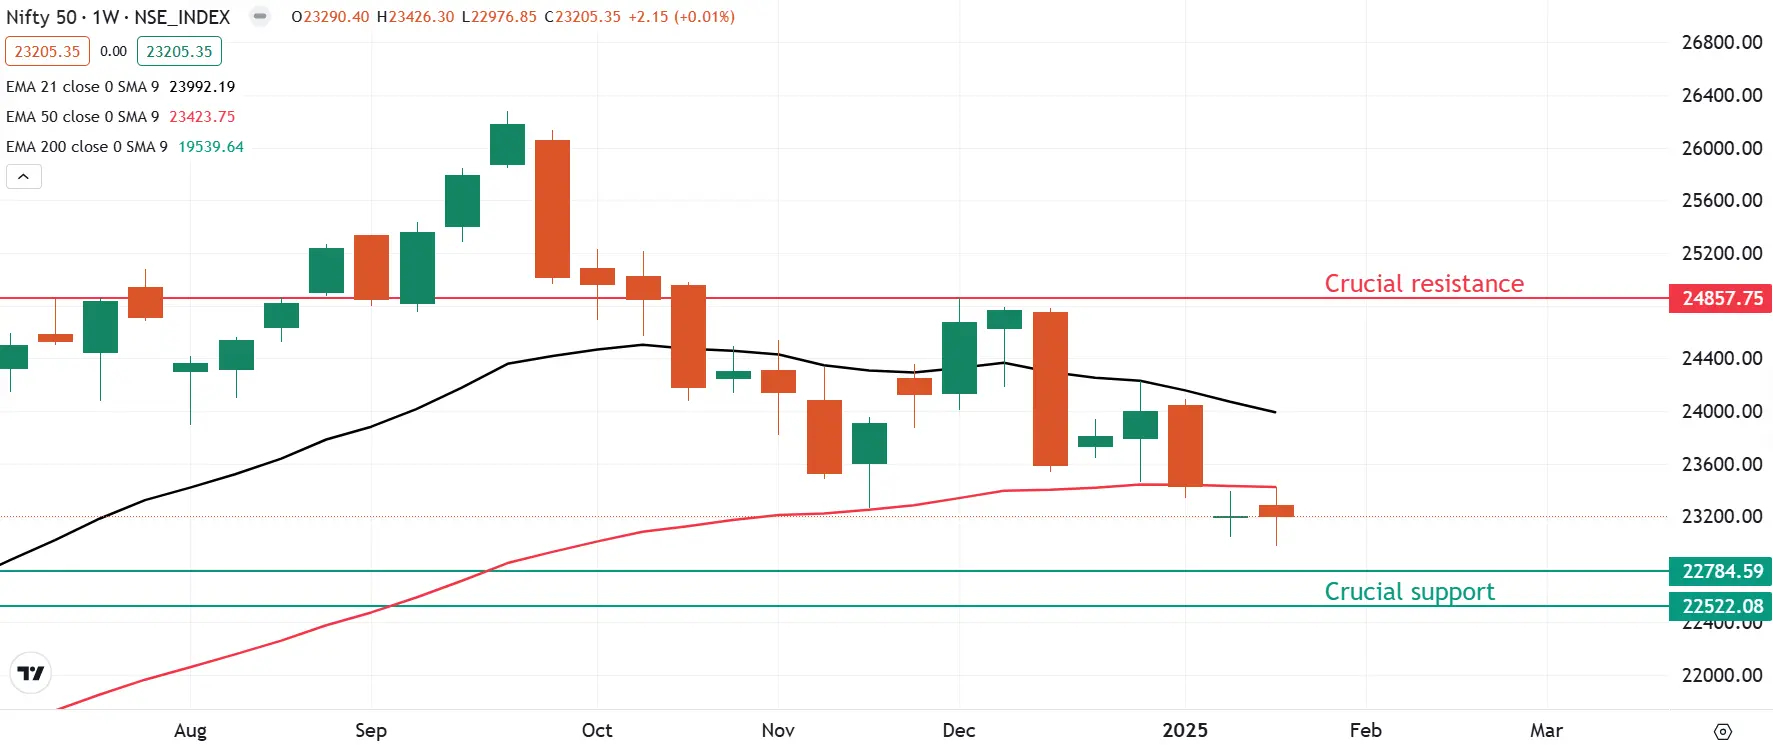
After a flat start, the NIFTY50 index resumed its upward trajectory and closed above the previous session’s high, confirming the bullish harami pattern formed on 22 January. However, selling pressure emerged towards the end of the session, indicating lack of strength in the rebound.
A bullish harami consists of a small bullish candle that is completely within the previous larger bearish candle, indicating a slowdown in selling pressure and possible buying interest. However, the pattern gets confirmed if the close of the subsequent candle is above the high of the harami candle.
The weekly chart indicates that the broader trend of the index remains bearish, as it continues to trade below both the 21 and 50 weekly exponential moving averages (EMAs). Last week, formation of a doji candlestick pattern around the 23,000 mark highlights investor indecision. Traders should closely monitor the pattern’s high and low for further directional clues. A decisive close above the high or below the low of the doji pattern could signal the index’s next move.
SENSEX
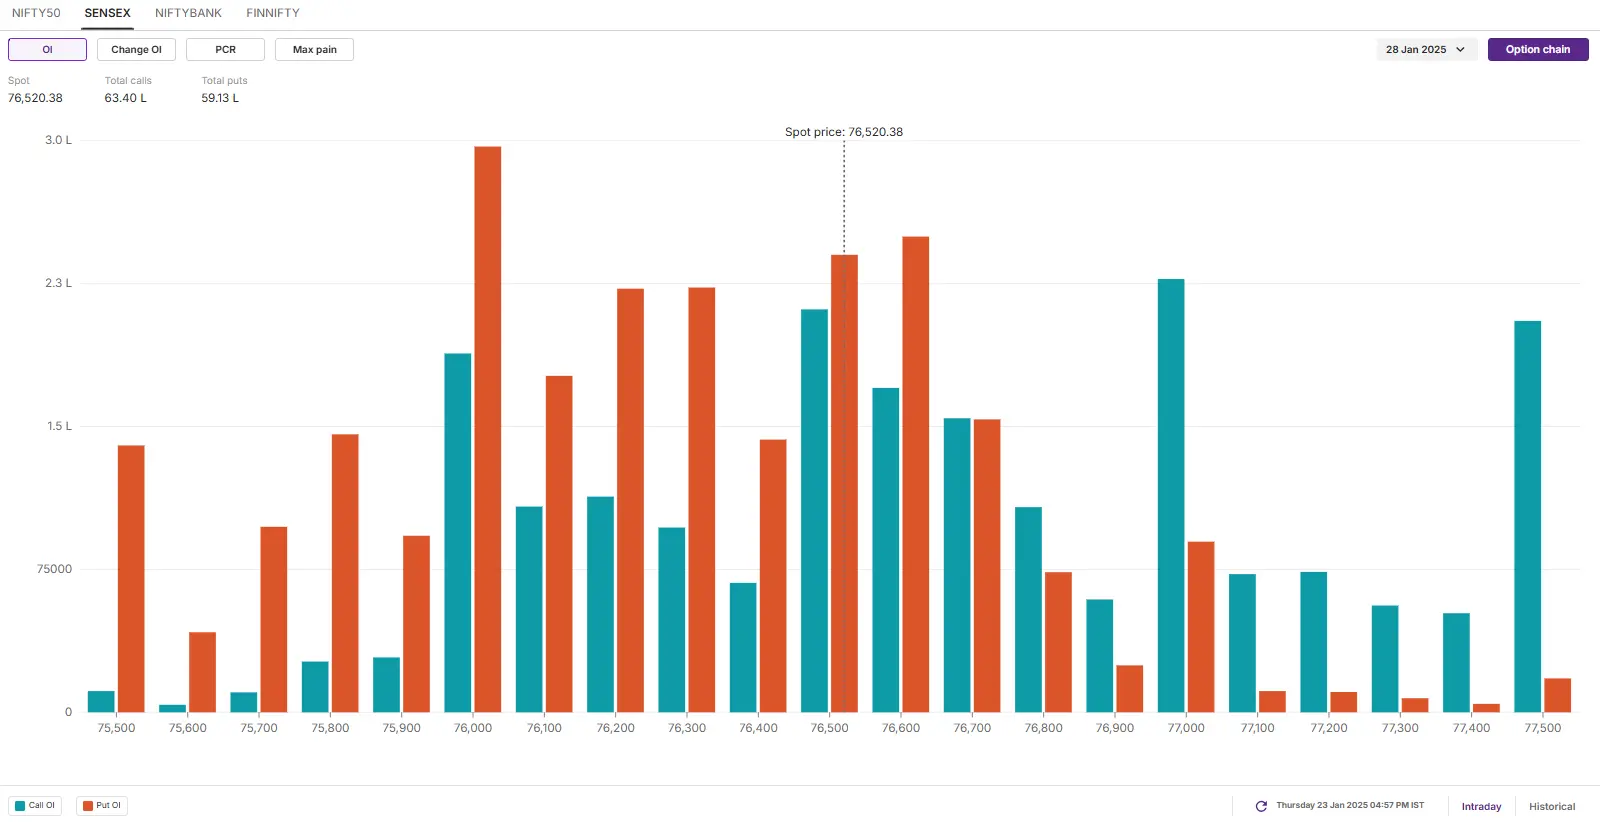
- Max call OI: 78,000
- Max put OI: 76,000
- (Expiry: 28 Jan)
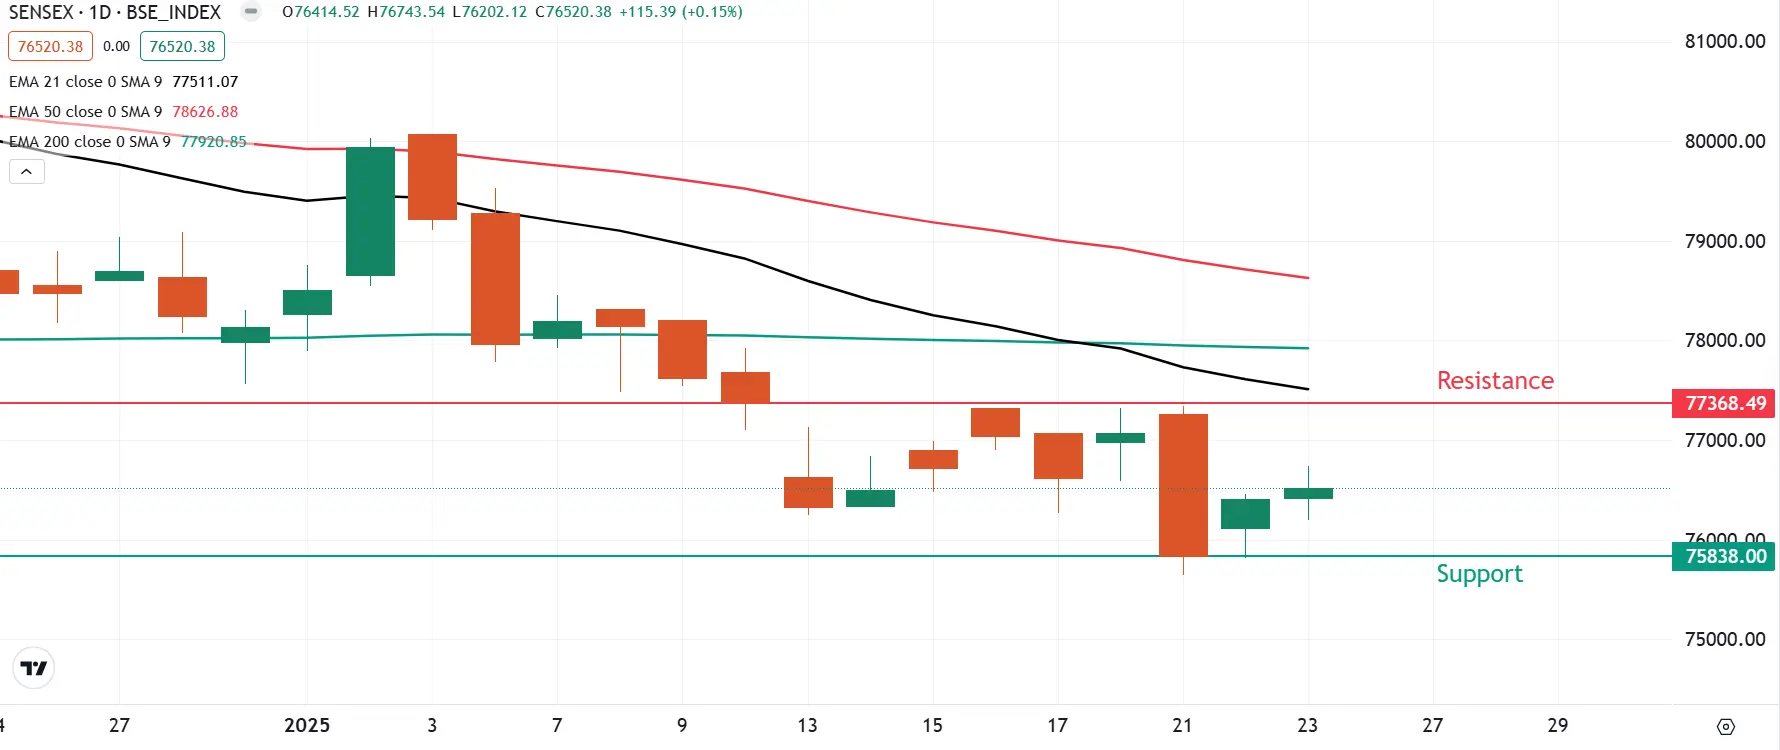
The SENSEX began Thursday’s session on a flat note, continuing to trade within the 77,300–75,800 range for the eighth consecutive session, except for Tuesday’s false breakdown. However, the index confirmed the bullish harami pattern by closing above the high of the reversal pattern formed on January 22.
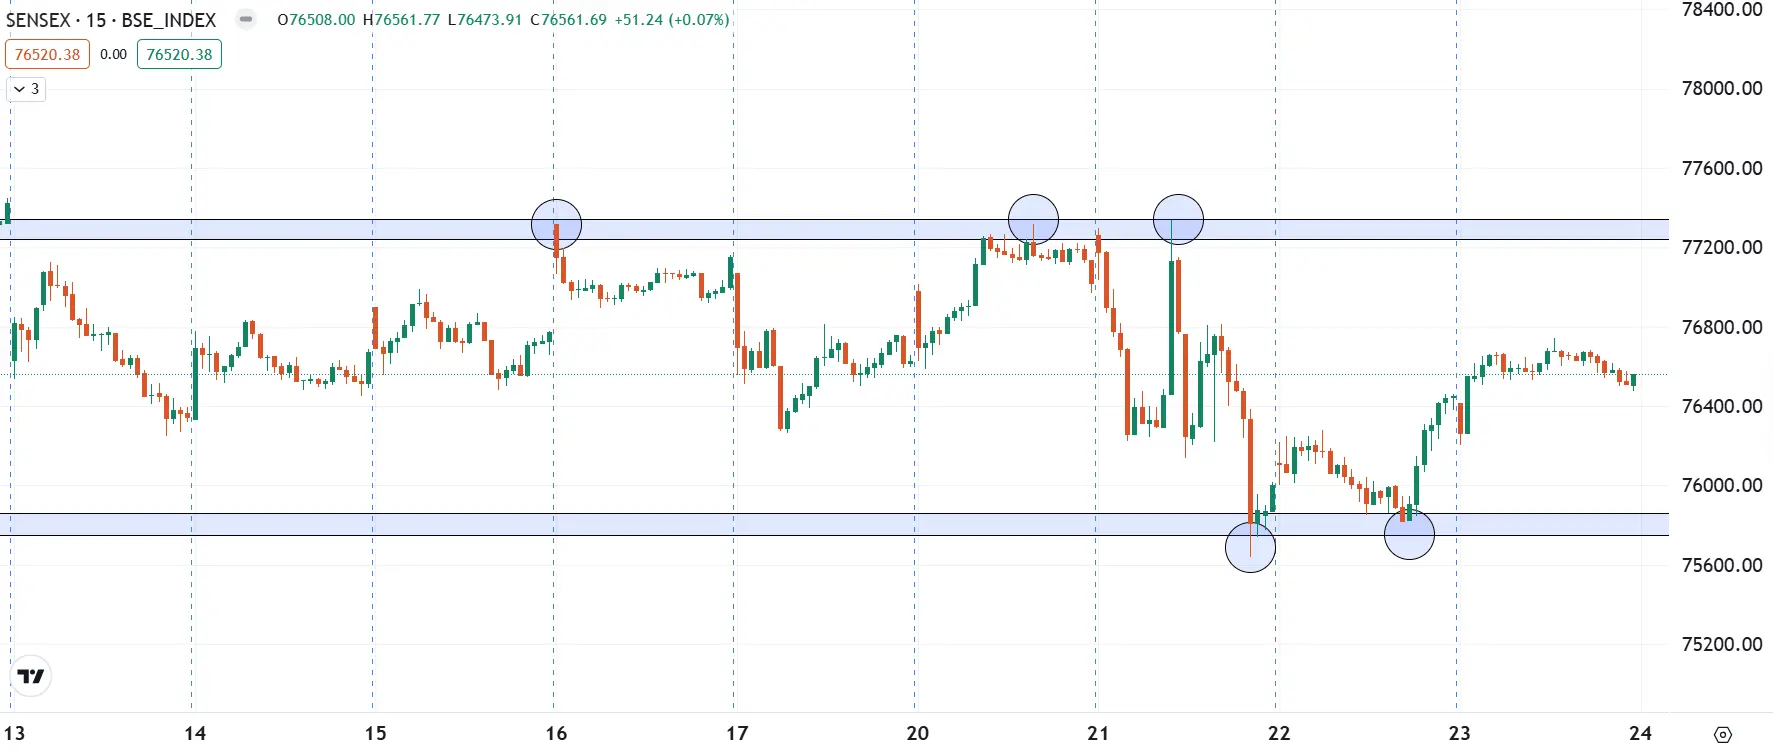
As highlighted on the chart below, the SENSEX is currently oscillating between 77,300 and 75,800 and witnessed significant volatility throughout the week. Meanwhile, as per the weekly and daily chart, the broader trend of the index remains weak. It is still trading below both the 21 and 50 weekly and daily EMAs, signalling lack of momentum.
For Tuesday’s expiry, short-term traders should closely watch the highlighted range of 77,300 to 75,800 on the 15-minute chart. The index is likely to remain volatile and range-bound within this zone. A decisive breakout beyond this range during intraday trading could offer clearer directional cues.
The open interest data for the 28 January expiry saw significant put build-up at 76,000 strike, pointing support for the index around this zone. On the flip side, the call base was visible at the 77,000 strike, indicating resistance for the index around this zone. This build-up in the options market broadly aligns with the range highlighted above on the 15-minute chart.
FII-DII activity
Stock scanner
- Long build-up: Coforge, Persistent Systems, Pidilite Industries, Ultratech Cement and Mphasis
- Short build-up: Kalyan Jewellers, AU Small Finance Bank, Bharat Petroleum and CG Power
- Under F&O ban: Aditya Birla Fashion and Retail, Bandhan Bank, Can Fin Homes, Dixon Technologies, IndiaMART InterMESH, L&T Finance, Manappuram Finance, Mahanagar Gas and Punjab National Bank
- Out of F&O ban: Angel One, Kalyan Jewellers and RBL Bank
In Futures and Options or F&O, long build-up means an increase in Open Interest (OI) along with an increase in price, and short build-up means an increase in Open Interest(OI) along with a decrease in price. Source: Upstox and NSE.
Disclaimer: Derivatives trading must be done only by traders who fully understand the risks associated with them and strictly apply risk mechanisms like stop-losses. The information is only for consumption by the client and such material should not be redistributed. We do not recommend any particular stock, securities and strategies for trading. The securities quoted are exemplary and are not recommendatory. The stock names mentioned in this article are purely for showing how to do analysis. Take your own decision before investing.
About The Author
Next Story

