Market News
Trade Setup for Jan 2: NIFTY50 climbs past 200 EMA, tops previous day’s high
.png)
4 min read | Updated on January 02, 2025, 07:24 IST
SUMMARY
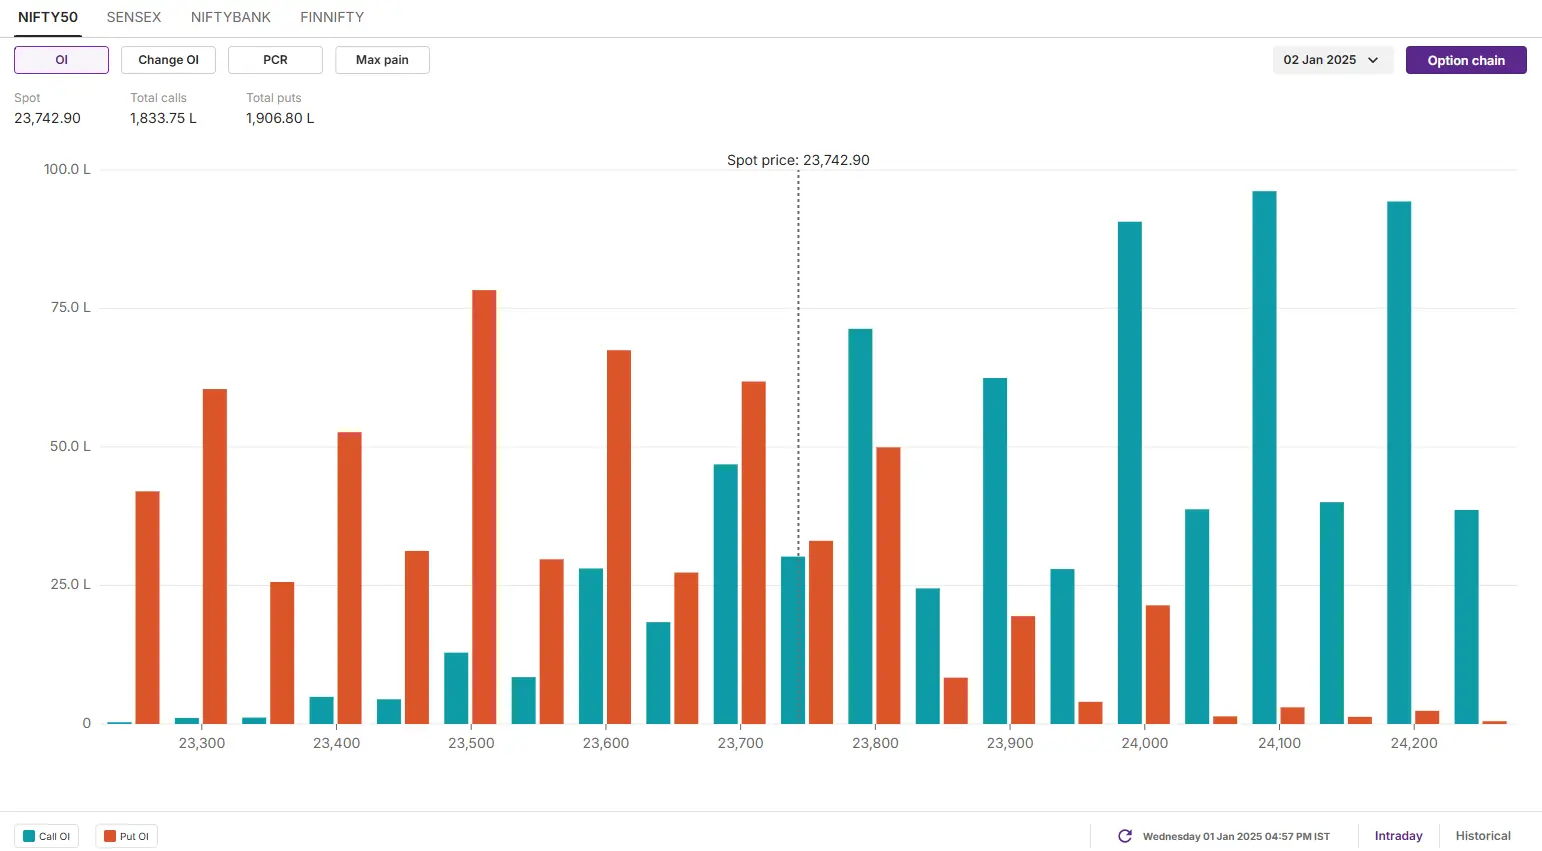
According to the options data for today’s expiry, the NIFTY50 index saw a significant call and put a base at 24,100 and 23,500 strikes. This indicates that the market participants are expecting a rangebound movement within this range with the base around 23,800.

The NIFTY50 index extended the winning momentum for the second consecutive day and reclaimed its 200 day exponential moving average (EMA).
Asian markets @ 7 am
- GIFT NIFTY: 23,844 (-0.14%)
- Nikkei 225: Closed
- Hang Seng: 19,858.57 (-1%)
U.S. market update
U.S. equity and bond markets were closed on Wednesday on account of the New Year’s day.
NIFTY50
- January Futures: 23,897 (▲0.4%)
- Open interest: 5,30,818 (▼0.1%)
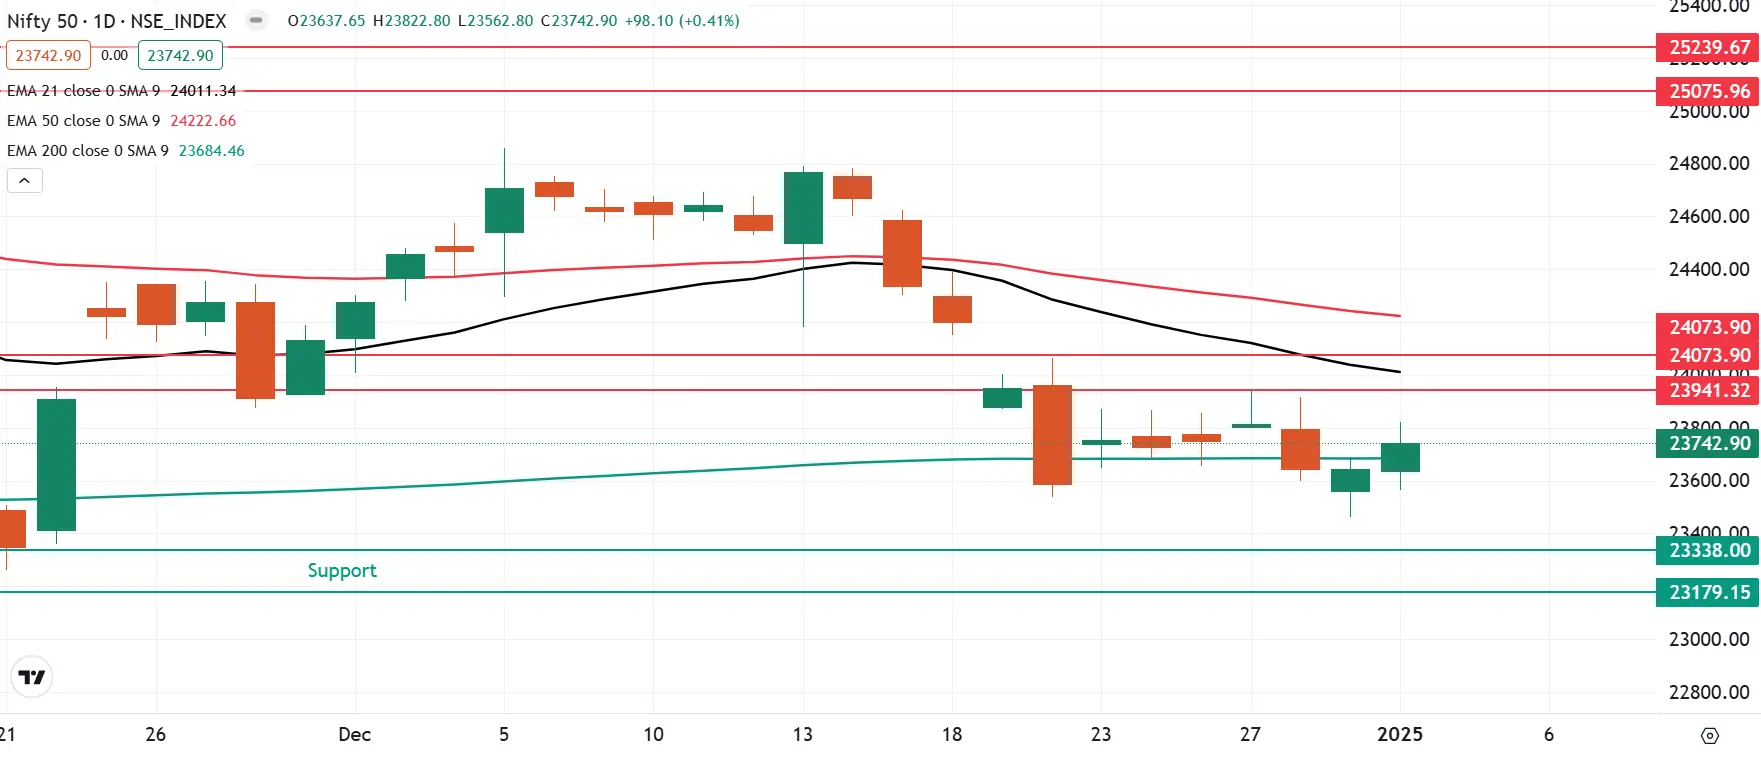
The NIFTY50 index extended the winning momentum for the second consecutive day and reclaimed its 200 day exponential moving average (EMA). The index closed above its previous day’s high after eleven trading sessions, forming a bullish candle on the daily chart.
The technical structure of the index as per the daily chart remains rangebound within the range of 20 December. It formed a bullish candle on the daily chart as it oscillates around the 200 EMA, its crucial support zone. Positionally, traders can monitor the high and the low of 20 December’s candle. A close above the high or below the low of this candle will provide further directional clues.
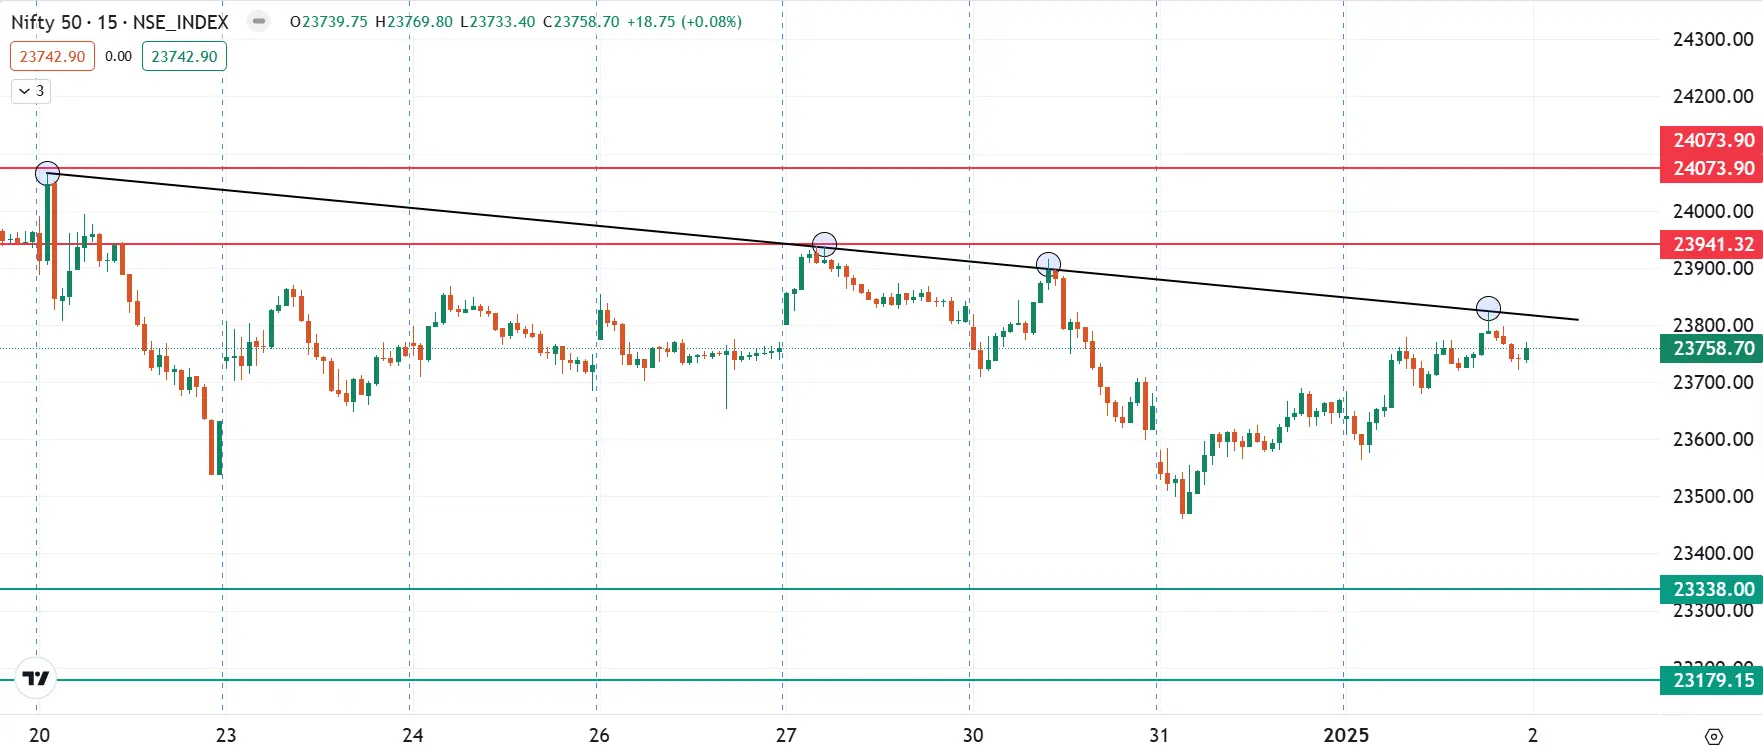
As per the 15 minute chart, the index took resistance four times in a row from the downward slopping trendline, indicating resistance for the index around this zone. If the index breaks this trendline with a strong candle, it may retest the 24,000. On the flip side, the support is visible around the 23,300 area.
The open interest (OI) data for the 2nd January expiry suggests rangebound movement for the index. The highest call OI is concentrated at the 24,100 and 24,200 strikes, indicating strong resistance around this zone. Conversely, the largest put OI is observed at the 23,500 and 23,600 strikes, highlighting significant support in this range.
SENSEX
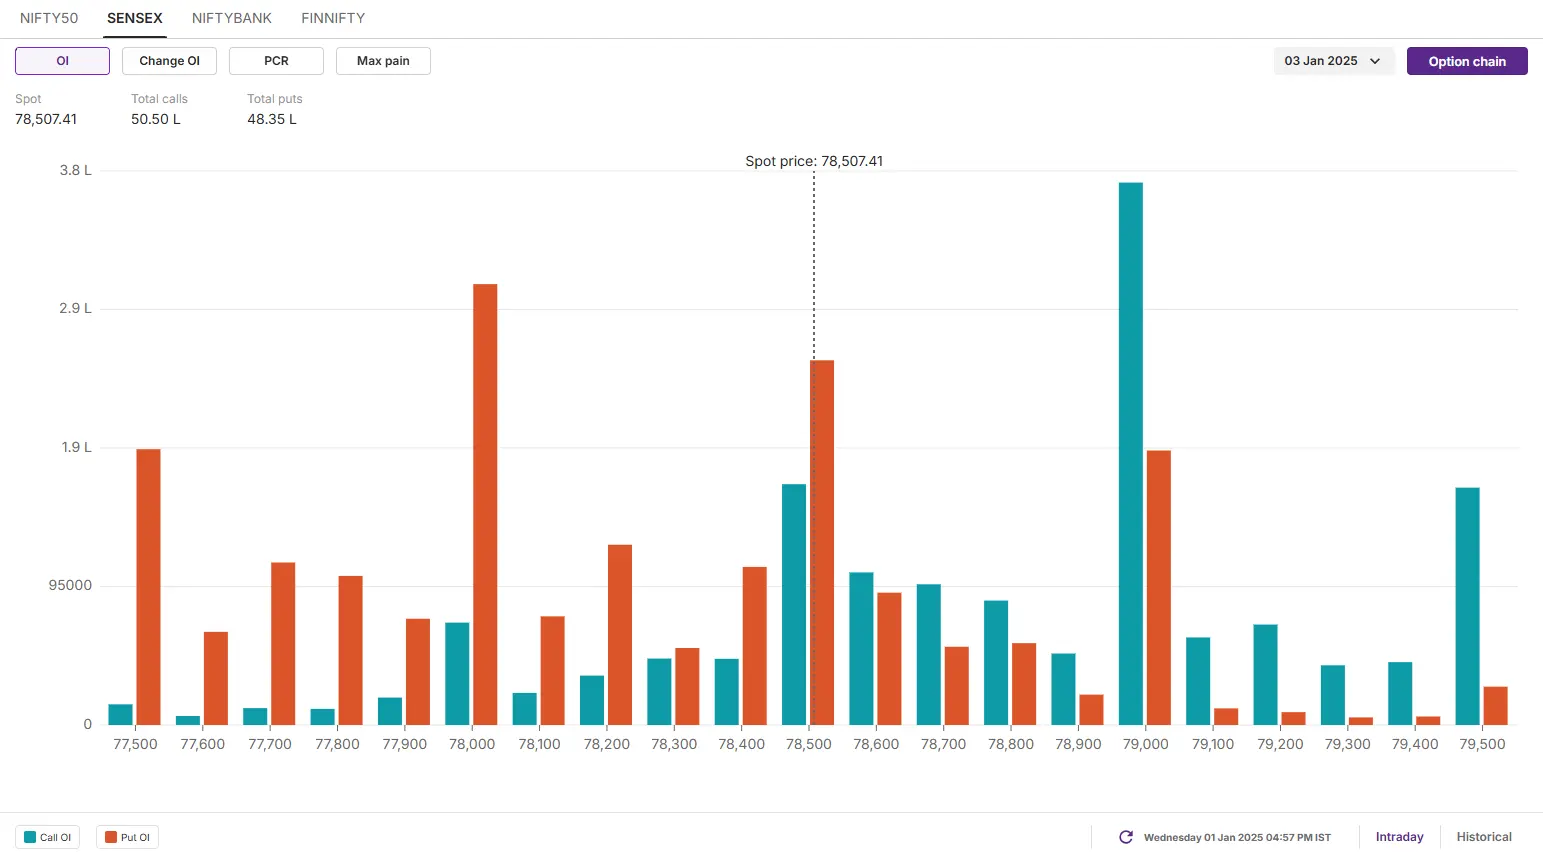
- Max call OI: 79,000
- Max put OI: 76,000
- (Expiry: 3 Jan)
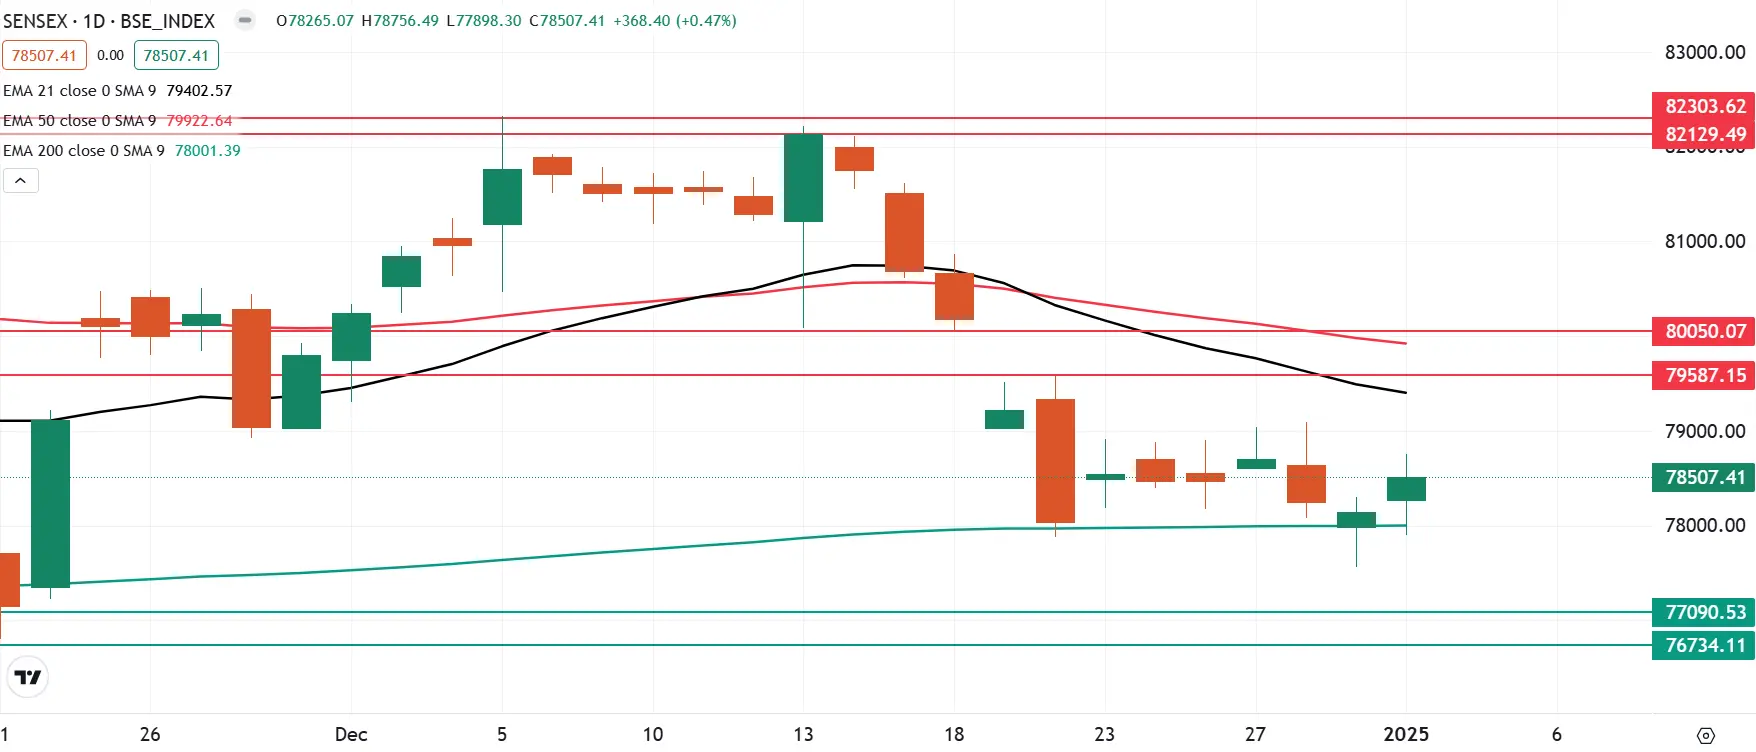
The SENSEX continued its upward momentum for the second consecutive day, closing Tuesday’s session above the prior day’s high and forming a bullish candle on the daily chart. The index found support at its 200 EMA for the second session in a row, closing higher than the previous day’s high, indicating buying interest around these levels.
On the daily chart, the trend of the index remains rangebound as it consolidates within the range of 20 December for the past seven trading sessions. Unless the index breaks this range on closing basis, the trend may remains sideways.
The open interest data for the 3 January signals significant call base at 79,000 strike, suggesting resistance for the index around this level. On the flip side, the put base was seen at 78,000 strike, indicating support for the index around this zone.
FII-DII activity
Stock scanner
- Long build-up: SJVN, IRB Infrastructure, Muthoot Finance, Coromandel International and Manappuram Finance
- Short build-up: Can Fin Homes, One 97 Communications (Paytm) and Indian Bank
- Under F&O ban: Manappuram Finance
In Futures and Options or F&O, long build-up means an increase in Open Interest (OI) along with an increase in price, and short build-up means an increase in Open Interest(OI) along with a decrease in price. Source: Upstox and NSE.
Disclaimer: Derivatives trading must be done only by traders who fully understand the risks associated with them and strictly apply risk mechanisms like stop-losses. The information is only for consumption by the client and such material should not be redistributed. We do not recommend any particular stock, securities and strategies for trading. The securities quoted are exemplary and are not recommendatory. The stock names mentioned in this article are purely for showing how to do analysis. Take your own decision before investing.
About The Author
Next Story

