Market News
Trade setup for Jan 17: Will NIFTY50 surpass the 200-day EMA or encounter resistance?
.png)
4 min read | Updated on January 17, 2025, 07:20 IST
SUMMARY
The NIFTY50 index failed to close above the high of the inverted hammer candlestick pattern formed on January 13, signalling selling pressure from the resistance zone of 23,350. Traders can closely monitor the high and the low of the reversal pattern. A close above or below these levels will provide further clues.
Stock list
The SENSEX extended its rebound for the third consecutive day, closing Thursday’s session in positive territory.
Asian markets @ 7 am
- GIFT NIFTY: 23,322.50 (-0.28%)
- Nikkei 225: 38,118.35 (-1.18%)
- Hang Seng: 19,499.10 (-0.12%)
U.S. market update
- Dow Jones: 43,153 (▼0.1%)
- S&P 500: 5,937 (▼0.2%)
- Nasdaq Composite: 19,338 (▼0.8%)
U.S. indices ended the Thursday’s session on a negative and failed to build on to previous day’s gains amid decline in technology stocks. Shares of Apple, Tesla slipped in the range of 3% to 4%, while Nvidia and Alphabet lost around 1%.
Meanwhile, the testimony of Treasury Secretary Scott Bessent in front of the Senate was also in focus. The Secretary said that the range of tariffs, including the ones promised on the campaign trail will be part of President-elect Donald Trump’s administration in the months ahead.
NIFTY50
- January Futures: 23,377(▲0.6%)
- Open interest: 5,40,034 (▼0.2%)
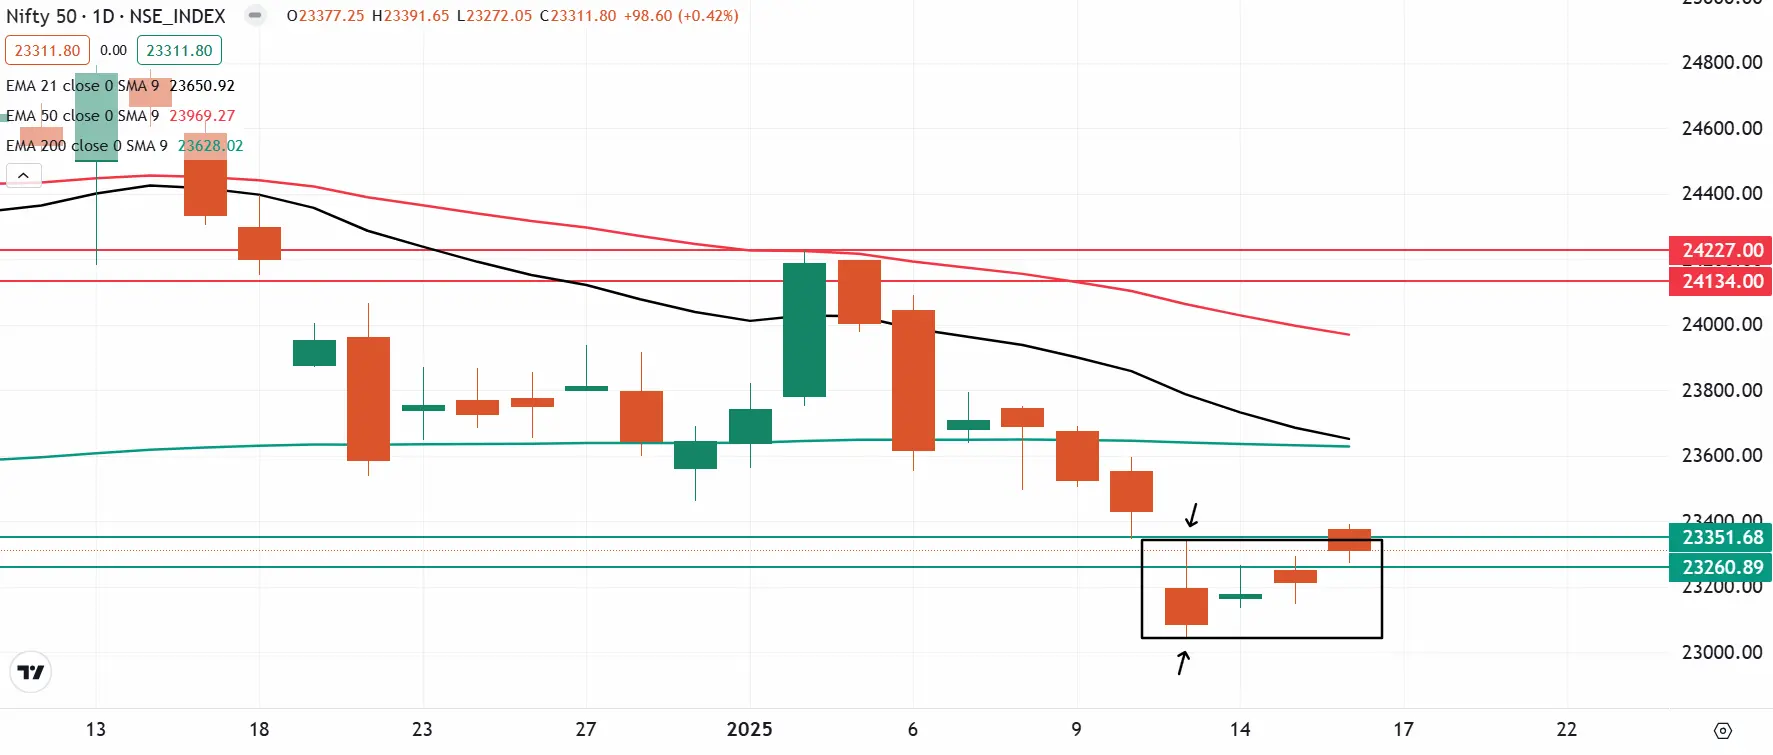
The NIFTY50 index extended the winning streak for the third day in a row and attempted to break above the resistance zone of 23,350. However, the index failed to close above the high of the inverted hammer formed on 13 January.
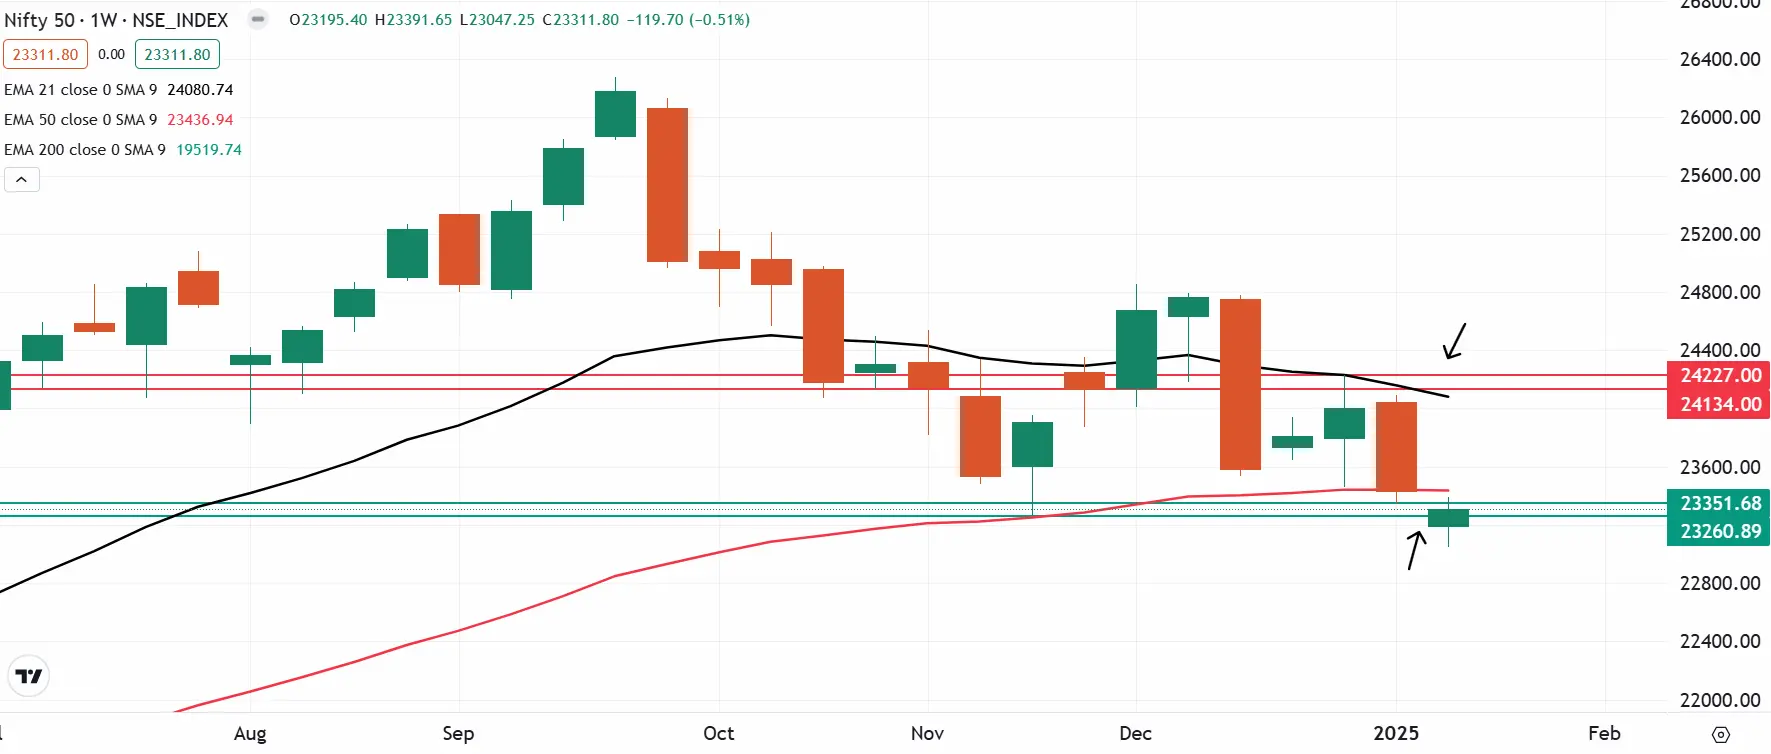
Meanwhile, the technical structure as per the weekly chart remains bearish with index trading below its weekly 21 and 50 exponential moving averages. This indicates that the broader trend of the index remains weak and the index may face resistance on rebounds. However, traders can closely monitor the weekly close. A close above 50 weekly EMA will extend the rally up to weekly 21 EMA. On the flip side, a rejection from 50 EMA will indicate weakness.
On the daily chart, traders can monitor the high and low of the inverted hammer candlestick pattern formed on 13 January. A breakout from these levels on a closing basis will provide short-term directional clues.
SENSEX
- Max call OI: 79,000
- Max put OI: 75,000
- (Expiry: 21 Jan)
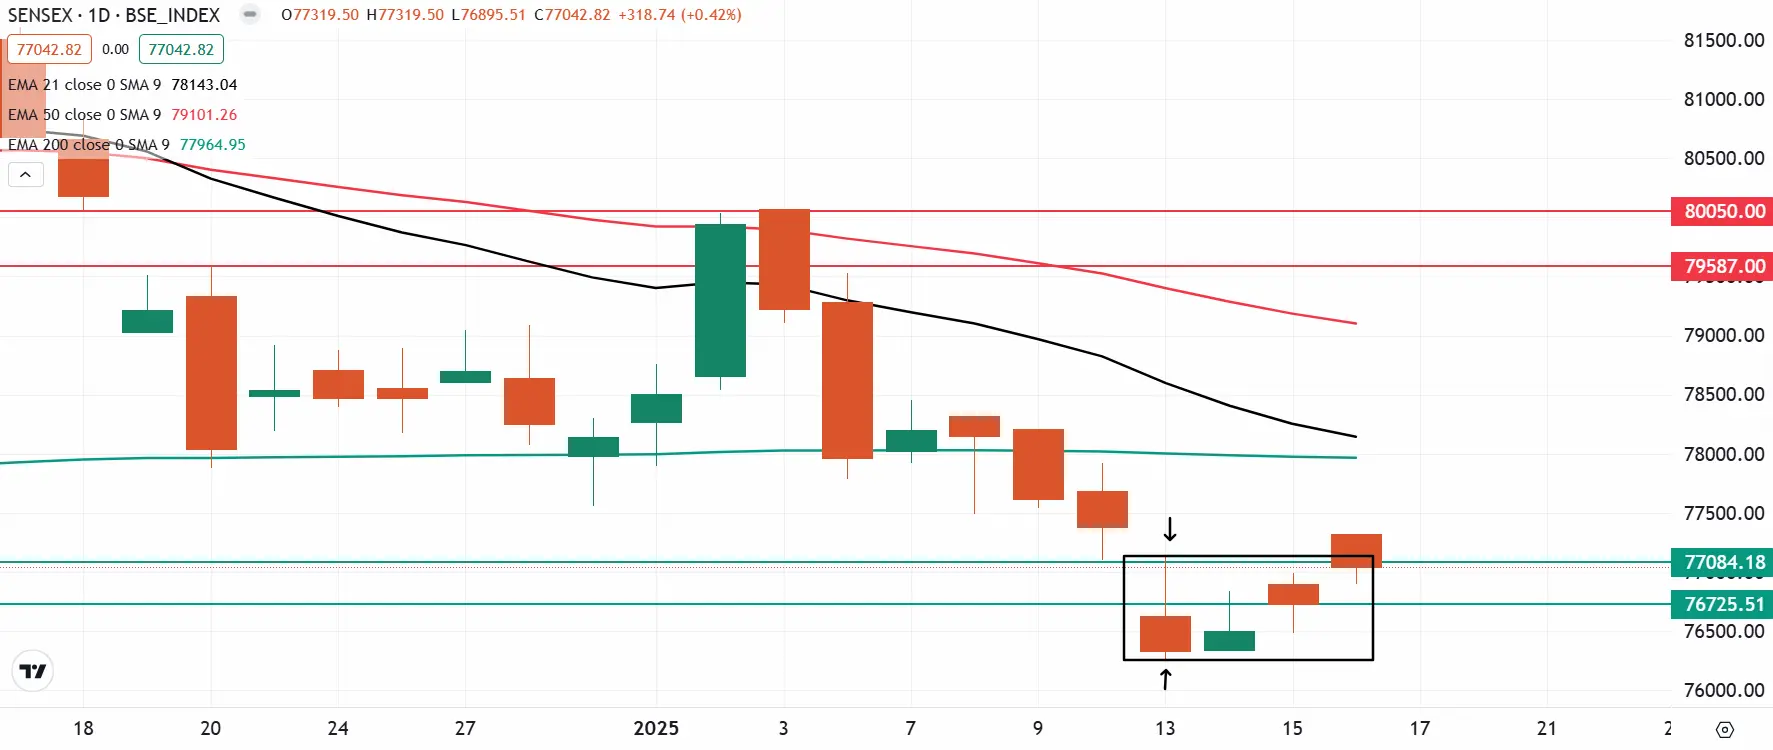
The SENSEX extended its rebound for the third consecutive day, closing Thursday’s session in positive territory. However, the index fell short of confirming the inverted hammer candlestick pattern formed on January 13, as it faced rejection at the high point of the reversal pattern.
The technical outlook for the SENSEX, based on the weekly chart, remains bearish as the index continues to trade below the weekly 20 EMA. While it managed to hold the weekly 50 EMA on a closing basis last week, it has stayed below this support level throughout the week.
Traders should closely watch this critical support, as a decisive close below it would indicate further weakness. Conversely, if the index successfully defends this level and reclaims the weekly 50 EMA, it could potentially extend its rebound toward the weekly 20 EMA.
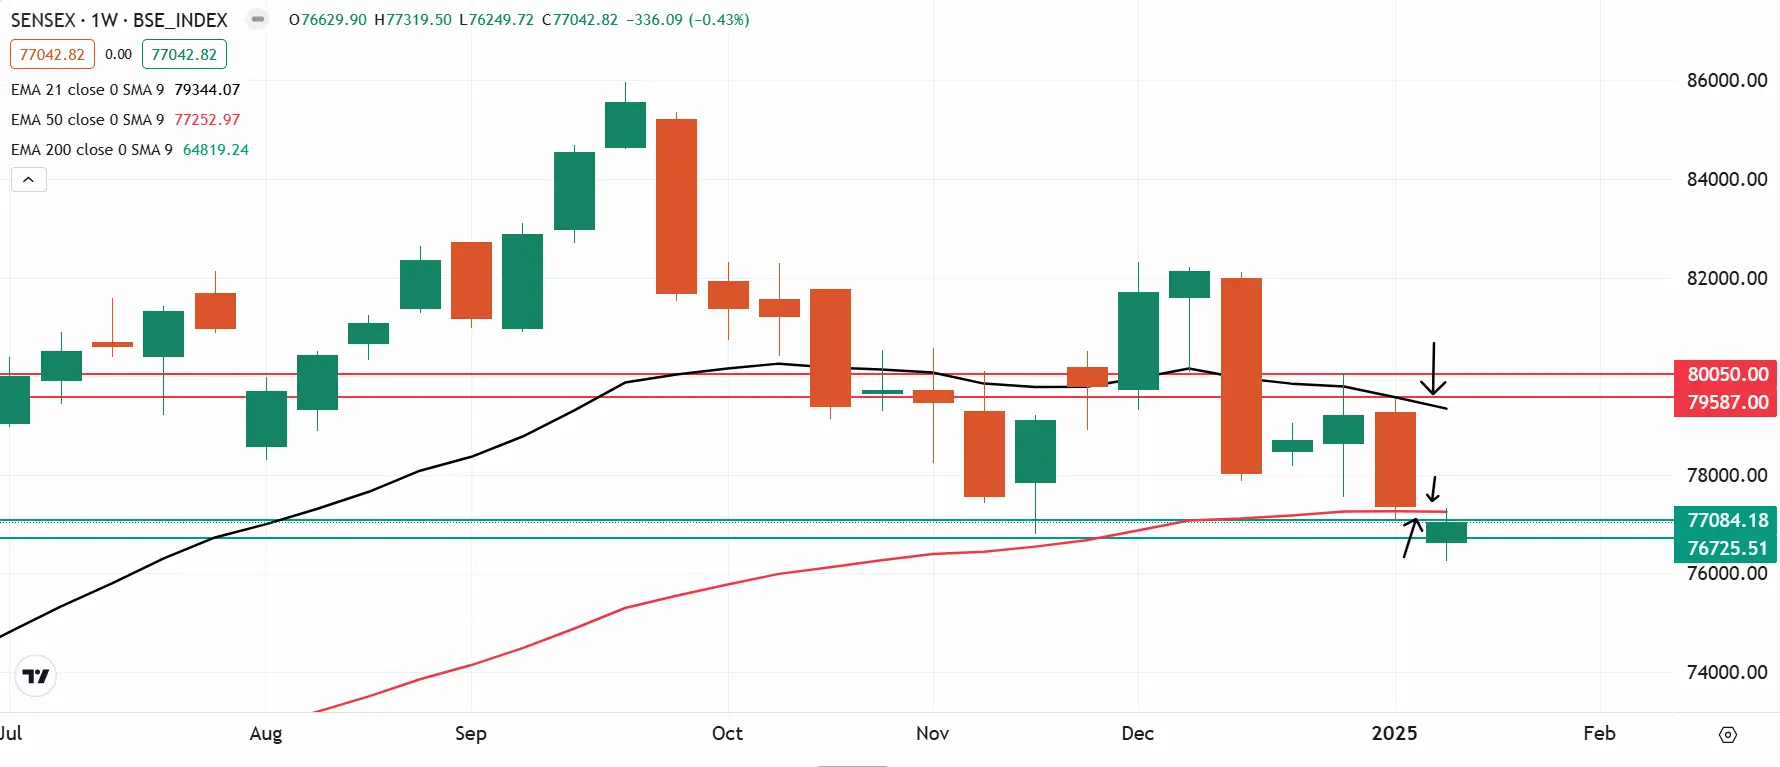
On the daily chart, traders can monitor the high and low of the inverted hammer candlestick pattern formed on 13 January. As highlighted on the chart below, a breakout of these levels will provide further short-term directional clues.
FII-DII activity
Stock scanner
- Long build-up: HDFC Life Insurance, L&T Technology Services, SBI Cards, Bank of India and Max Financial Services
- Short build-up: Dr. Reddy’s Laboratories
- Under F&O ban: Aarti Industries, Aditya Birla Fashion and Retail, Angel One, Bandhan Bank, Kalyan Jewellers, Hindustan Copper, Manappuram Finance, L&T Finance and RBL Bank
- Out of F&O ban: NIL
In Futures and Options or F&O, long build-up means an increase in Open Interest (OI) along with an increase in price, and short build-up means an increase in Open Interest(OI) along with a decrease in price.
Source: Upstox and NSE.
Disclaimer: Derivatives trading must be done only by traders who fully understand the risks associated with them and strictly apply risk mechanisms like stop-losses. The information is only for consumption by the client and such material should not be redistributed. We do not recommend any particular stock, securities and strategies for trading. The securities quoted are exemplary and are not recommendatory. The stock names mentioned in this article are purely for showing how to do analysis. Take your own decision before investing.
About The Author
Next Story

