Market News
Trade setup for Jan 16: NIFTY50 forms second inside candle, 23,000 remains crucial support
.png)
4 min read | Updated on January 16, 2025, 07:18 IST
SUMMARY
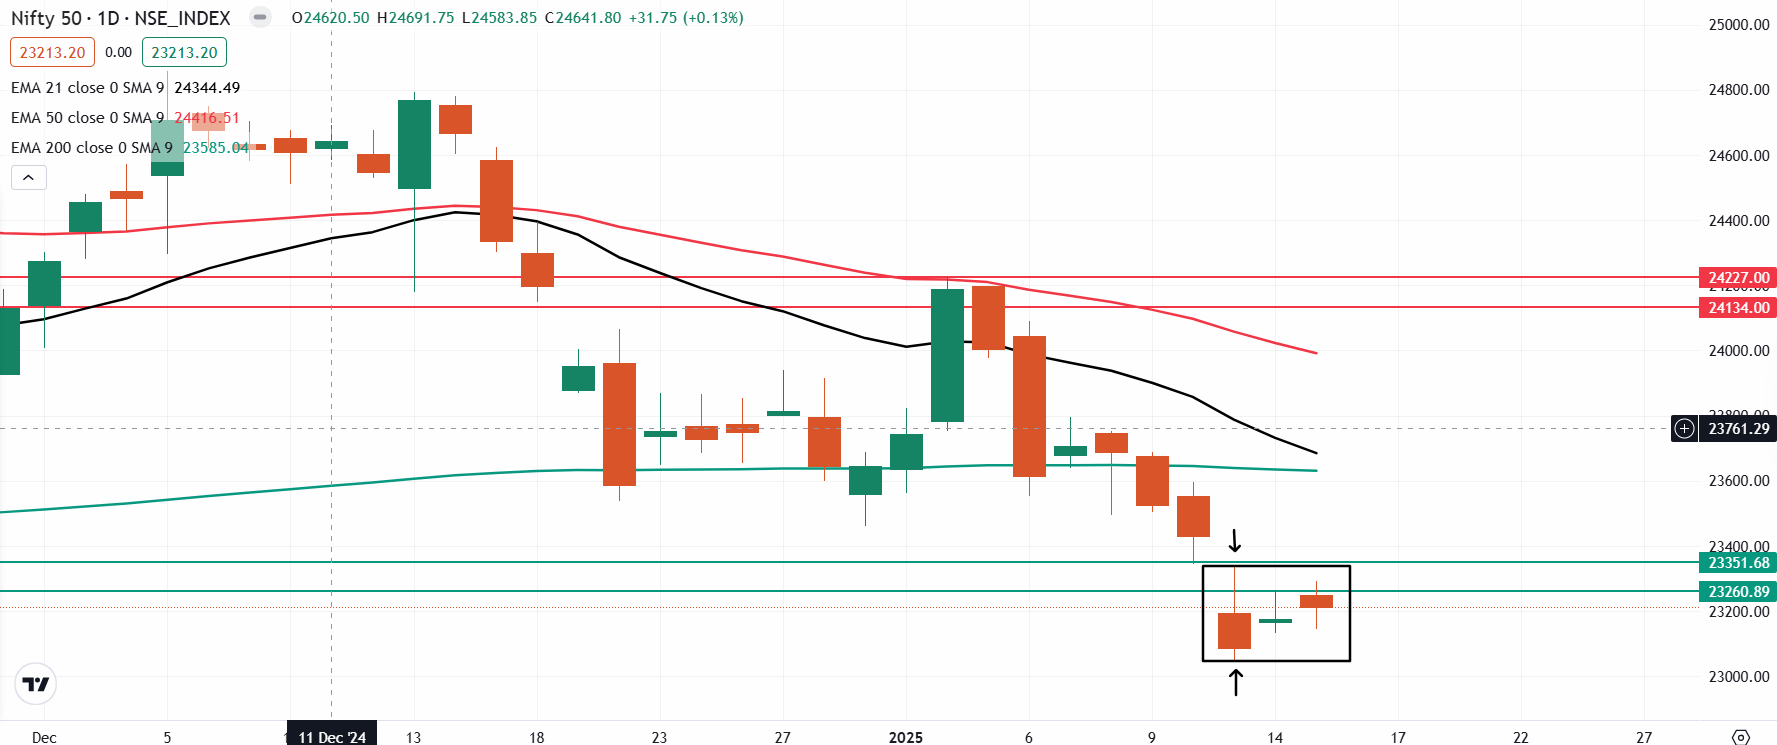
The NIFTY50 index formed a second inside candle on the daily chart, continuing its consolidation around 23,200 for the second consecutive session. Traders can watch the high and low of the January 13 candle for short-term signals, as a decisive close above or below these levels may offer further direction.
Stock list
The NIFTY50 index extended its upward climb on January 15 and ended the day with moderate gains.
Asian markets @ 7 am
- GIFT NIFTY: 23,410 (+0.62%)
- Nikkei 225: 38,621 (+0.46%)
- Hang Seng: 19,454 (+0.88%)
U.S. market update
- Dow Jones: 43,221 (▲1.6%)
- S&P 500: 5,949 (▲1.8%)
- Nasdaq Composite: 19,511 (▲2.4%)
U.S. indices rallied on Wednesday as the consumer inflation data showed that key prices rose less than expected in December. The Consumer Price Index rose 2.9% year-on-year, in line with street estimates. Moreover, the core CPI, which strips out volatile food and energy prices, came in at 3.2%, slightly better than estimates of 3.3%.
Wall Street was also cheered the better-than-expected third-quarter earnings of banks. Investment banking and trading revenues contributed to the well-received results from JPMorgan Chase, Goldman Sachs, Citigroup and Wells Fargo.
NIFTY50
- January Futures: 23,265 (▲0.0%)
- Open interest: 5,41,452 (▼1.5%)
The NIFTY50 index extended its upward climb on January 15 and ended the day with moderate gains. The index formed a second consecutive inside candle on the daily chart, signalling consolidation around the 23,200 zone.
As per the daily chart, the broader trend of the index remains weak with immediate resistance around 23,700 zone, which coincides with its 200- day exponential moving average (EMA). Meanwhile, positional traders can monitor the high and low of the inverted hammer formed on 13 January. A close above or below the high and low of the reversal pattern will provide further directional clues.
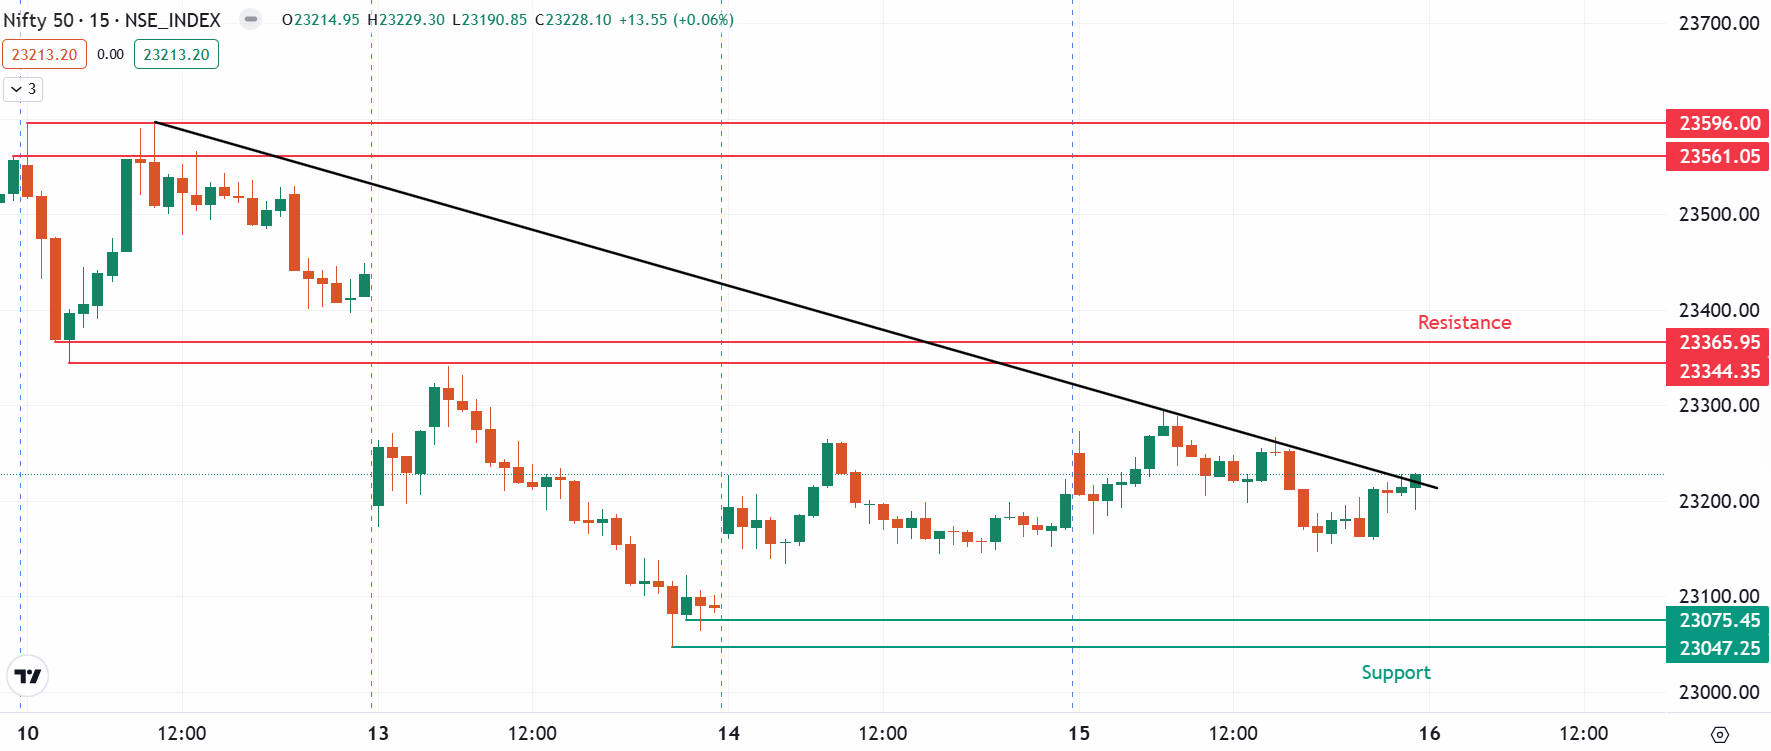
On the 15-minute chart, traders can monitor the resistance zone of 23,350 and a downward sloping trendline. A close above the resistance zone on a 15 minute chart with a strong candle, will signal the momentum extending towards the resistance zone of 23,500. On the flip side, the immediate support is visible around the 23,000 zone.
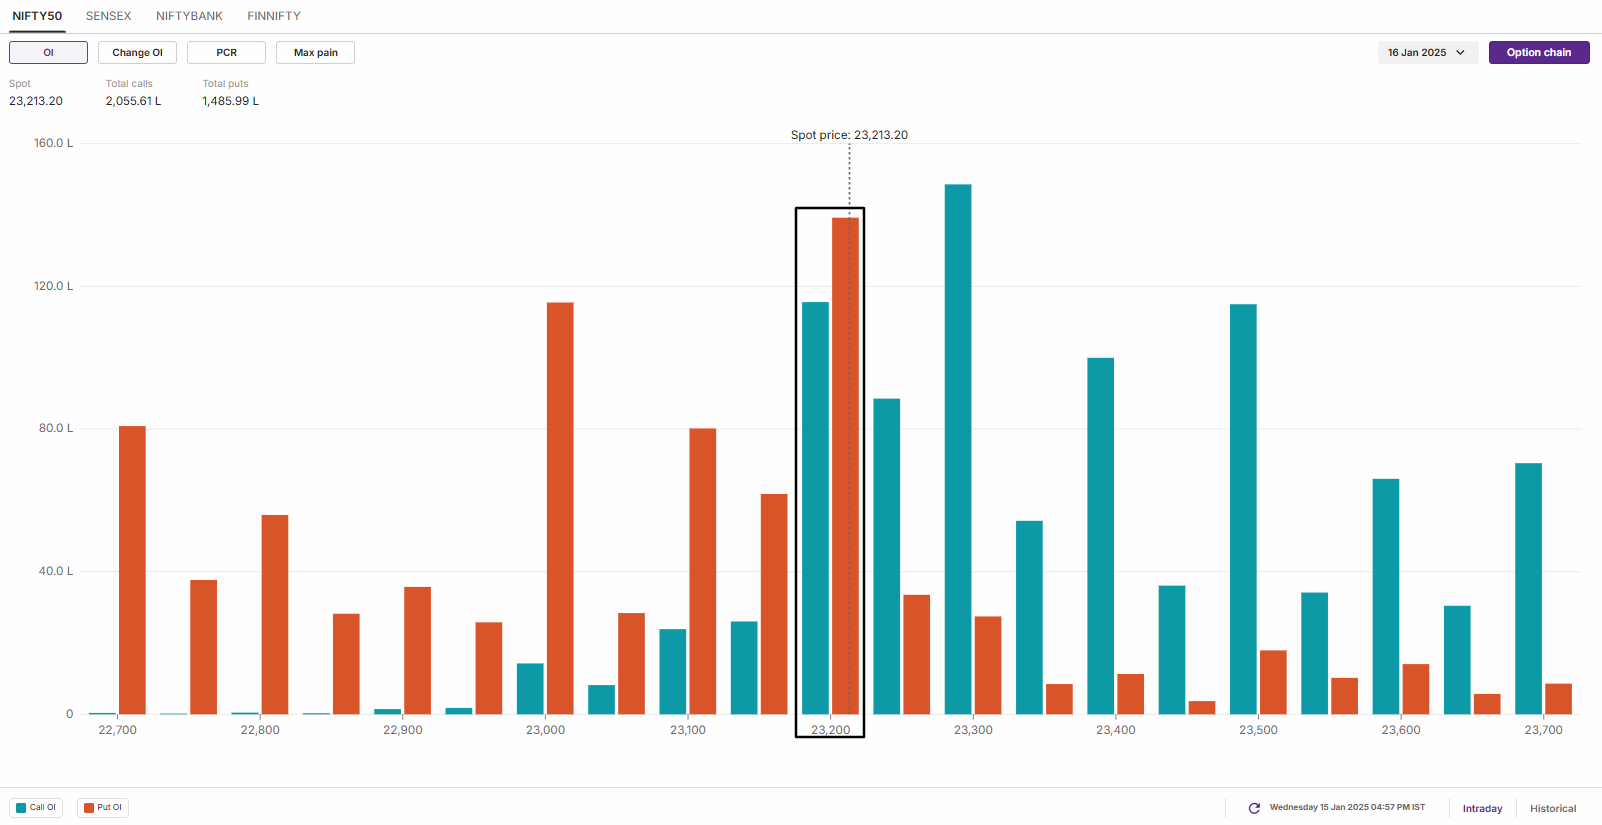
The open interest data for the today’s expiry saw significant call and put base at 23,200 strike, signalling consolidation around this zone. Meanwhile, a substantial call and put base was also established at 23,300 and 23,000 strikes, signalling resistance and support around these levels.
SENSEX
- Max call OI: 79,000
- Max put OI: 76,500
- (Expiry: 21 Jan)
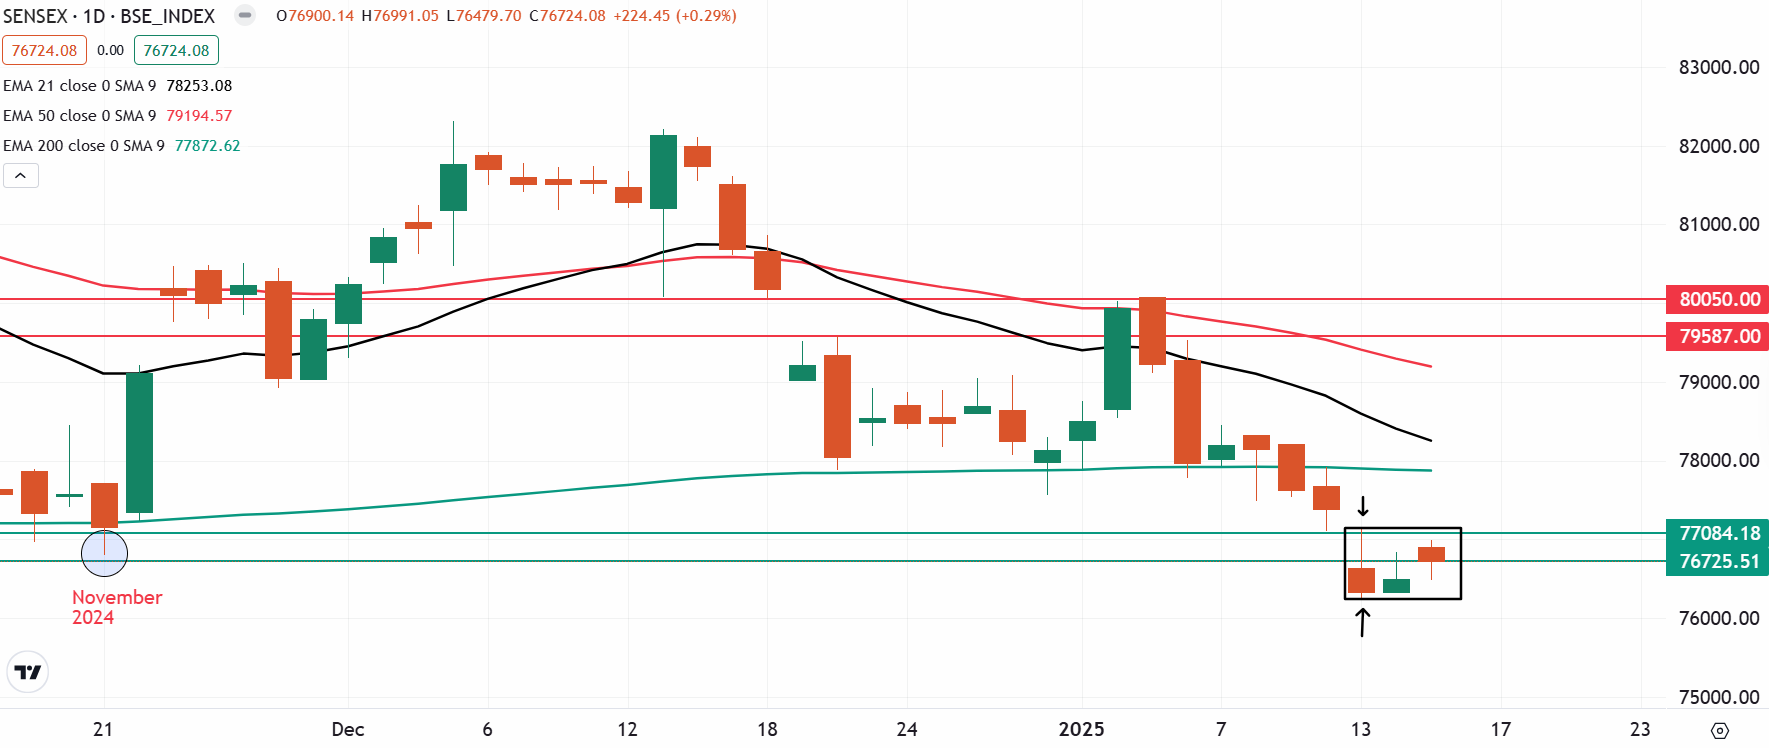
The SENSEX also extended its range-bound movement for the second day in a row and consolidated within the range of 13 January. The index formed an inverted hammer candlestick pattern on 13 January and has formed a second inside candle.
The technical structure of the index as per the daily chart remains weak with immediate resistance around the 78,000 mark. The zone also coincides with the 200-day EMA of the index. However, traders should also closely monitor the high and the low of inverted hammer. A close above the high or below the low of the reversal pattern will provide further directional clues.
FII-DII activity
Stock scanner
- Long build-up: Persistent Systems, BSE, MCX, Indian Hotels and APL Apollo Tubes
- Short build-up: Kalyan Jewellers, Max Healthcare, Macrotech Developers, CG Power and Oracle Financial Services Software
- Under F&O ban: Aarti Industries, Aditya Birla Fashion and Retail, Angel One, Bandhan Bank, Kalyan Jewellers, Hindustan Copper, Manappuram Finance, L&T Finance and RBL Bank
- Added under F&O ban: Aditya Birla Fashion and Retail, Manappuram Finance and Kalyan Jewellers Out of F&O ban: NIL
In Futures and Options or F&O, long build-up means an increase in Open Interest (OI) along with an increase in price, and short build-up means an increase in Open Interest(OI) along with a decrease in price.
Source: Upstox and NSE.
Disclaimer: Derivatives trading must be done only by traders who fully understand the risks associated with them and strictly apply risk mechanisms like stop-losses. The information is only for consumption by the client and such material should not be redistributed. We do not recommend any particular stock, securities and strategies for trading. The securities quoted are exemplary and are not recommendatory. The stock names mentioned in this article are purely for showing how to do analysis. Take your own decision before investing.
About The Author
Next Story
