Market News
Trade setup for Feb 18: NIFTY50 defends January lows, rebounds to snap eight-day losing streak
.png)
4 min read | Updated on February 18, 2025, 07:22 IST


SUMMARY
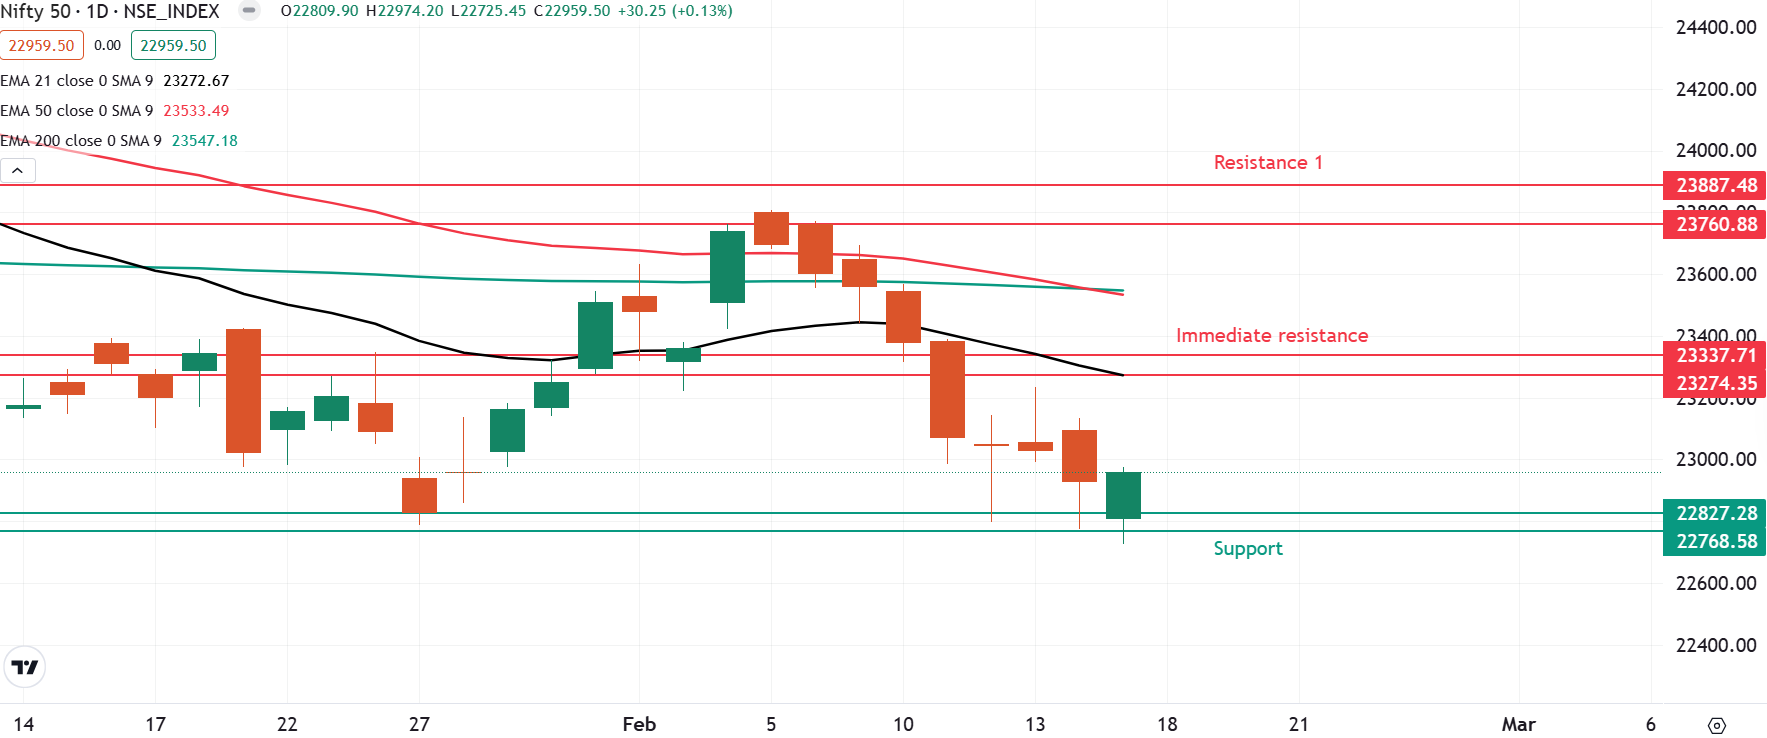
The NIFTY50 index defended the critical 22,700 support level for the third consecutive session on a closing basis. This 22,700-22,800 zone, which also aligns with January’s low, suggests the presence of fresh buying interest at this level. However, a decisive close below this range could trigger further weakness. On the upside, resistance remains at 23,350.
Stock list
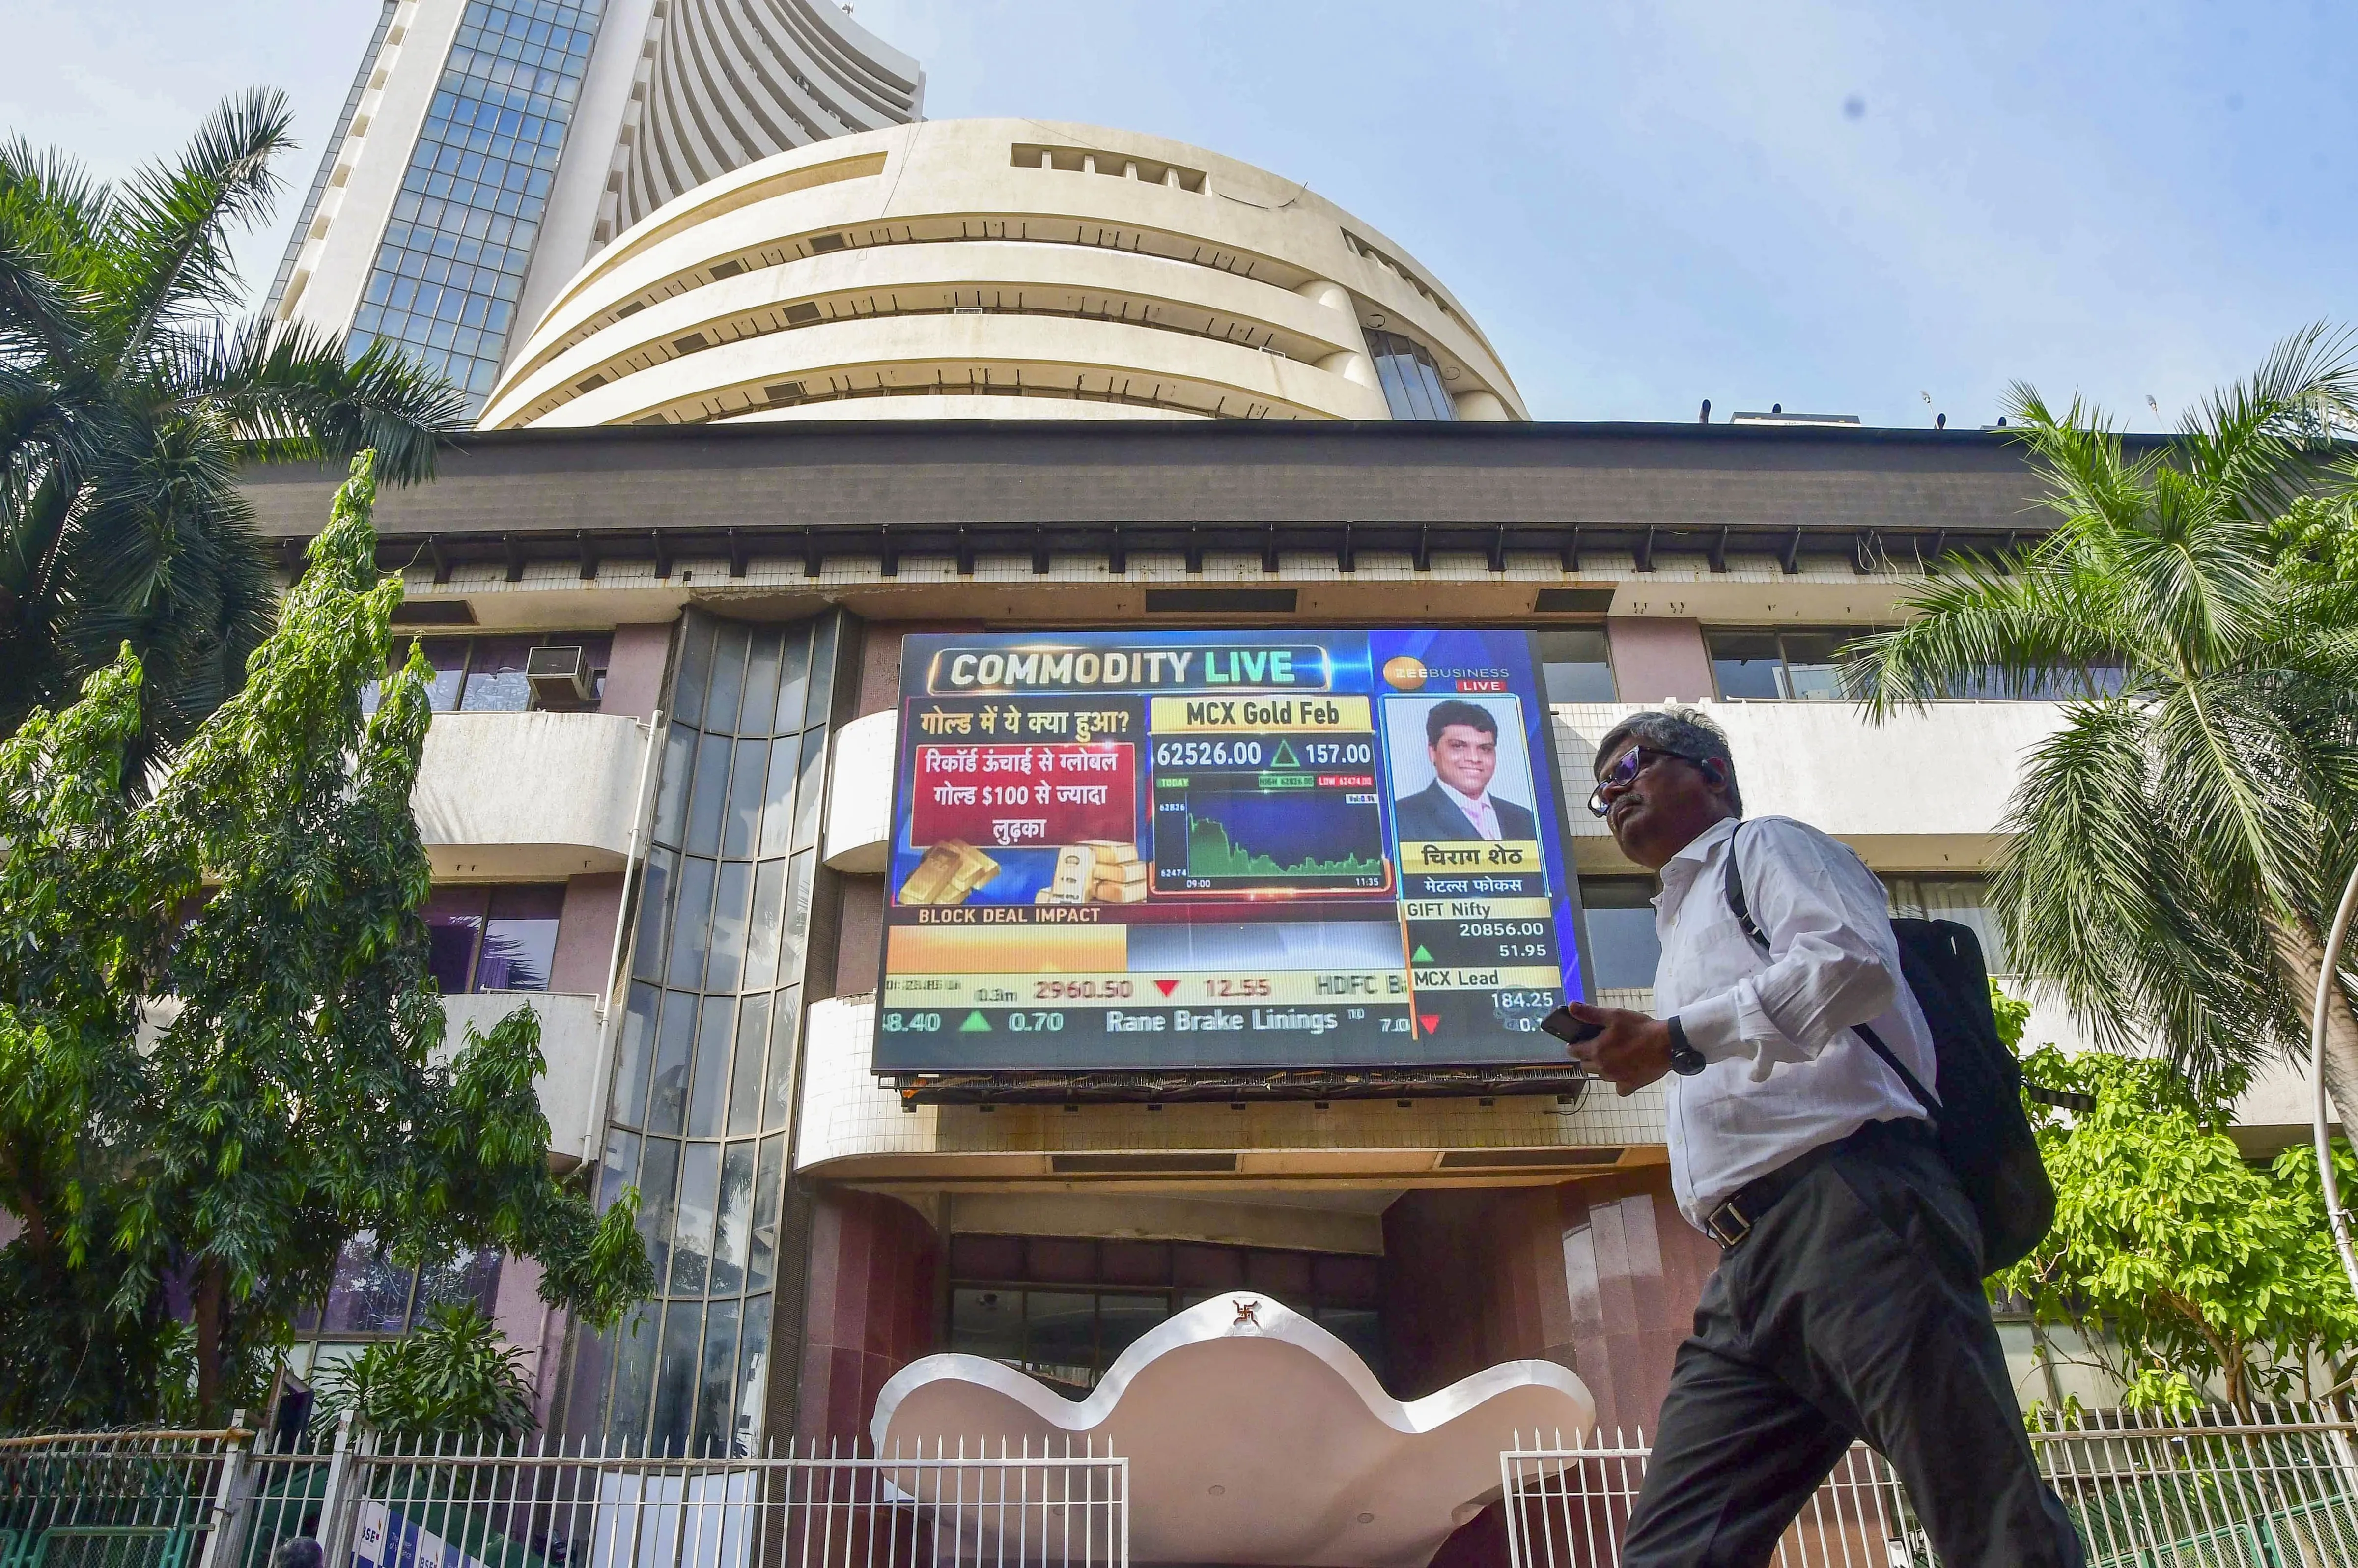
The NIFTY50 index broke its eight-day losing streak, closing in the green on February 17. | Image: PTI
Asian markets @ 7 am
- GIFT NIFTY: 22,996 (-0.06%)
- Nikkei 225: 39,313 (+0.36%)
- Hang Seng: 22,717 (+0.45%)
U.S. market update
U.S. equity and bond markets were closed on February 17th on account of President’s day to honour George Washington’s birthday.
NIFTY50
- February Futures: 23,026 (▲0.2%)
- Open interest: 2,29,244 (▼1.1%)
The NIFTY50 index broke its eight-day losing streak, closing in the green on February 17. Despite a gap-down opening, it rebounded from the critical 22,700 support zone, forming a hammer candlestick pattern on the daily chart, albeit not a classic one.
A hammer is a bullish reversal candlestick pattern that appears after a downtrend. It features a small body with a long lower shadow, indicating that buyers have stepped in to push the price up after a significant decline, signalling a potential price reversal if the close of the subsequent candle is above the high of the reversal pattern.
Meanwhile, the daily chart shows that the index defended the crucial January low of 22,700 for the third time, signaling the emergence of fresh buyers at this key support level. On the upside, resistance remains strong around the 23,300 zone.
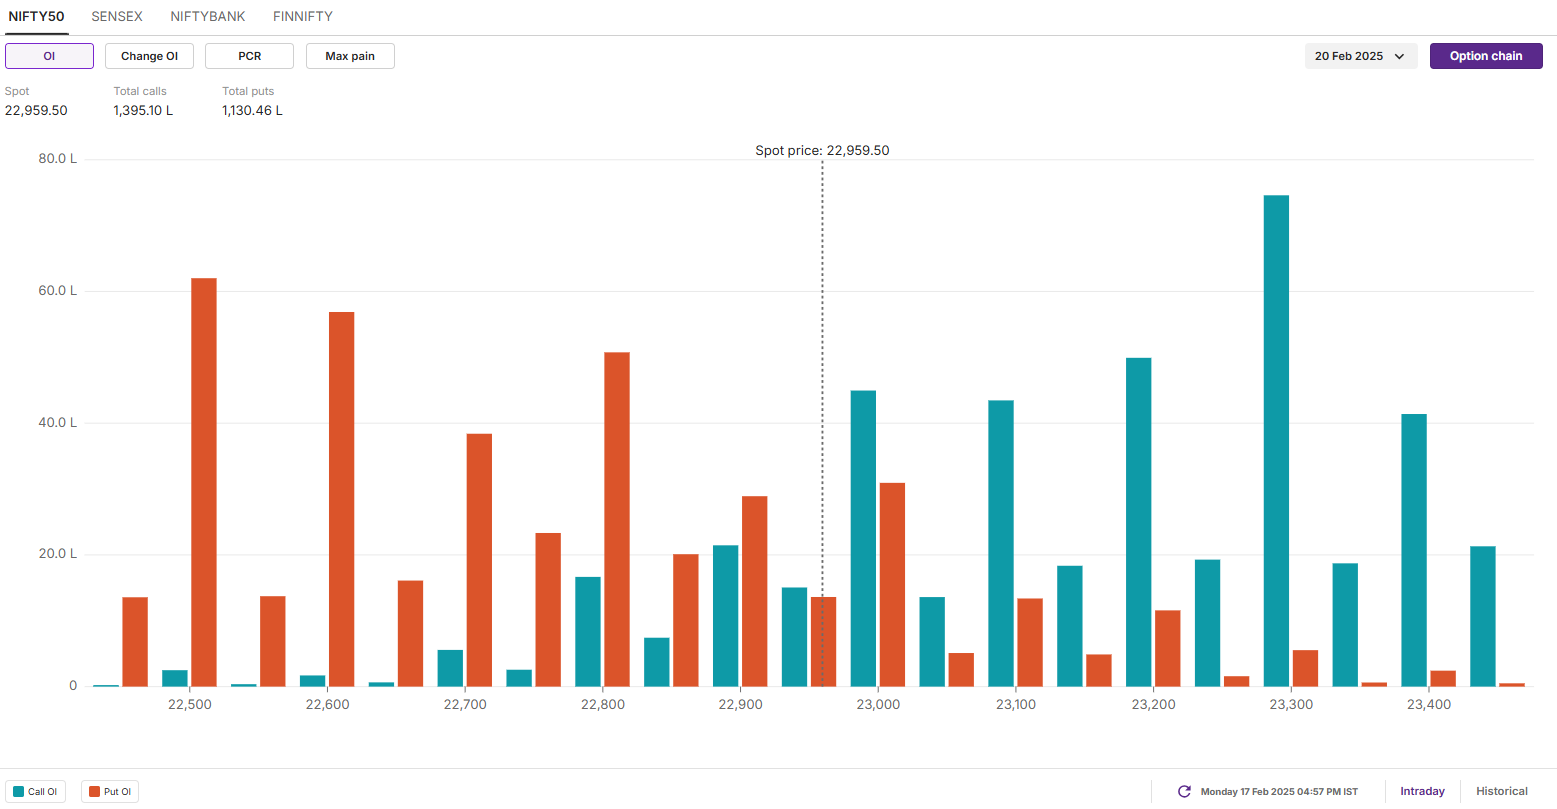
The open interest data for the 20 February saw significant call options build-up at 23,300 strike, suggesting resistance for the index around this zone. On the flip side, the put base was seen at 22,500 strike, pointing at support for the index around this zone.
SENSEX
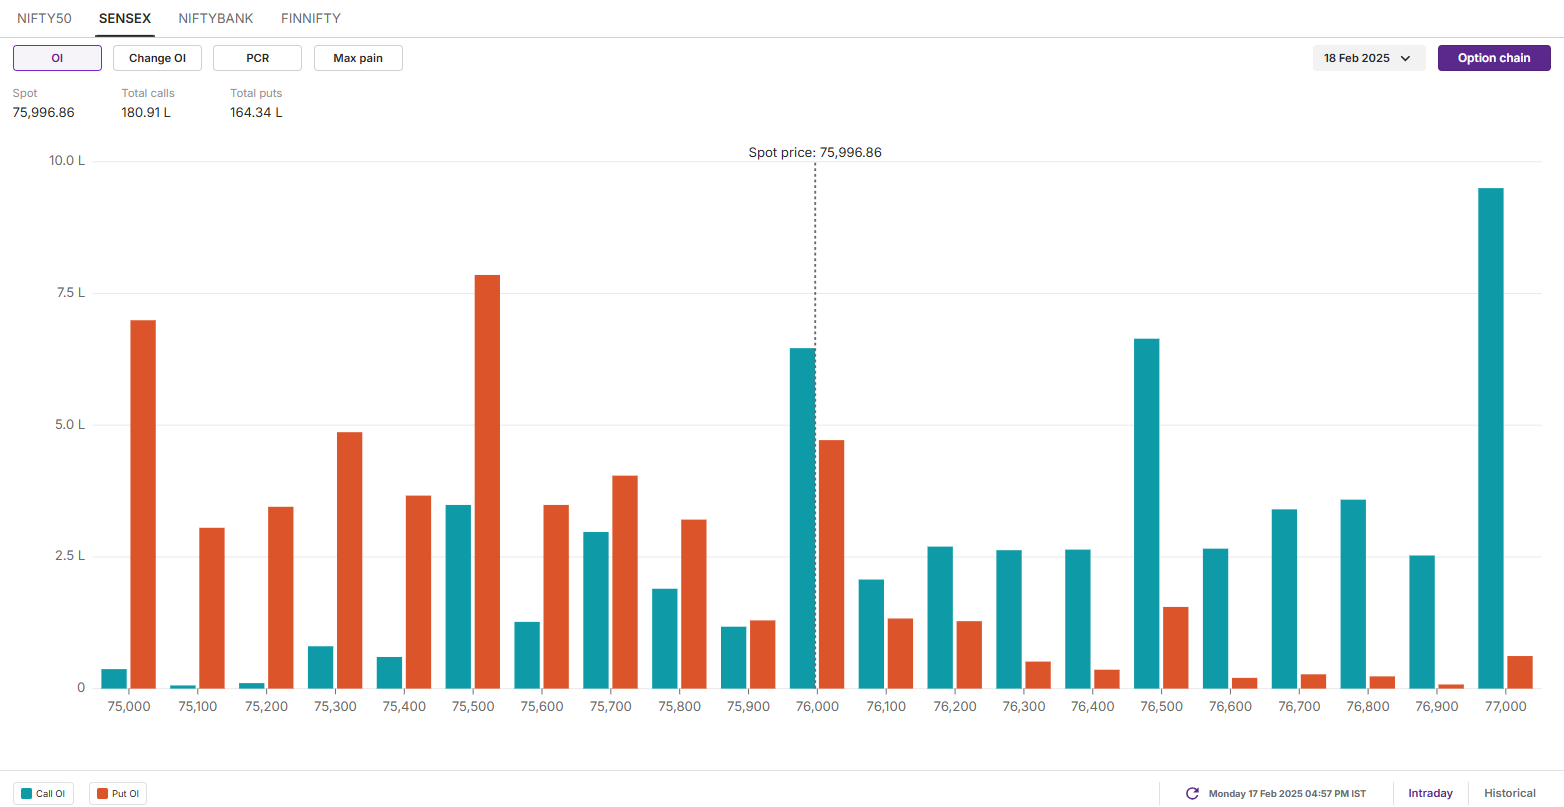
- Max call OI: 77,000
- Max put OI: 75,500
- (20 Strikes from ATM, Expiry: 18 Feb)
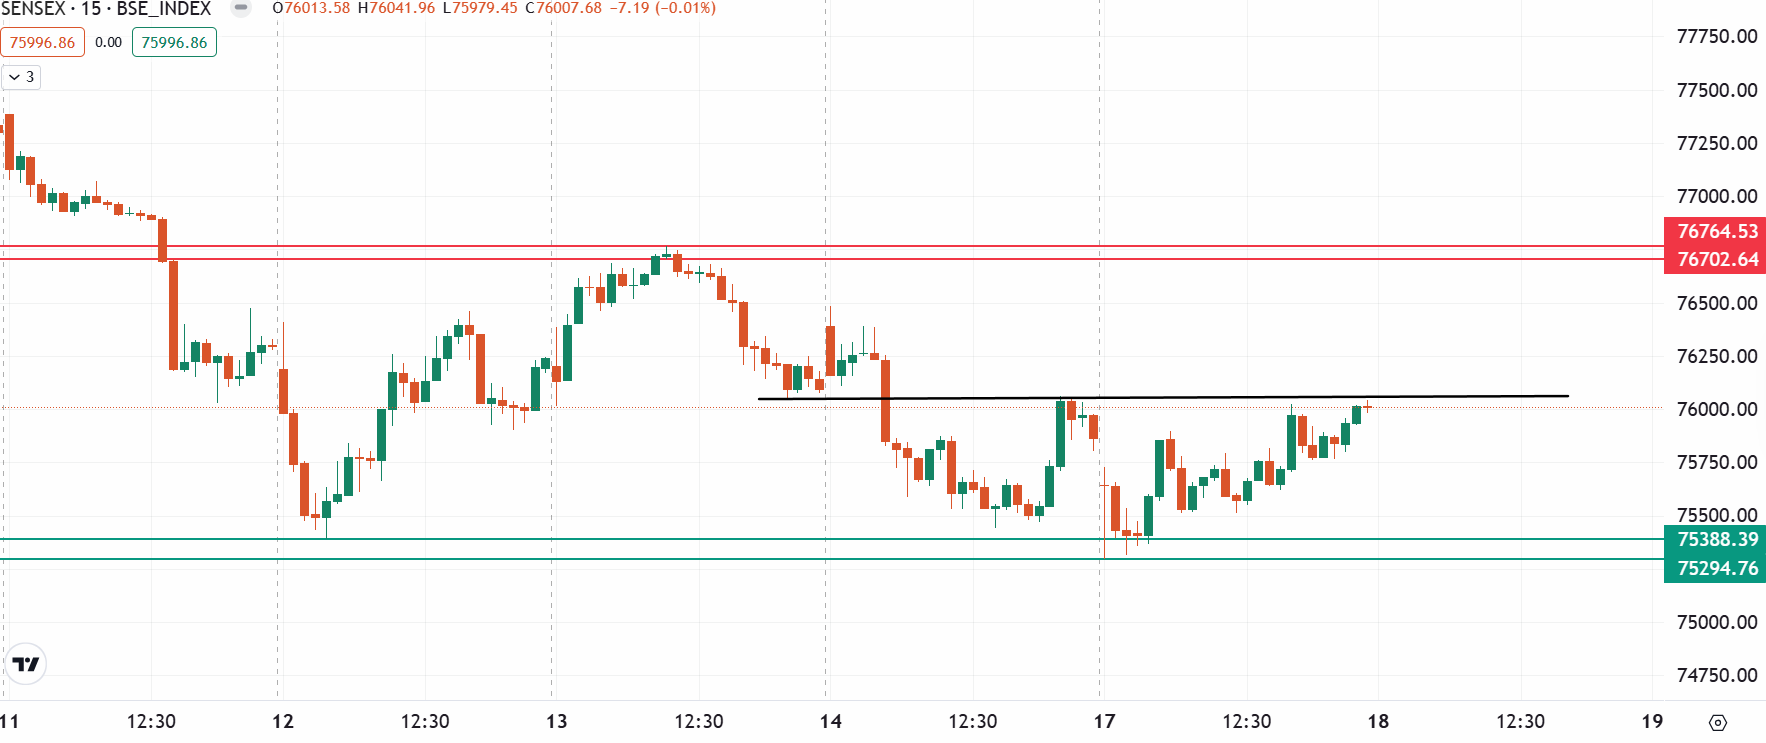
The SENSEX staged a sharp recovery of over 700 points from the day's low, closing moderately higher on February 17—a first positive close after eighth consecutive losses. However, the overall sentiment remains bearish. The index continues to trade below all key exponential moving averages and maintains a lower highs-lower lows structure.
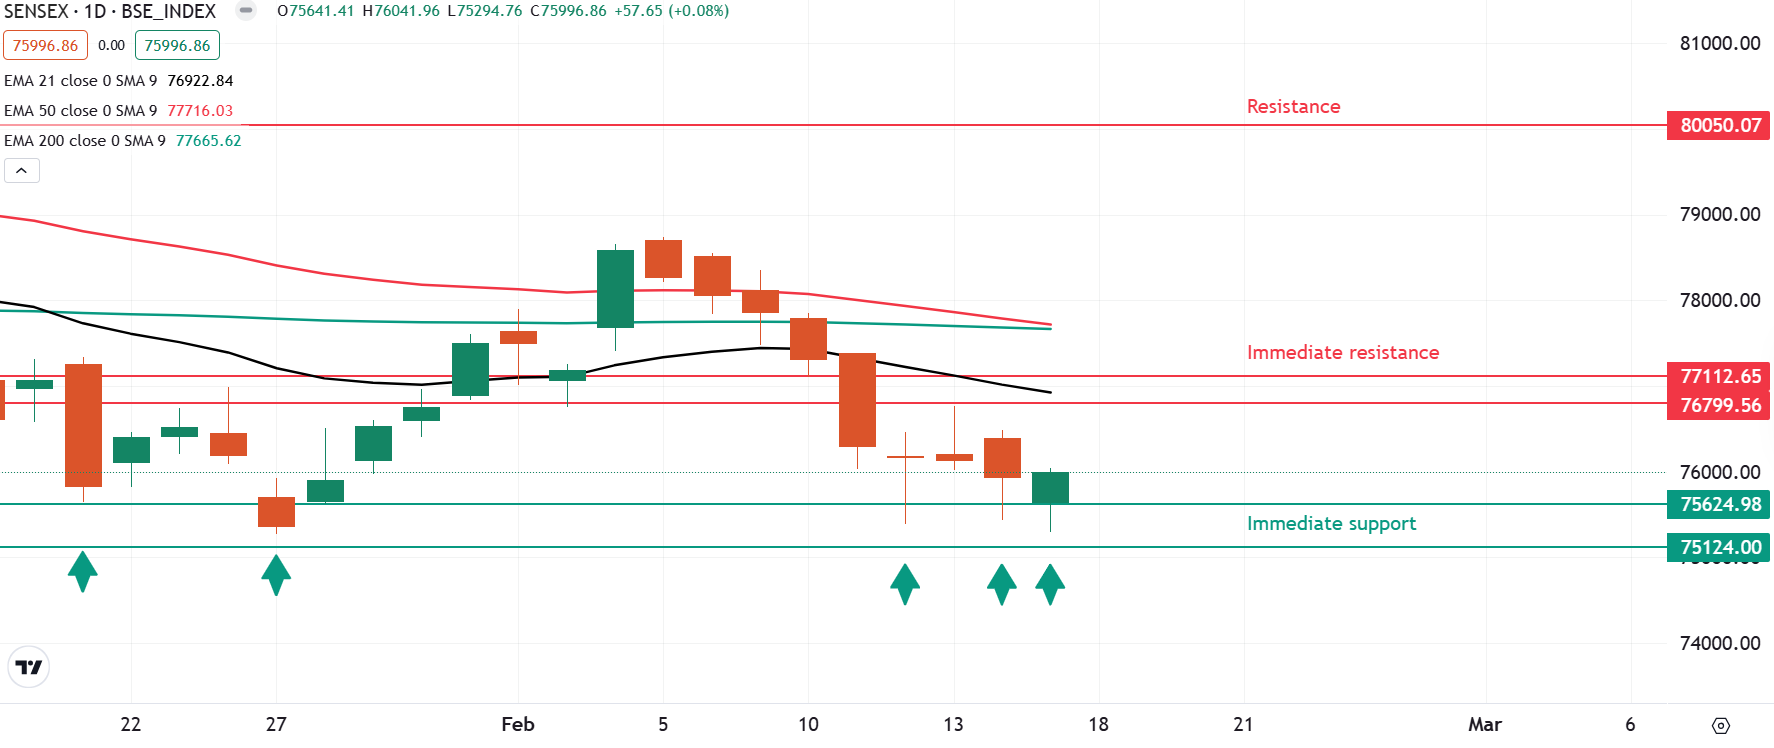
As per the 15-minute chart, the index is currently consolidating between 76,700 and 75,200 zone. Unless the index breaks this range with a strong candle, the trend may remain range-bound. Additionally, for short-term clues, traders can monitor the immediate resistance zone of 76,000 and 75,200. A break of this range may provide direcetional clues.
The open interest data for today’s expiry saw significant call build-up at 77,700 and 76,500 strikes, suggesting resistance for the index around this zone. On the other hand, the put base was seen at 75,500 and 75,000 strikes, hinting at support for the index around these levels.
FII-DII activity
Stock scanner
- Long build-up: Ashok Leyland, Manappuram Finance, Bajaj Finserv, Chambal Fertilisers and Jubilant FoodWorks
- Short build-up: PB Fintech, Varun Beverages, Siemens and JSW Energy
- Top traded futures contracts: HDFC Bank, ICICI Bank, Mahindra & Mahindra, Bharti Airtel and Manappuram Finance
- Top traded options contracts: Mahindra & Mahindra 2800 PE, Bajaj Finance 8500 CE, Bajaj Finance 8400 CE, Mahindra & Mahindra 2800 CE and HDFC Bank 1700 CE
- Under F&O ban: Manappuram Financ and Deepak Nitrite
In Futures and Options or F&O, long build-up means an increase in Open Interest (OI) along with an increase in price, and short build-up means an increase in Open Interest(OI) along with a decrease in price.
Source: Upstox and NSE.
Disclaimer: Derivatives trading must be done only by traders who fully understand the risks associated with them and strictly apply risk mechanisms like stop-losses. The information is only for consumption by the client and such material should not be redistributed. We do not recommend any particular stock, securities and strategies for trading. The securities quoted are exemplary and are not recommendatory. The stock names mentioned in this article are purely for showing how to do analysis. Take your own decision before investing.
About The Author
Next Story


