Market News
Trade setup for Feb 11: NIFTY50 ends below 21 EMA on Trump tariff jitters
.png)
4 min read | Updated on February 11, 2025, 07:22 IST


SUMMARY
The NIFTY50 fell below its 21-day exponential moving average and remained under pressure on February 10th. The sharp fall in the index came after U.S. President Donald Trump said he would impose new tariffs on all steel and aluminium imports into the U.S, which dampened investor sentiment.
Stock list

Markets ended in the red on Monday as investor sentiment took a hit following U.S. President Donald Trump's fresh tariff threats on steel, aluminium and other imports. | Image: Shutterstock
Asian markets @ 7 am
- GIFT NIFTY: 23,484.5 (+0.23%)
- Nikkei 225: Closed
- Hang Seng: 21,656 (+0.63%)
U.S. market update
- Dow Jones: 44,470 (▲0.3%)
- S&P 500: 6,066 (▲0.6%)
- Nasdaq Composite: 19,714 (▲0.9%)
U.S. indices closed higher on Monday as investors weighed President Donald Trump's proposed tariffs on steel and aluminum imports. Despite initial concerns, markets remained resilient, focusing on upcoming policy developments and economic data.
However, uncertainty lingers as traders brace for Trump's expected announcement of reciprocal tariffs on all trading partners. Investors worry that escalating trade tensions could fuel inflation, potentially delaying interest rate cuts. This week's key economic indicators, including the January Consumer Price Index (CPI) on Wednesday and retail sales data, will be closely monitored for further market direction.
NIFTY50
- February Futures: 23,459 (▼0.6%)
- Open interest: 2,28,013 (▼0.6%)
Markets ended in the red on Monday as investor sentiment took a hit following U.S. President Donald Trump's fresh tariff threats on steel, aluminium and other imports. Following the reports, the NIFTY50 index opened on a weak note and faced sustained selling pressure throughout the session. Meanwhile, market volatility spiked with the India VIX jumping 5.55% to 14.45, signalling heightened investor uncertainty.
On the daily chart, the index slipped below the crucial support of the 21-day exponential moving average (EMA), erasing all its gains from the budget week. This signals continued weakness in market breadth, with the index facing strong resistance near the 23,800 zone. Meanwhile, immediate support lies around the 23,200 level, and a close below this threshold could indicate further downside pressure.
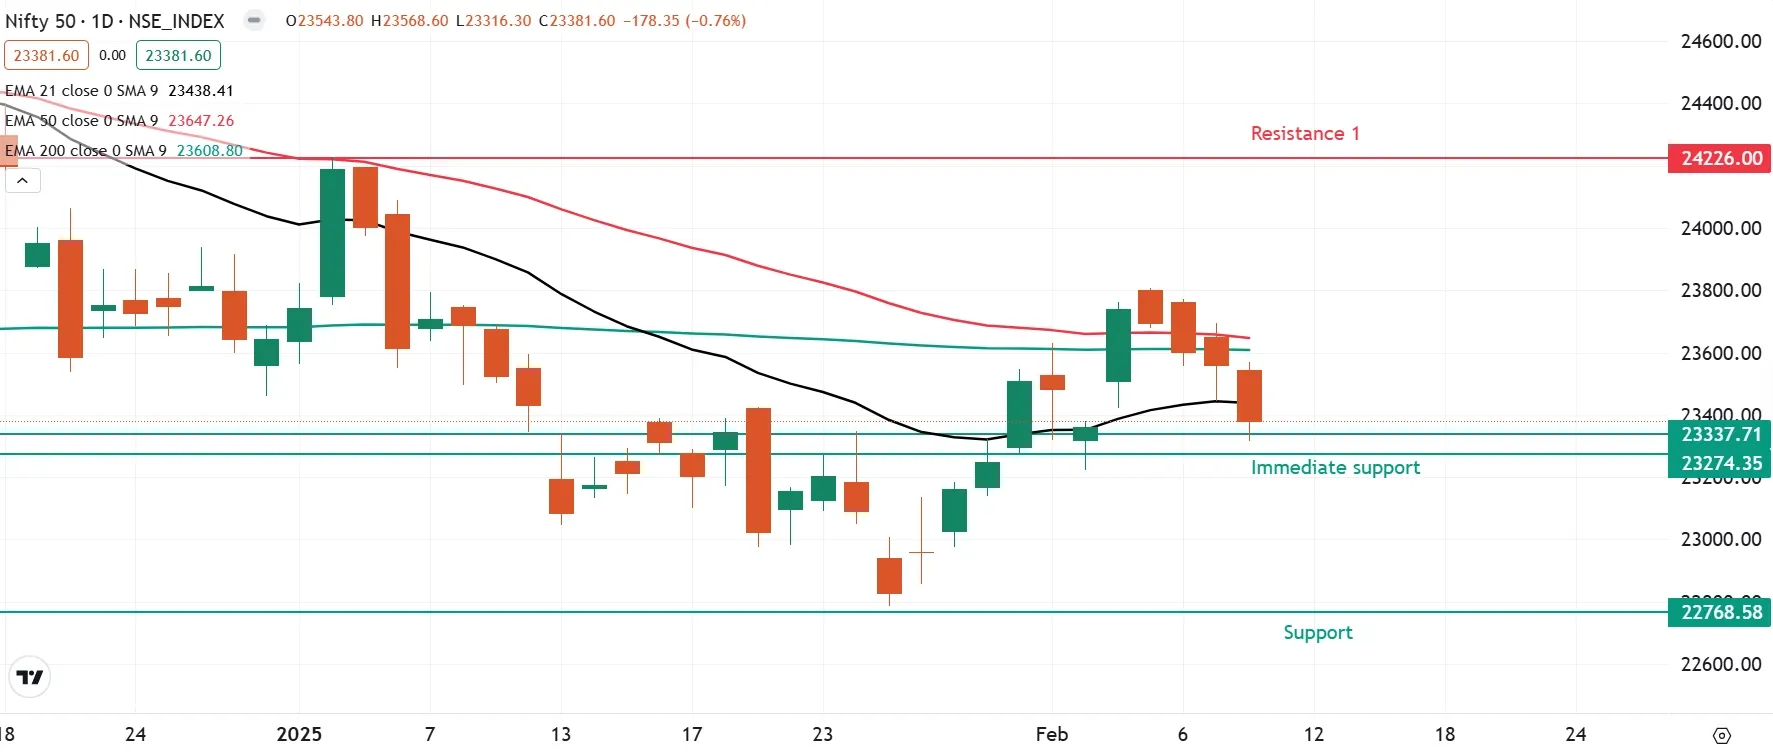
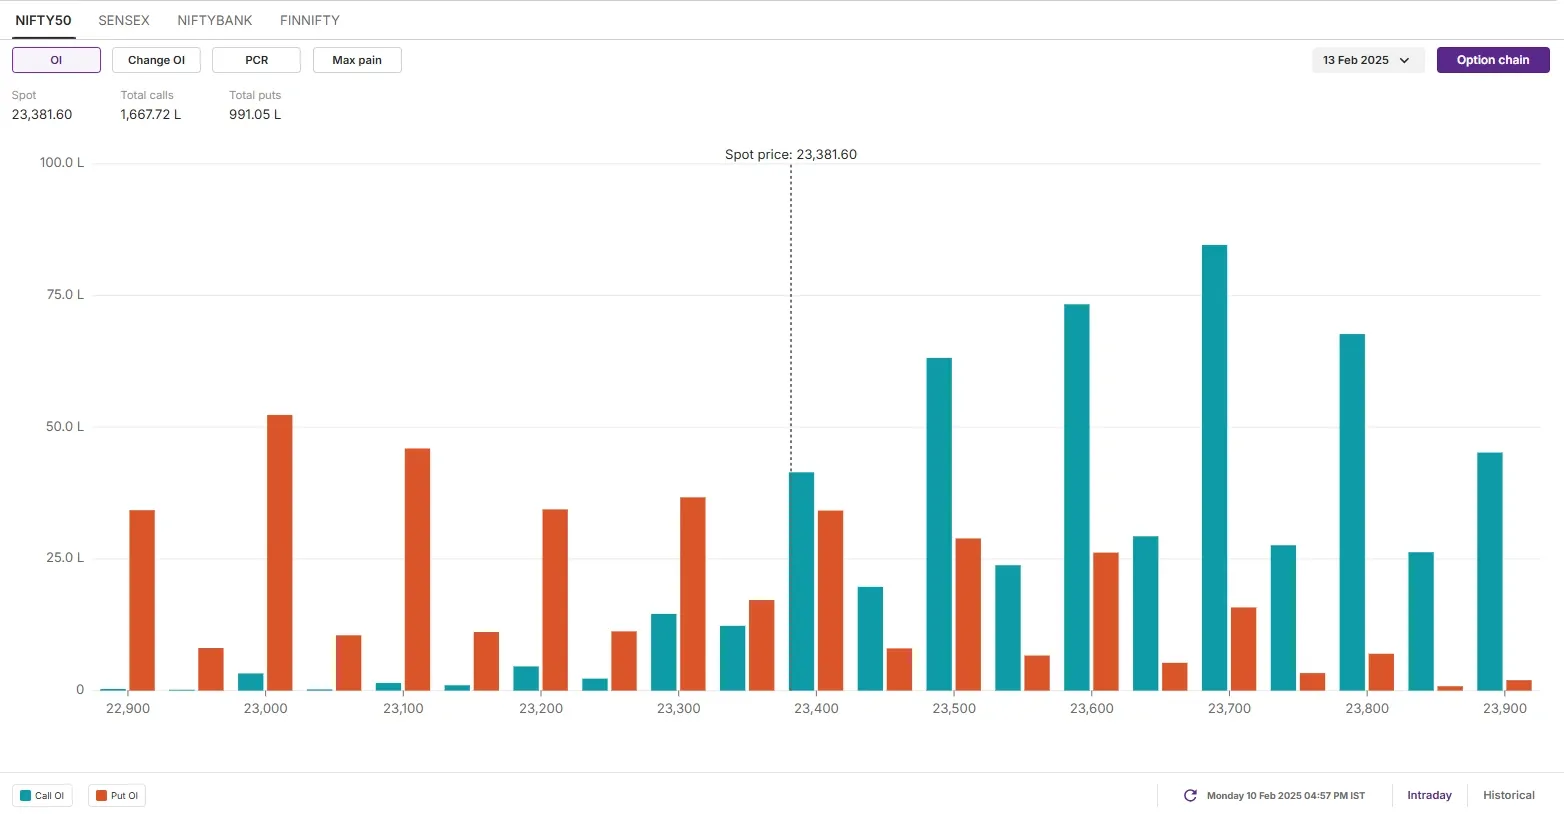
The open interest (OI) data for the 13 February expiry saw significant call OI build-up at 23,700 strike, pointing resistance for the index around this zone. On the flip side, the put OI base was seen at 23,000 with relatively low volume, implying support for the index around this zone.
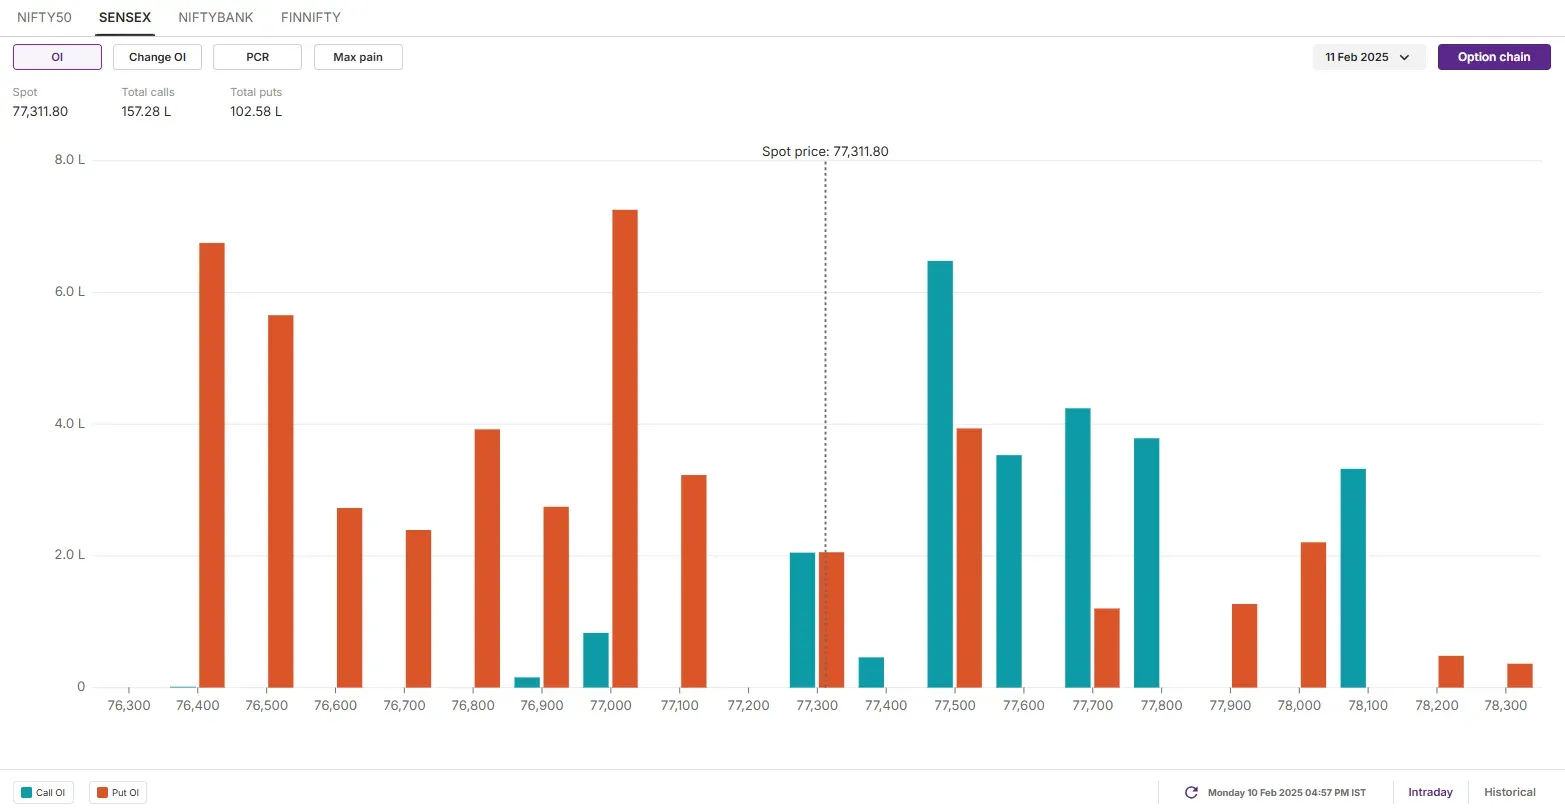
SENSEX
- Max call OI: 78,000
- Max put OI: 77,000
- (20 Strikes from ATM, Expiry: 11 Feb)
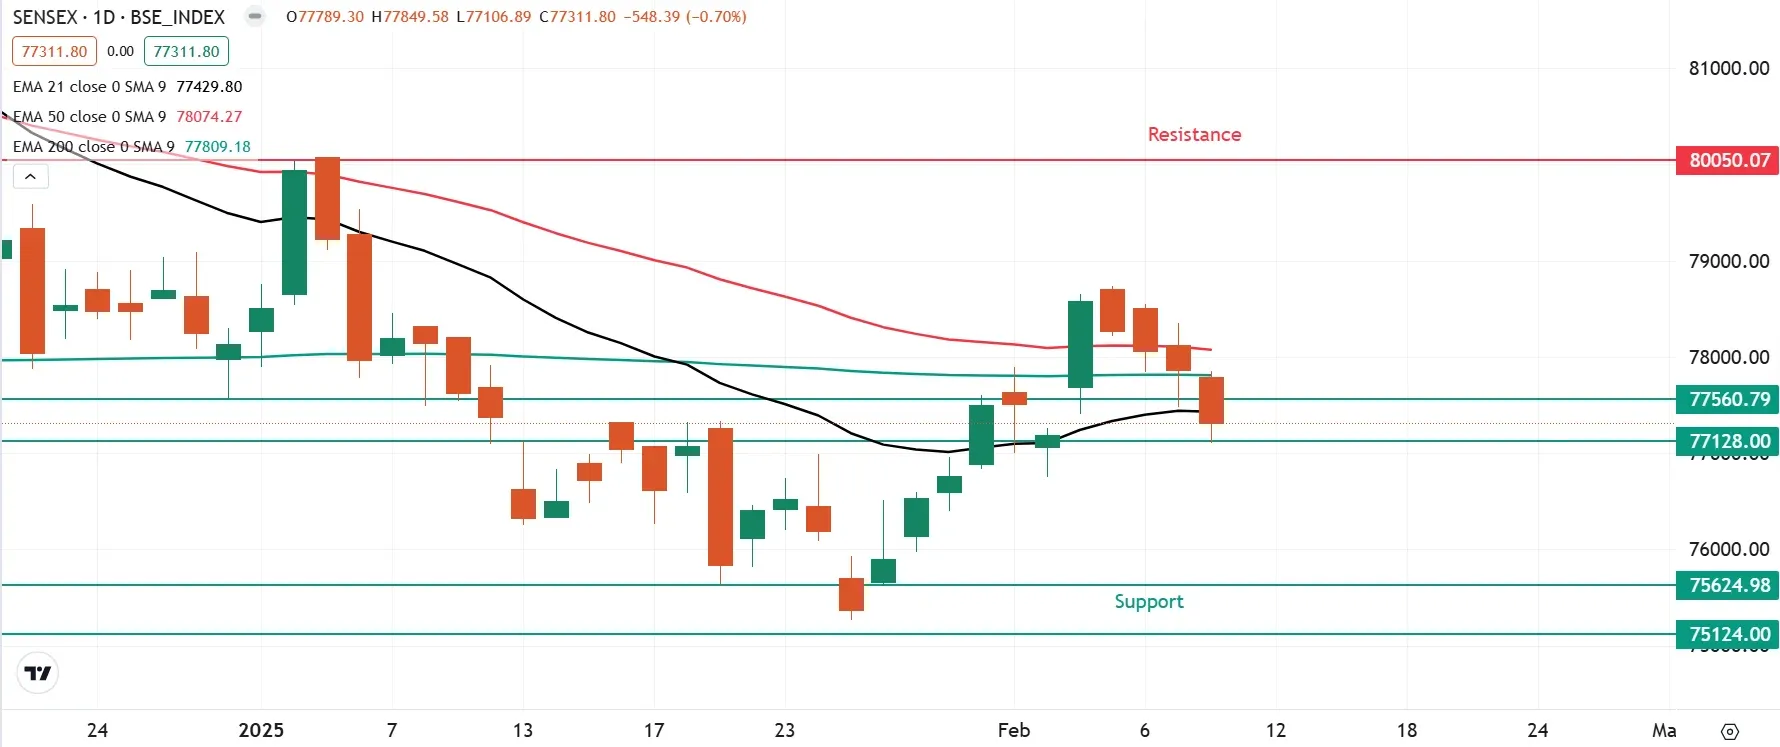
The SENSEX extended the losing streak for the fourth consecutive day and surrendered the crucial 21-day exponential average on a closing basis. The index formed a bearish candle on the daily chart and is currently placed at the crucial support zone of 77,100. If the index slips below the below highlighted support zone on a closing basis, then it may extend the weakness up to 75,600 zone.
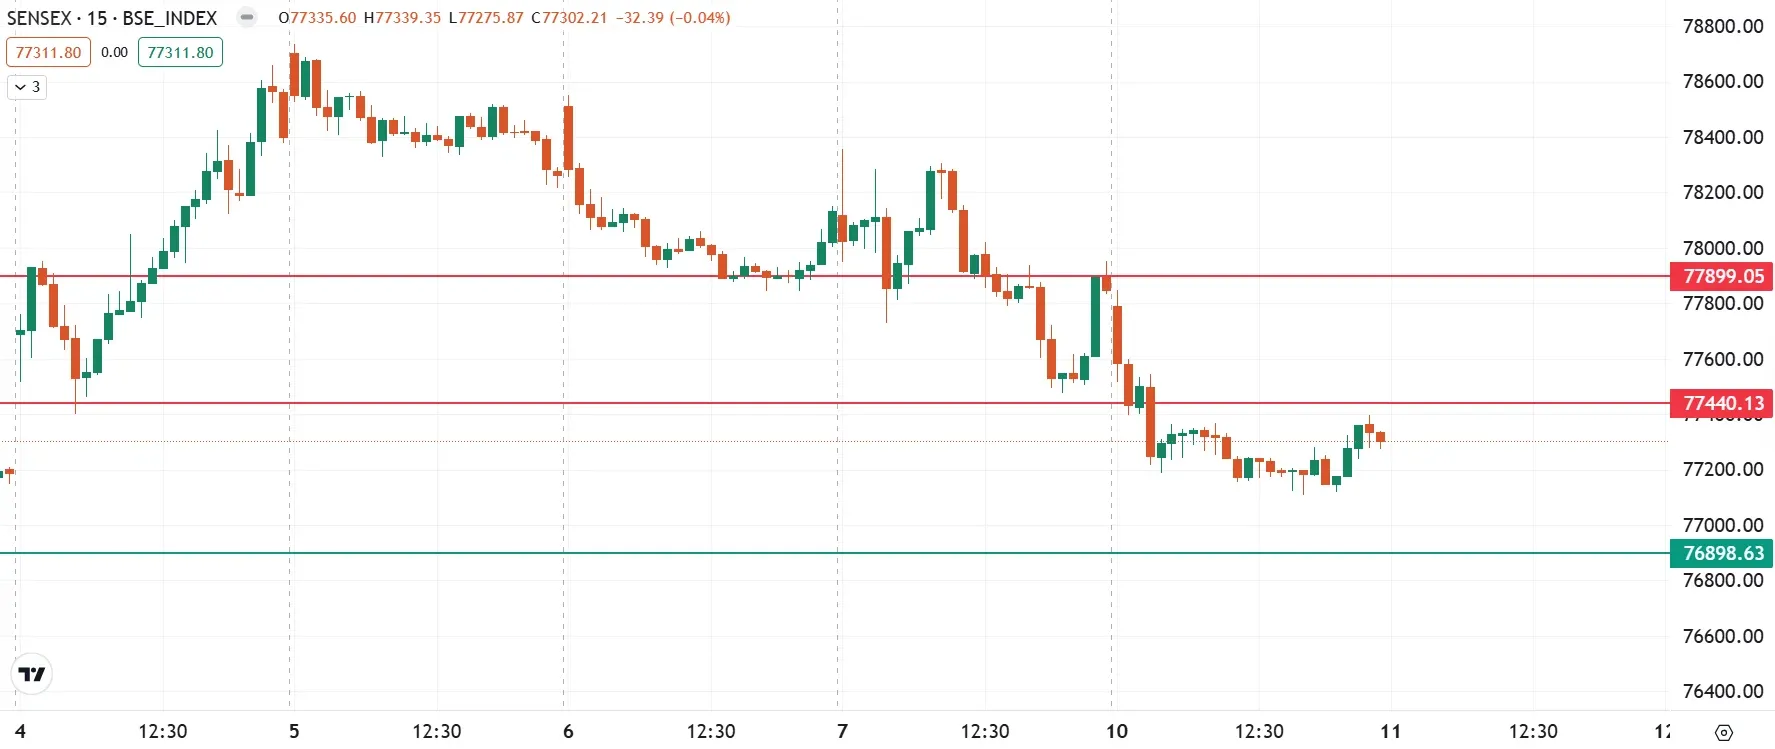
On the 15-minute time-frame, SENSEX is broadly trading between the range of 77,900 and 76,900. For today’s expiry, traders can monitor this range. Unless the index breaks this range with a strong candle, the trend may remain range-bound.
The open interest (OI) data for today’s expiry saw significant call OI base at 77,500 strike, indicating resistance for the index around this zone. On the flip side, the put base on the index was observed at 77,000 strike, pointing at support for the index around this level.
FII-DII activity
Stock scanner
- Long build-up: Nil
- Short build-up: Alkem Laboratories, Varun Beverages, Delhivery, Max Healthcare, Oil India, Trent and National Aluminium
- Top traded futures contracts: HDFC Bank, Bajaj Finance, Mahindra & Mahindra, Kotak Mahindra Bank and Reliance Industries
- Top traded options contracts: M&M 3200 CE, M&M 3300 CE, M&M 3250 CE, Bharti Airtel 1700 CE and Britannia 5000 CE
- Under F&O ban: Manappuram Finance
In Futures and Options or F&O, long build-up means an increase in Open Interest (OI) along with an increase in price, and short build-up means an increase in Open Interest(OI) along with a decrease in price. Source: Upstox and NSE.
Disclaimer: Derivatives trading must be done only by traders who fully understand the risks associated with them and strictly apply risk mechanisms like stop-losses. The information is only for consumption by the client and such material should not be redistributed. We do not recommend any particular stock, securities and strategies for trading. The securities quoted are exemplary and are not recommendatory. The stock names mentioned in this article are purely for showing how to do analysis. Take your own decision before investing.
About The Author
Next Story


