Market News
Trade Setup for Dec 4: NIFTY50 surges past 50-day EMA, eyes break above 24,600
.png)
4 min read | Updated on December 04, 2024, 07:25 IST
SUMMARY
The NIFTY50 index regained its 50-day exponential moving average (EMA) after 31 trading sessions, continuing its winning streak for a third straight day. However, it is now nearing a critical resistance zone between 24,500 and 24,600. A decisive close above this zone could signal sustained bullish momentum and pave the way for a potential move toward the 25,000 mark.
Stock list

The NIFTY50 index extended the winning momentum for the third consecutive day and reclaimed the previous week’s high on the closing basis.
Asian markets @ 7 am
- GIFT NIFTY: 24,523 (-0.04%)
- Nikkei 225: 39,142 (-0.27%)
- Hang Seng: 19,715 (-0.16%)
U.S. market update
- Dow Jones: 44,705 (▼0.1%)
- S&P 500: 6,049 (▲0.0%)
- Nasdaq Composite: 19,480 (▲0.4%)
U.S. indices ended the Tuesday’s lacklusture session on a flat note as the investors digested the job opening report of October. The job openings in October rose to 7.74 million, which was higher than the estimate of 7.5 million. This was the first data this week which provided the strength of the labour market ahead of Friday's release of November’s payrolls report.
Meanwhile, as per the CME FedWatch tool, traders are now expecting a 74% chance that the U.S. Fed may lower the interest rates by 0.25% at its 18 December meeting, compared to 62% a day ago.
NIFTY50
- December Futures: 24,547 (▲0.4%)
- Open interest: 4,65,411 (▼1.3%)
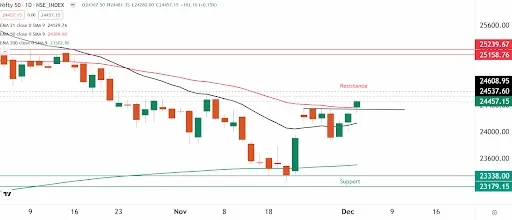
The NIFTY50 index extended the winning momentum for the third consecutive day and reclaimed the previous week’s high on the closing basis. The index reclaimed its 21 day exponential moving average (EMA) and ended Tuesday’s session with the gains of 0.7%.
As shown in the chart below, the NIFTY50 index captured the 24,354 level, the previous week’s high after nearly a month, indicating the continuation of the bullish momentum. Additionally, the index is currently trading above all its key short-term EMAs (21 and 50). The immediate support for the index is around 24,350 and 24,100 zones, while the resistance remains between 24,500 and 24,600 zones. If the index captures this resistance zone, it may extend the gains up to 24,800.

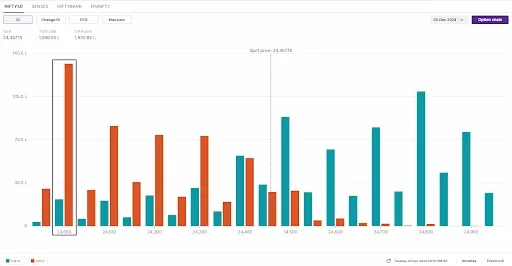
The open interest data of the 5 December expiry has the highest put base at 24,000 strike, indicating support for the index around this zone. Conversely, the call base was seen at 24,800 and 24,500 strikes, suggesting that the index may face resistance around these levels.

SENSEX
- Max call OI: 81,000
- Max put OI: 80,000
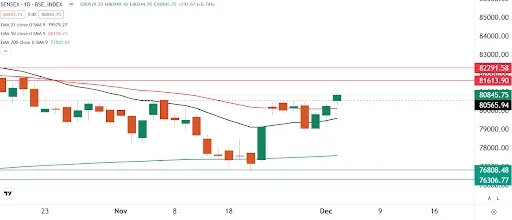
The SENSEX also extended its winning streak for the third consecutive day, reclaiming the previous week’s high of 80,511, signalling continuation of the bullish momentum.
The technical structure of the index as per the daily chart looks bullish with immediate support around 79,500 zone, which coincides with the 21-day exponential moving average (EMA) of the index. Unless the index slips below this level, the trend may remain positive and it can test the 81,600 zone.

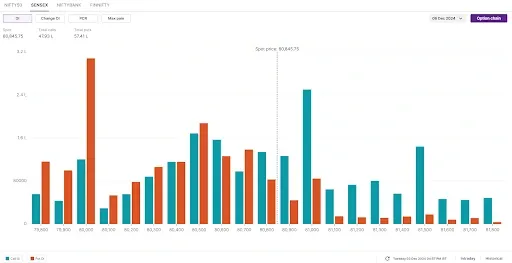
Meanwhile, the open interest data for the 6 December expiry saw significant put additions from 80,500 to 80,700 strikes, indicating bullish momentum. Additionally, the highest put base of the index now stands at 80,000 strike, reflecting support for the index around these levels. On the flip side, the call base shifted to 81,000 strike, hinting at resistance for the index around this zone.

FII-DII activity
Stock scanner
- Long build-up: KPIT Technologies, Tata Elxsi, Manappuram Finance, Union Bank, Bank of India and Angel One
- Short build-up: Granules India, Deepak Nitrite, Metropolis Healthcare, IPCA Laboratories and PB Fintech (Policy Baazar)
- Under F&O ban: Granules India, Manappuram Finance and RBL Bank
- Added under F&O ban: Granules India and Manappuram Finance
In Futures and Options or F&O, long build-up means an increase in Open Interest (OI) along with an increase in price, and short build-up means an increase in Open Interest(OI) along with a decrease in price. Source: Upstox and NSE.
Disclaimer: Derivatives trading must be done only by traders who fully understand the risks associated with them and strictly apply risk mechanisms like stop-losses. The information is only for consumption by the client and such material should not be redistributed. We do not recommend any particular stock, securities and strategies for trading. The securities quoted are exemplary and are not recommendatory. The stock names mentioned in this article are purely for showing how to do analysis. Take your own decision before investing.
About The Author
Next Story

