Market News
Trade Setup for Dec 27: Will the SENSEX break out of the three-day consolidation?
.png)
3 min read | Updated on December 27, 2024, 07:43 IST
SUMMARY
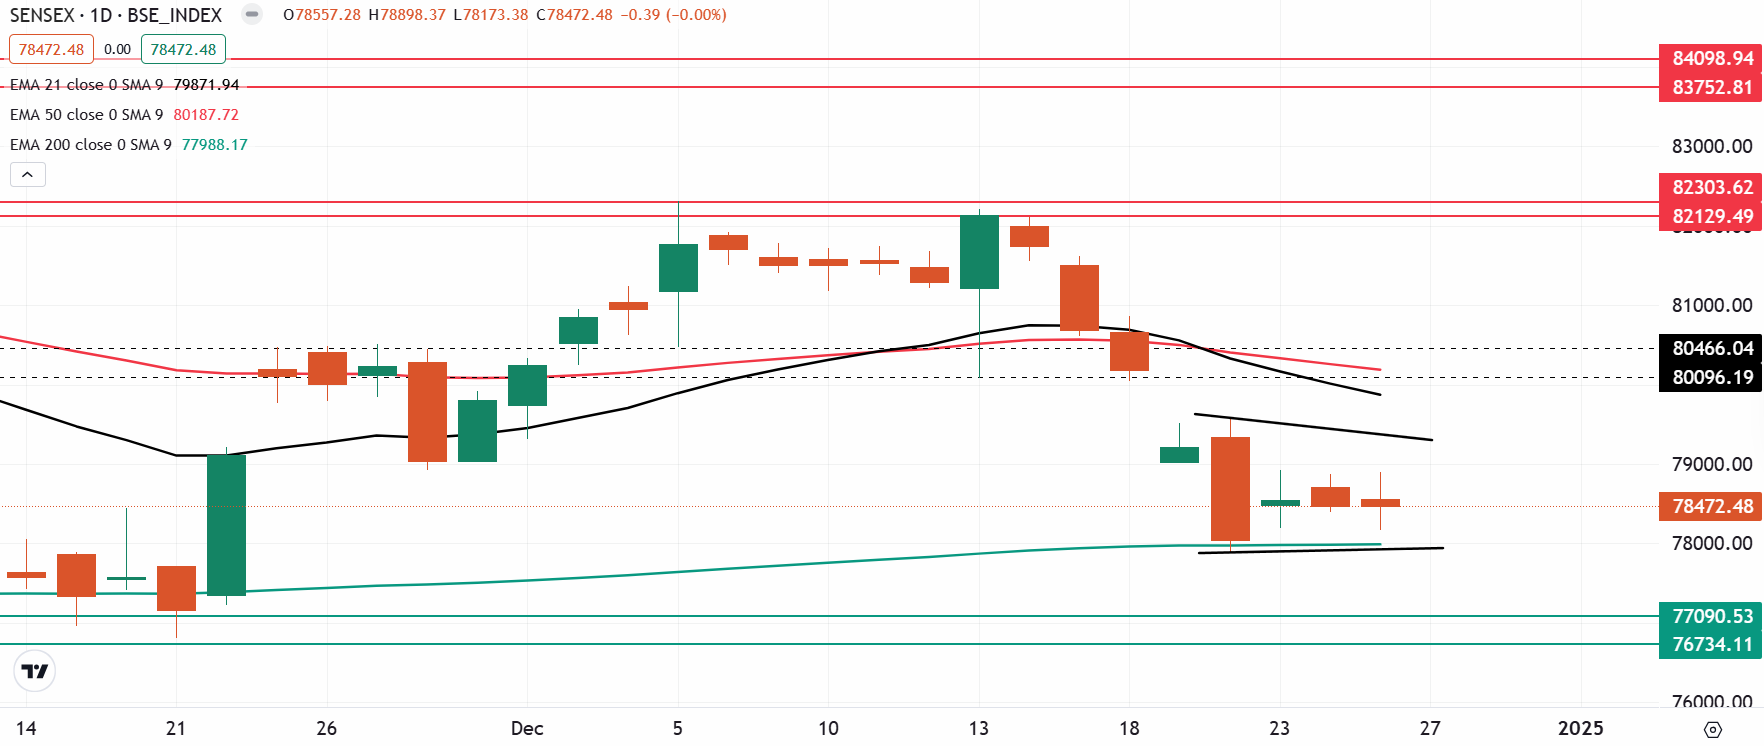
The SENSEX traded in a narrow range for the three consecutive days with the base around 78,500. For further clues, traders can monitor the high and the low of 20 December’s candle. A break above or below this range will provide further directional clues.
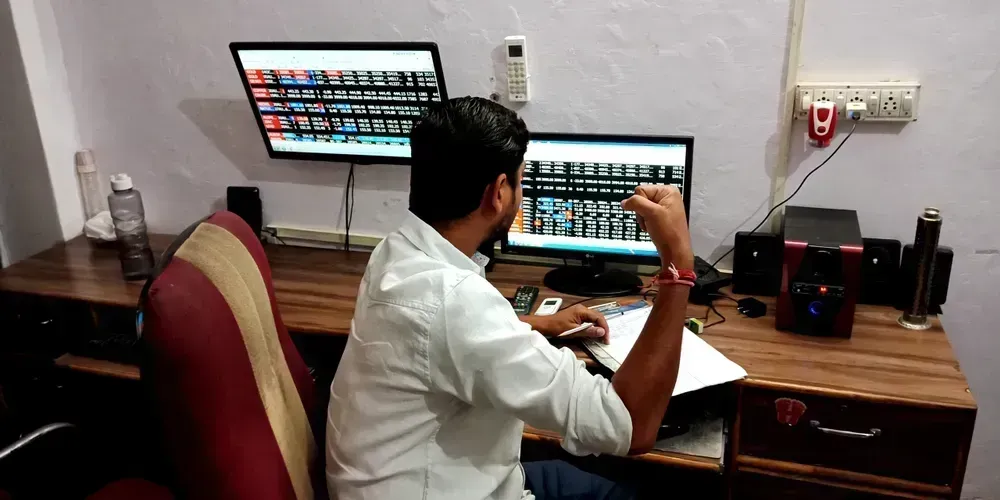
The price action of SENSEX remained range-bound for the third day in a row and the index formed yet another doji on the daily chart.
Asian markets @ 7 am
- GIFT NIFTY: 23,927 (+0.26%)
- Nikkei 225: 39,974.98 (+1.03%)
- Hang Seng: 20,114.28 (+ 0.08%)
U.S. market update
- Dow Jones: 43,325 (▲0.0%)
- S&P 500: 6,037 (▼0.0%)
- Nasdaq Composite: 20,020 (▼0.0%)
U.S. indices ended the Tuesday’s session flat as the Santa Claus rally took a breather. As Wall Street returned after a day’s break, the investors digested the weekly jobless claims fell to 2,19,000 compared with the expectations of 2,23,000. However, the number of continuing claims for unemployment benefits rose to 1.91 million, highest since 13 November 2001.
NIFTY50
- January Futures: 23,919 (▼0.0%)
- Open interest: 4,46,510 (▲42.4%)
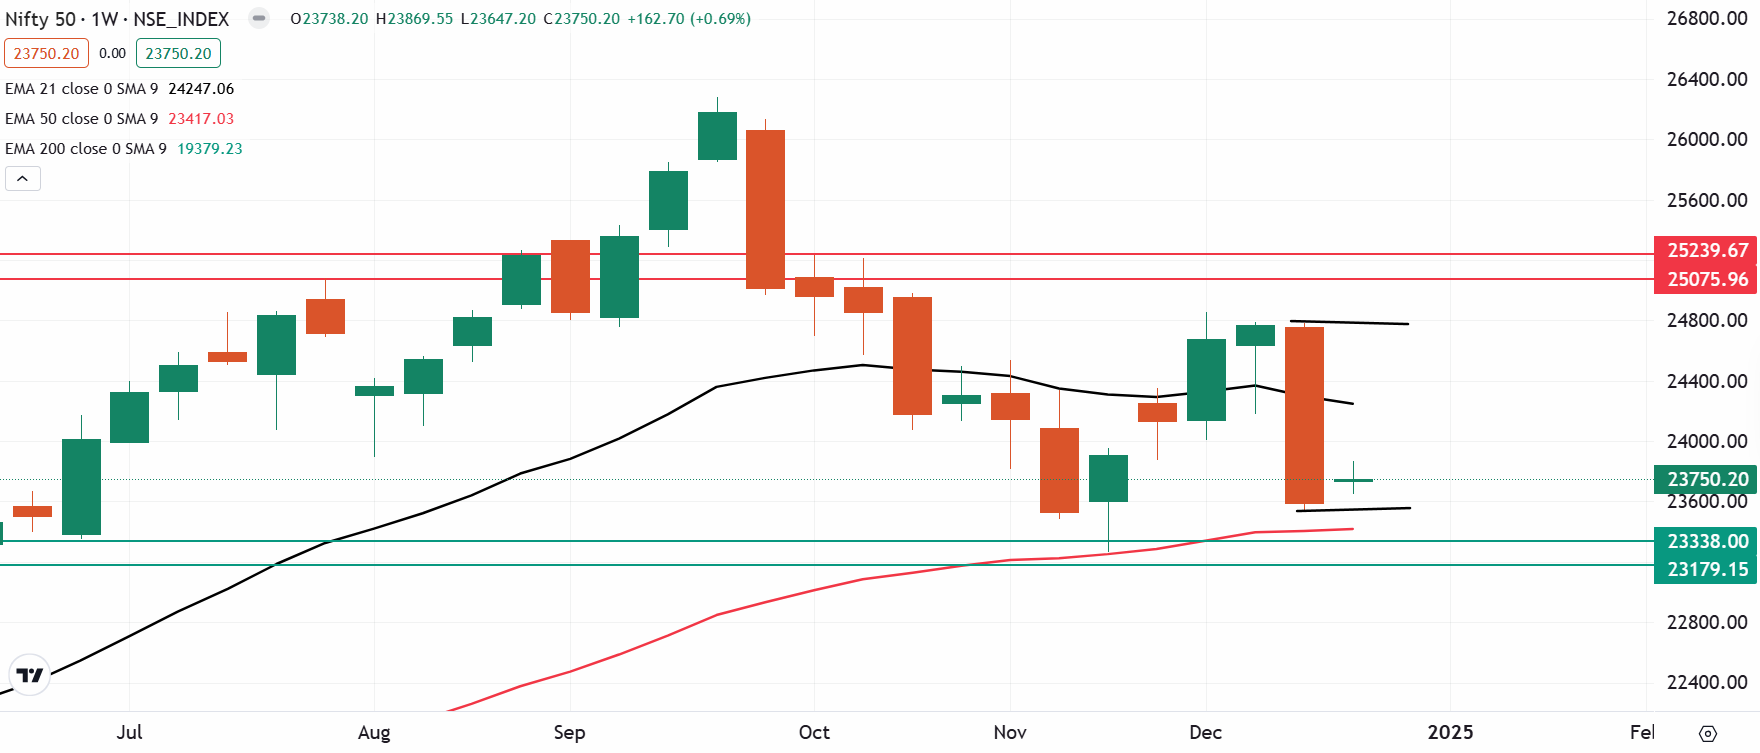
The NIFTY50 index extended the range bound trading for the third day in a row and ended the monthly expiry session on a flat note.
The technical structure of the index as per the weekly chart remains muted with early indication of formation of inside candle. Traders should closely monitor the weekly close of the index as a close below previous week’s low will signal weakness. However, if index reclaims the 24,000 on closing basis, then the trend may turn sideways to bullish.
SENSEX
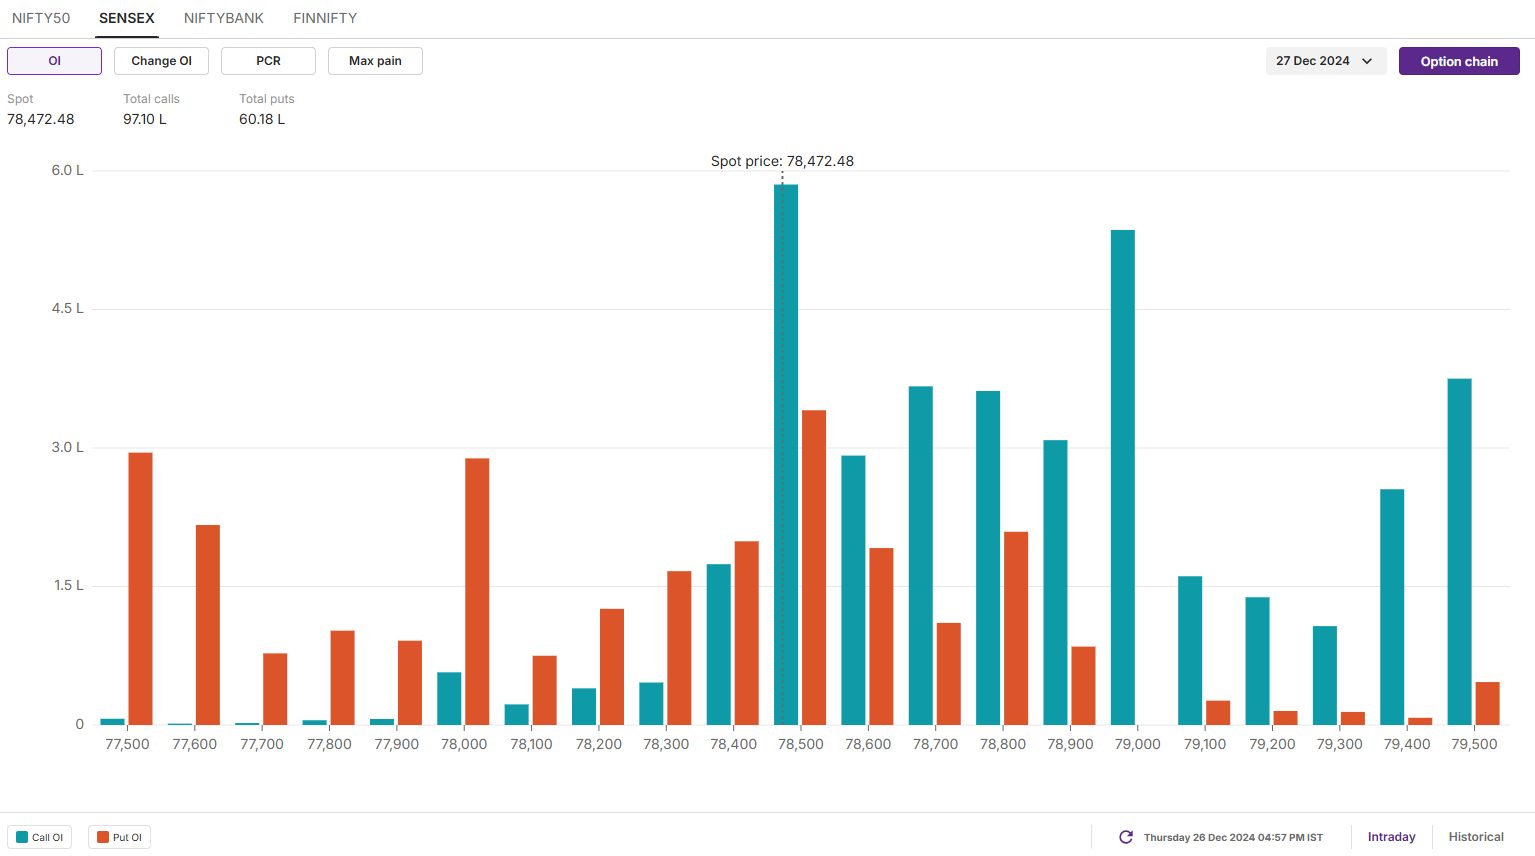
- Max call OI: 80,000
- Max put OI: 78,500
- (Expiry: 27 Dec)
The price action of SENSEX remained range-bound for the third day in a row and the index formed yet another doji on the daily chart. Since doji is an indecision pattern, a close above or below it will provide further directional clues.
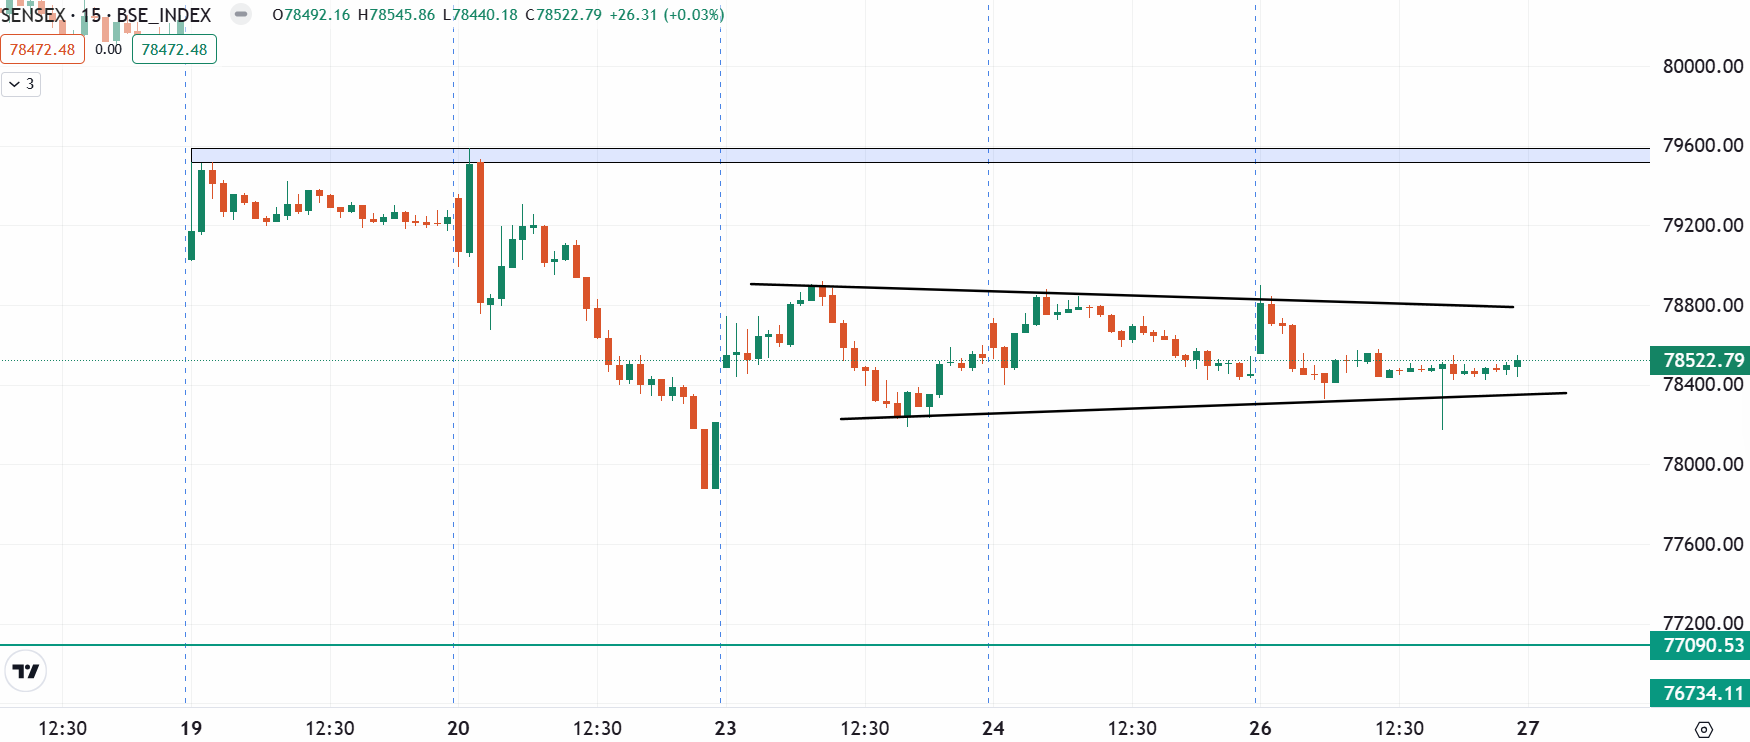
The technical structure of the SENSEX remains range-bound within 20 December’s trading range. For today's expiry, focus on two key 15-minute trading ranges. The first is between 78,900 and 78,200. The second encompasses yesterday's high and low. A break of either range may signal a directional move
The open interest data for today’s expiry sustained the call base at 79,000 and 78,500 strikes, indicating resistance for the index around these zones. On the other hand, the put base was seen at 78,000 and 77,500 strikes with relatively low volume, suggesting support for the index around these levels.
FII-DII activity
Stock scanner
- Long build-up: CG Power, KEI Industries, IRB Infrastructure, Power Finance Corporation and L&T Finance
- Short build-up: Manappuram Finance, Hindustan Copper, Page Industries, Bandhan Bank and PVR Inox
- Under F&O ban: Nil
In Futures and Options or F&O, long build-up means an increase in Open Interest (OI) along with an increase in price, and short build-up means an increase in Open Interest(OI) along with a decrease in price. Source: Upstox and NSE.
Disclaimer: Derivatives trading must be done only by traders who fully understand the risks associated with them and strictly apply risk mechanisms like stop-losses. The information is only for consumption by the client and such material should not be redistributed. We do not recommend any particular stock, securities and strategies for trading. The securities quoted are exemplary and are not recommendatory. The stock names mentioned in this article are purely for showing how to do analysis. Take your own decision before investing.
About The Author
Next Story


