Market News
Trade Setup for Dec 16: NIFTY50 to extend its short-covering rally or slip back into consolidation?
.png)
4 min read | Updated on December 16, 2024, 07:15 IST
SUMMARY
The NIFTY50 index witnessed a robust short-covering rally on Friday, rebounding over 2% from the day’s low, highlighting support-driven buying at lower levels. The session also featured an above-average range expansion, suggesting potential consolidation around the current levels.
Stock list

Asian markets @ 7 am
- GIFT NIFTY: 24,784.50 (+0.03%)
- Nikkei 225: 39,515.69 (+0.11%)
- Hang Seng: 19,947.23 (-0.12%)
U.S. market update
- Dow Jones: 43,828 (▼0.2%)
- S&P 500: 6,051 (▼0.0%)
- Nasdaq Composite: 19,926 (▲0.1%)
U.S. indices ended the Friday’s session on the mixed note amid broad-based selling by investors due to worries of persistent inflation. In the upcoming week, investors will turn their attention to the Federal Reserve’s interest rate-decision. According to the Fed funds futures, a quarter-percentage point rate cut appears locked in.
NIFTY50
- December Futures: 24,830 (▲0.8%)
- Open interest: 4,34,225 (▼2.3%)
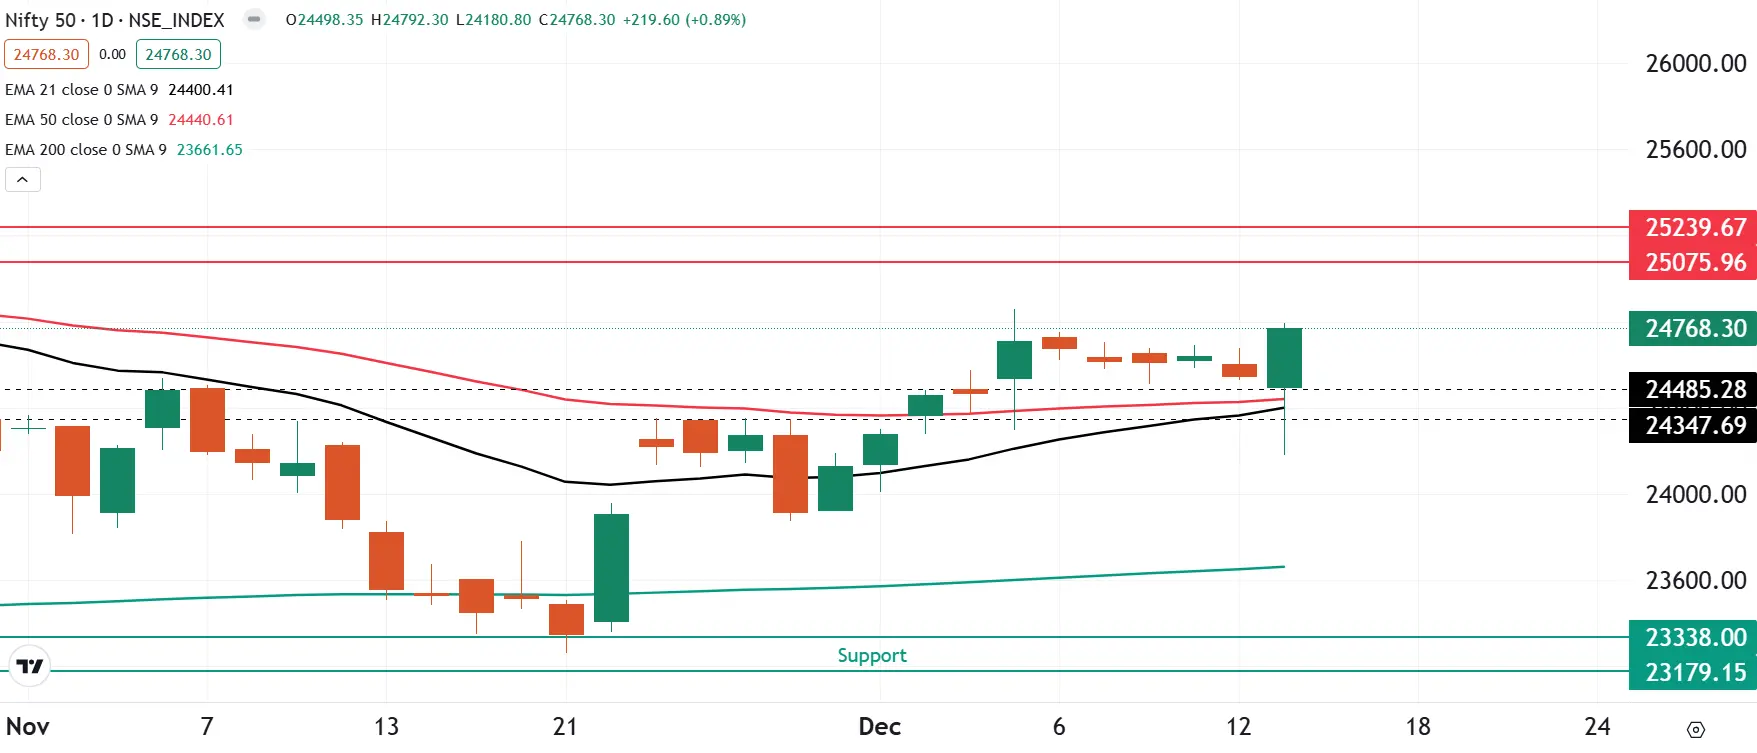
After a negative start, the NIFTY50 index rallied over 2% from Friday’s low in a sharp recovery and ended above the high of the previous five trading sessions. The index protected the 21 and 50 day exponential moving averages (EMA) on a closing basis, indicating support based buying from lower levels.
From the technical standpoint, the trend of the NIFTY50 remains sideways to bullish after Friday’s sharp rebound. The index ended the Friday’s session near the resistance of previous week’s high (24,857), which is the crucial level to watch in the upcoming sessions. A break above this zone on a closing basis will signal continuation of the bullish momentum. Meanwhile, the crucial support is visible around the 24,300 zone.

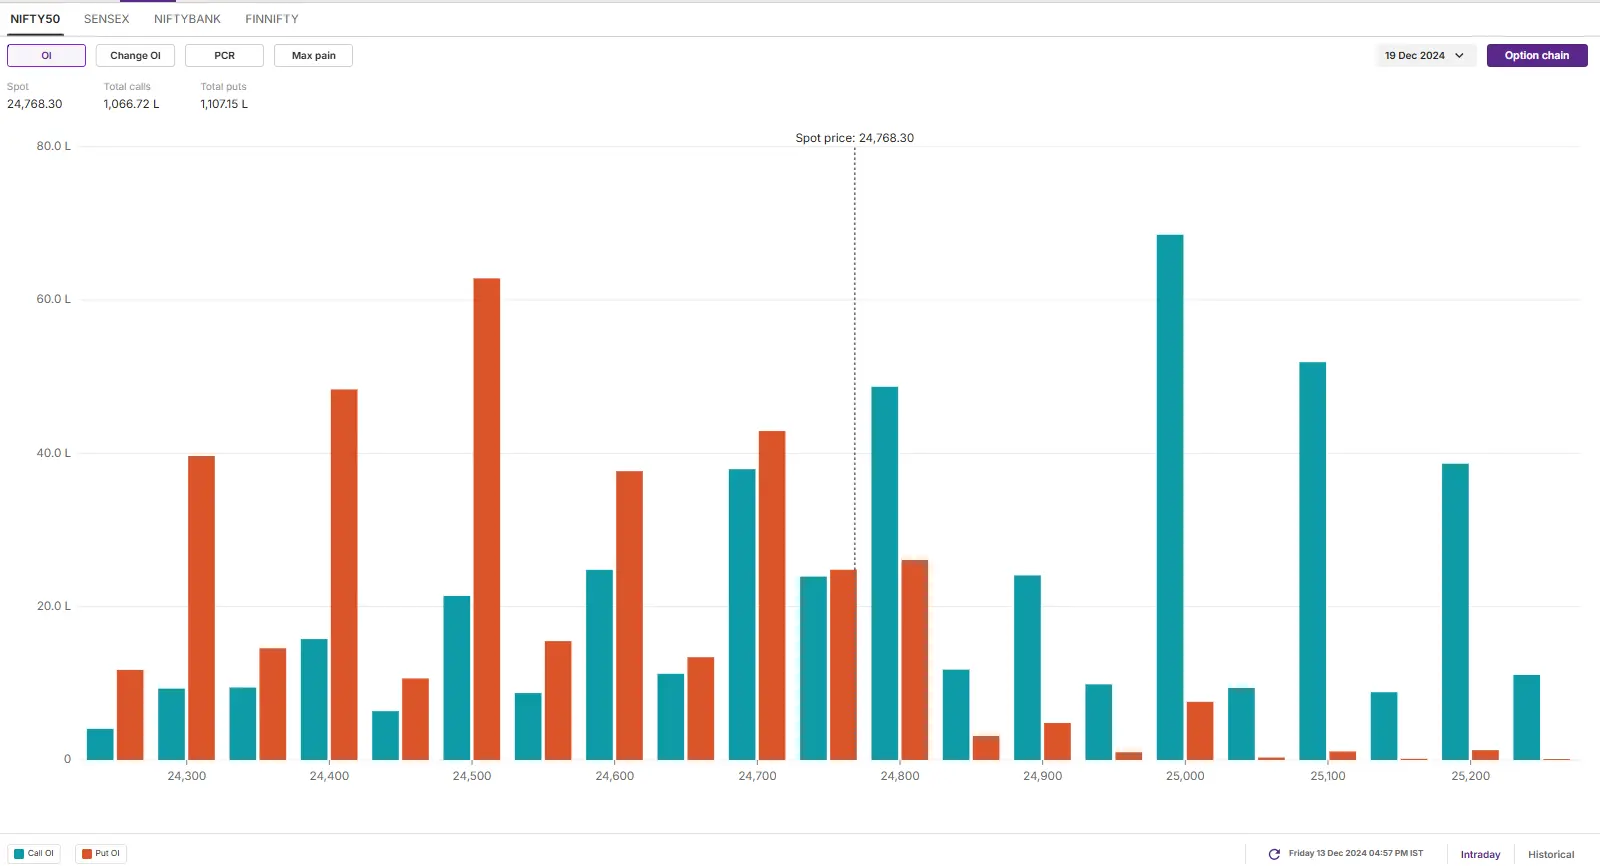
The open interest (OI) data for the 19 December expiry saw significant call OI at 24,500 strikes, pointing at resistance for the index around this zone. Conversely, the base for the put options was seen at 24,500 strikes, suggesting support for the index around this zone.

SENSEX
- Max call OI: 82,000
- Max put OI: 82,000
- (Expiry: 20 Dec)
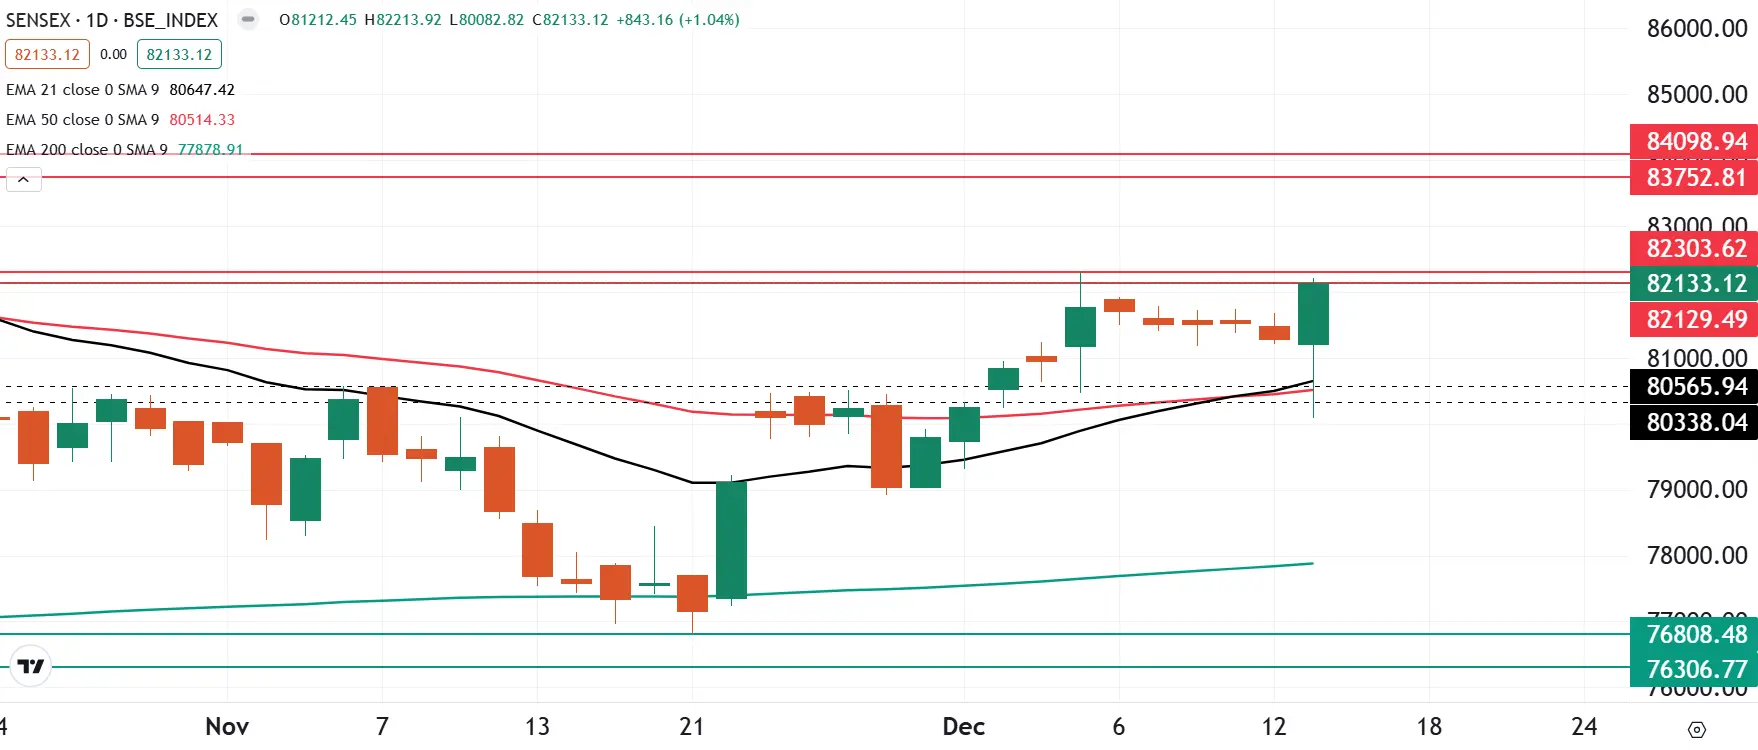
The SENSEX also showed significant strength during Friday's session, forming a bullish candle on the daily chart and closing above the highs of the previous five trading sessions.
On the daily chart, the index found support near the critical 21-day and 50-day EMAs, rebounding over 2.5% from the day’s low. This suggests buying interest emerging from key support zones at lower levels. Furthermore, the index closed Friday’s session near the previous week’s high of 82,300, which acts as an immediate resistance.
For the upcoming sessions, traders should closely watch the 82,300–80,500 range. A breakout above or below this range could offer directional cues, while movement within the range may indicate continued sideways consolidation.

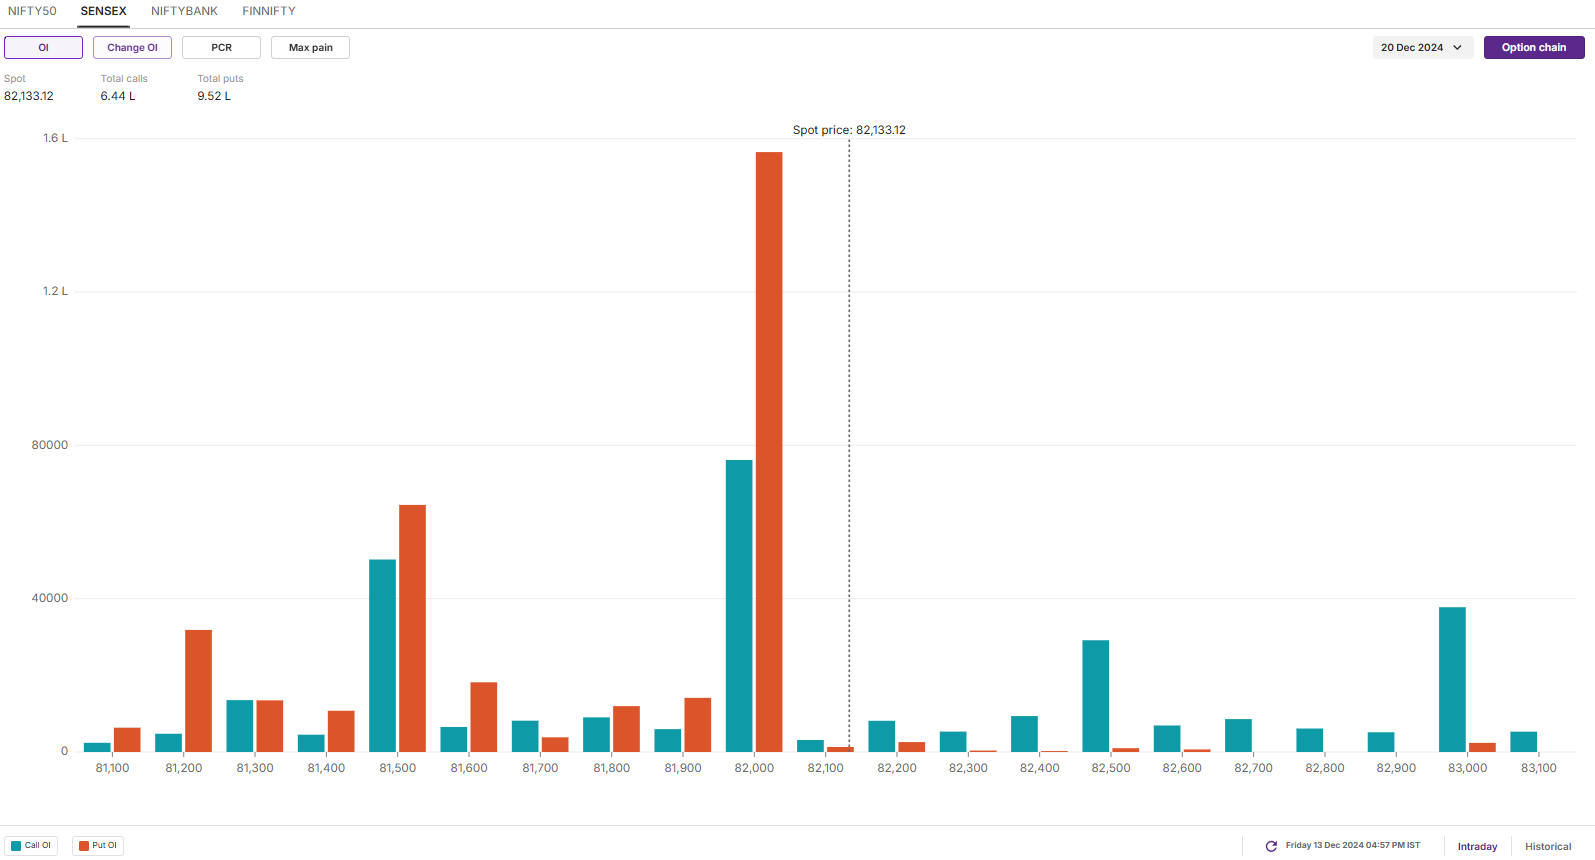
The open interest (OI) data for the 20 December saw significant placement of call and put OI at 82,000 strikes, suggesting range-bound activity around these levels. However, the open interest build-up during the Friday’s session was seen with relatively low volume.

FII-DII activity
Stock scanner
- Long build-up: Manappuram Finance and Paytm
- Short build-up: Steel Authority of India, Poonawalla Fincorp, Oil India, PB Fintech (Policy Baazar) and IRFC
- Under F&O ban: Granules India, Hindustan Copper, Manappuram Finance, Metropolis Healthcare, National Aluminium, PVR Inox, RBL Bank and Steel Authority of India
- Added under F&O ban: Manappuram Finance, National Aluminium and Steel Authority of India
In Futures and Options or F&O, long build-up means an increase in Open Interest (OI) along with an increase in price, and short build-up means an increase in Open Interest(OI) along with a decrease in price. Source: Upstox and NSE.
Disclaimer: Derivatives trading must be done only by traders who fully understand the risks associated with them and strictly apply risk mechanisms like stop-losses. The information is only for consumption by the client and such material should not be redistributed. We do not recommend any particular stock, securities and strategies for trading. The securities quoted are exemplary and are not recommendatory. The stock names mentioned in this article are purely for showing how to do analysis. Take your own decision before investing.
About The Author
Next Story

