Market News
How to trade in HCL Tech ahead of its Q1 results?
.png)
4 min read | Updated on July 12, 2024, 12:32 IST


SUMMARY
HCL Technologies is trading above all of its major moving averages on the daily chart and formed a bullish candle on the weekly chart last week. With the upcoming earnings announcement, the options market implies a move of ±5% before the 25 July expiry.
Stock list

HCL Tech Q1 result option strategy
According to experts, HCL Tech's Q1 FY25 revenue could grow by 6-7% on a year-on-year basis, in the range of ₹27,900 crore to ₹28,050 crore. On a sequential basis, revenues could decline by 1-2%. The company posted revenues of ₹26,296 crore in Q1FY24 and ₹28,499 crore in the March quarter of FY24.
Meanwhile, its net profit could increase by 5-7% on a yearly basis, ranging between ₹3,714 crore to ₹3,776 crore. However, net profit could slide by 5-7% on a quarter-on-quarter basis. The company reported a net profit of ₹3,531 crore in Q1FY24 and ₹3,995 crore in the March quarter of FY24.
The company's earnings before interest and tax (EBIT) margin is expected to decline by 70 bps to 16.9% from 17.6% in the previous quarter. Investors will be watching HCL Tech's new deal wins in Q1 and management's comments on the recovery in discretionary spending in the services segment.
Ahead of its Q1 results, HCL Tech's shares are trading over 3% higher at ₹1,558 per share. The stock is also up 6.2% year-to-date.
Technical view
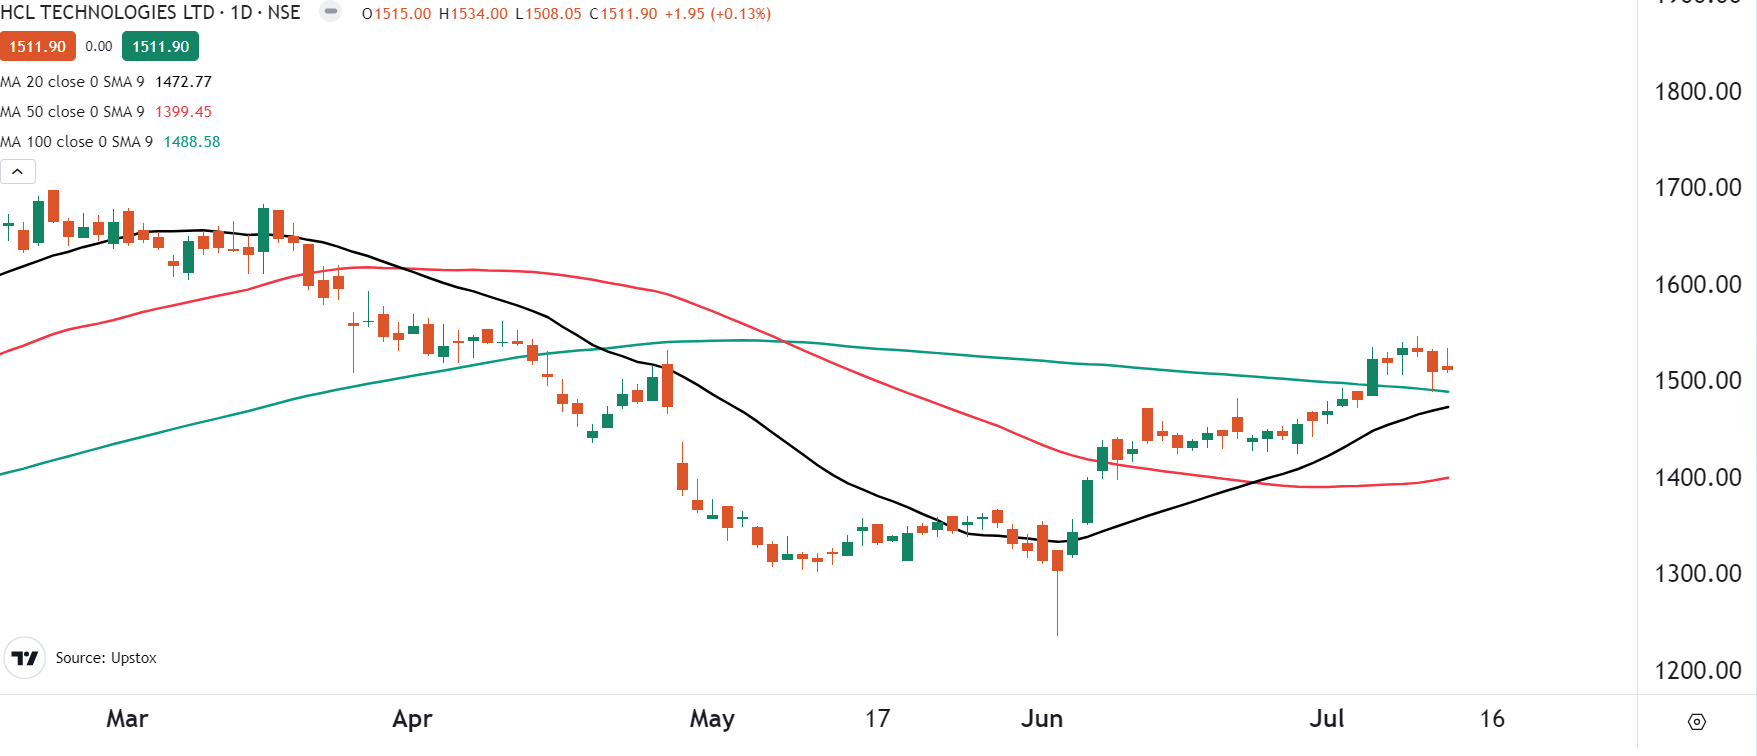
The daily chart of HCL Technologies is currently in a bullish trend, forming a higher-high and higher-low structure. The stock is trading above all its key daily moving averages ( 20, 50 and 100), indicating strength.
Additionally, on 10 July, the stock formed a bullish hammer on the daily chart at the crucial support of the 100-day moving average. The hammer is a bullish reversal pattern formed at support. It shows a small real body at the top of the range with a long lower shadow, signalling that buyers are gaining strength after an initial sell-off.
However, traders usually wait for the confirmation of the reversal pattern. A close above the high of the hammer will confirm the pattern, while a close below will result in weakness. Moreover, on the weekly chart, HCL Technologies formed a bullish engulfing candle last week, marking buyers' presence at the candle's low.
Options overview
The open interest positioning on HCL Technologies ahead of its Q1 results shows a significant call and put accumulation at the 1,500 strike. In addition, there has been significant call accumulation at the 1,560 and 1,600 strikes, indicating resistance around these levels.
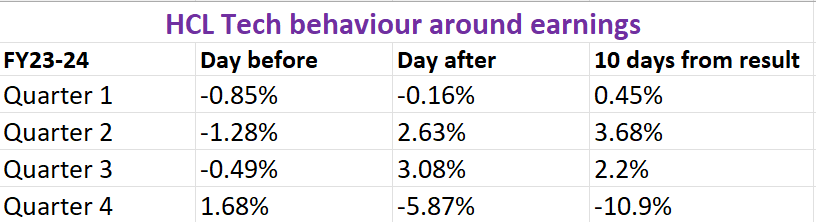
Before we get into strategies, let's take a look at how the HCL’s share price has behaved around its earnings announcements over the last four quarters.
How to formulate an options strategy for HCL Technologies
Given the implied movement of ±5% from the options market, traders can look at Long and Short Straddle strategies to take advantage of the anticipated volatility and price swings.
About The Author
Next Story


