Market News
Market breadth analysis: NIFTY50 trades 2% above its 200 DEMA, what does this indicate for Indian markets; check details
.png)
4 min read | Updated on November 06, 2024, 08:32 IST


SUMMARY
Indian equity benchmark indices, the NIFTY50 and SENSEX, plunged amid geopolitical tensions, and record selling by FPIs in the month of October. In the NIFTY50 pack, 21 stocks are trading below their 200-day exponential moving averages (DEMA), indicating a sign of a weakening bullish trend, while NIFTY50 trades 1.8% above its 200-DEMA, showing its long-term bullish trend is still intact.

NIFTY50 trading 1.8% above its 200-DEMA - What does market breadth indicate for the NSE benchmark index
In September, the NIFTY50 and SENSEX reached new record high levels of 26,277.35 and 85,978.25, respectively. However, in October, due to rising geopolitical tensions, tepid quarterly earnings and a tactical shift from FIIs to other emerging markets, which offered valuation comfort, the benchmark indices slipped more than 9% from the peak. NIFTY50 registered the highest monthly fall of 6% in October since March 2020.
Along with the fall, the volatility is surging, which reflects that there is still uncertainty among the market participants ahead of the U.S. presidential elections and Federal Reserve outcome.
Currently, NIFTY50 is trading below its important psychological level of 24,000. It has slipped below its 20-day and 50-day moving averages. But it is still trading 1.8% above its 200-day exponential moving average, suggesting that the NIFTY50 is still in bullish territory from a long-term perspective. Considering the NIFTY50 index is still trading above its long-term moving average. Let’s understand, from the lens of a popular breadth indicator, how the constituents are placed.
Market Breadth Analysis (NIFTY50)
The popular breadth analysis which we are going to talk about is the number or percentage of stocks trading above their 200-day exponential moving averages (DEMA). It is a widely used breadth analysis to understand whether the underlying sector/index is in a bullish or bearish stand.
Below is the chart of the NIFTY50 index along with a chart in the lower pane that shows the percentage of stocks trading above 200-DEMA.
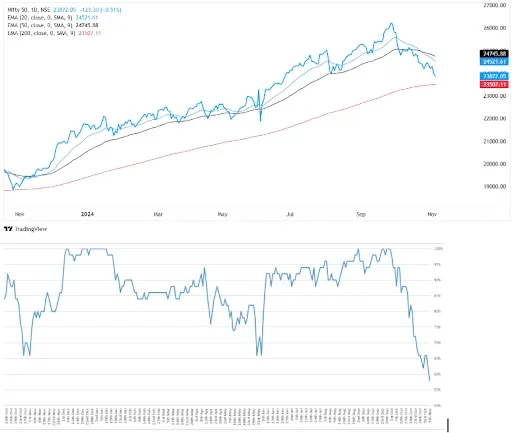
Among the 50 constituents of the NIFTY50, 42% or 21 stocks are trading below their respective 200-DEMA as of November 05, 2024.
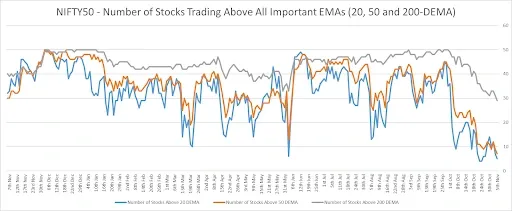
As of Tuesday, only five stocks are trading above the 20-day exponential moving average, seven stocks trading above a 50-day exponential moving average and 29 stocks are trading above the 200-day exponential moving average amongst constituents of NIFTY50.
As shown in the chart given below, the market breadth seems to be weakening since the peak of September. The market breadth of NIFTY50 has dropped this much for the first time in the last year, where 29 stocks (almost 58%) are trading above 200-DEMA.
Market Breadth Analysis (Nifty 500)
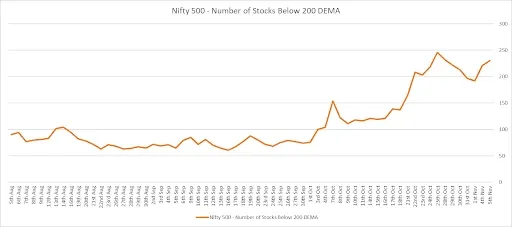
Looking at a broader picture (Nifty 500), as of Tuesday, November 05, 2024, 118 stocks are trading above the 20-day exponential moving average, 120 stocks trading above a 50-day exponential moving average and 270 stocks trading above the 200-day exponential moving average are amongst constituents on Nifty 500.
As shown in the chart given below, the market breadth of the Nifty 500 index has also been weakening, with 270 stocks (almost 54%) trading above their respective 200-DEMA. On October 23, the Nifty 500 marked its lowest breadth, with 254 stocks trading above 200-DEMA, registering the first instance in the last year.

Number of Stocks trading below 200-DEMA
In the chart below, it's shown that the number of stocks trading below 200-DEMA has been rising since September last week.
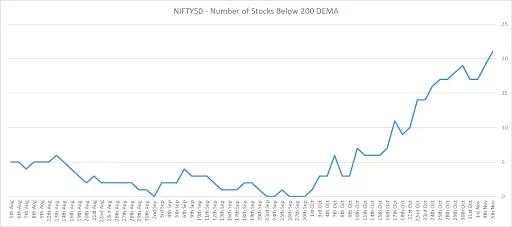
The NIFTY50 index has tanked over 6% in the month of October, registering its sharpest decline in one month since March 2020 and from its all-time high, it is down by 9%. The sharp fall index is mirrored in the market breadth analysis as well. More than 40% of NIFTY50 and Nifty 500 constituents slipped below their respective 200-DEMA, highlighting cautiousness or a risk-off mood among market participants ahead of the key events in the U.S. like the presidential election and the Federal Reserve outcome.
About The Author
Next Story


