Market News
NTPC Ltd to IDBI Bank: Five NIFTY500 stocks gain up to 19% in March; check technical levels

5 min read | Updated on March 21, 2025, 09:28 IST


SUMMARY
Several NIFTY500 stocks, including Great Eastern Shipping, REC Ltd, IDBI Bank and others have risen between 8% to 19% in March 2025. These stocks have formed an Inverse Head and Shoulders pattern after significant declines, which indicates potential trend reversals.
Stock list

Inverse Head and Shoulders (H&S) pattern formation and its potential breakout suggest a trend reversal. | Image: Shutterstock
Indian benchmark index NIFTY50 has declined nearly 16% from its peak. The index witnessed 5 consecutive monthly dips up to February 2025 after hitting all time high in September 2024. However, in March 2025, for now, the monthly candle appears green which shows a pause to the straight decline. Now whether its just an exhaustive pause or a reversal, time will tell!
Now that our NIFTY50 index, which is an indicator of Indian stock market health has paused after a steep decline, we may see few stocks too which have witnessed a pause or a reversal after a significant decline.
What kind of a reversal?
There are various reversal patterns in the technical analysis which suggest a discontinuation of the current trend and depict a change in trend. Inverse Head and Shoulders (H&S) is one such bullish reversal pattern which comes after a decline. This pattern formation and its potential breakout suggest a trend reversal.
What is a logic behind Inverse H&S pattern?
To know the logic behind the Inverse Head and Shoulders pattern, first we need to see the downtrend or downward move in the stocks. Stocks mostly do not give a straight downside. Instead, the move is in the form of lower tops and lower bottoms. Let’s see how it looks.
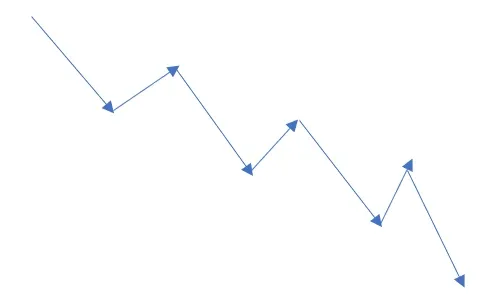
Now when the stock gives a pause to this lower top and lower bottom pattern and breaks the previous lower top, the stock is said to have paused from its current downtrend and is ready for the reversal. In Inverse Head and Shoulders, there exist three conditions; The stock breaks the previous top or reaches the previous top level or the price is still below the previous top suggesting continuation in the downward trend.
Then comes the second condition of the Inverse Head & Shoulders pattern. The share price does not breach the previous bottom, in fact reverses before hitting the previous low, forming a shoulder.
Let’s see how the pattern exactly looks;
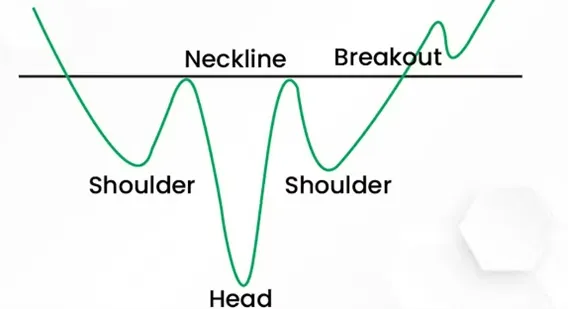
The neckline which is the pattern breakout line can also be upward or downward slanting. Downward slanting works better.
Few other characteristics of this pattern:
- The left shoulder is higher low, middle is lower low and right shoulder is the higher low
- The neckline is a trendline which joins the highs of the two shoulders and one head. When the price breakouts of the pattern we say that the pattern has worked
- The volumes may be initially low during pattern formation and then increase once the right shoulder has formed and during a breakout.
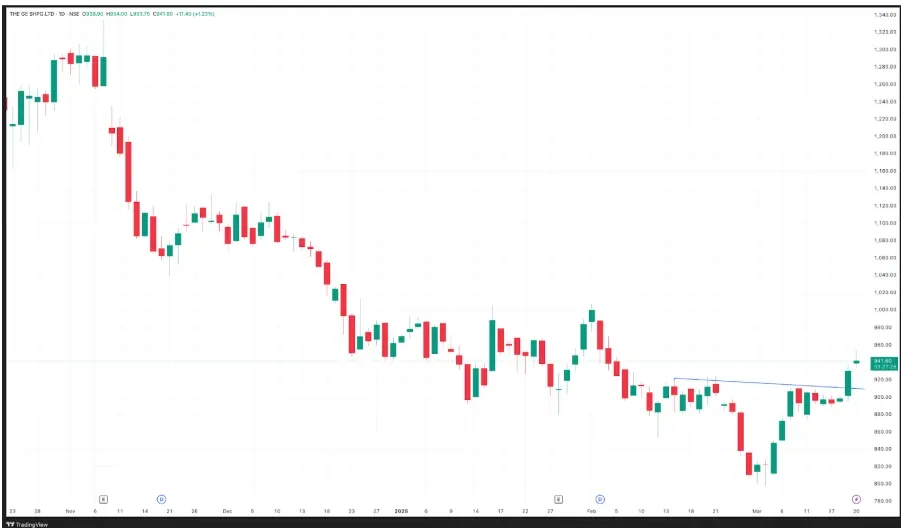
Great Eastern Shipping Company
REC Ltd
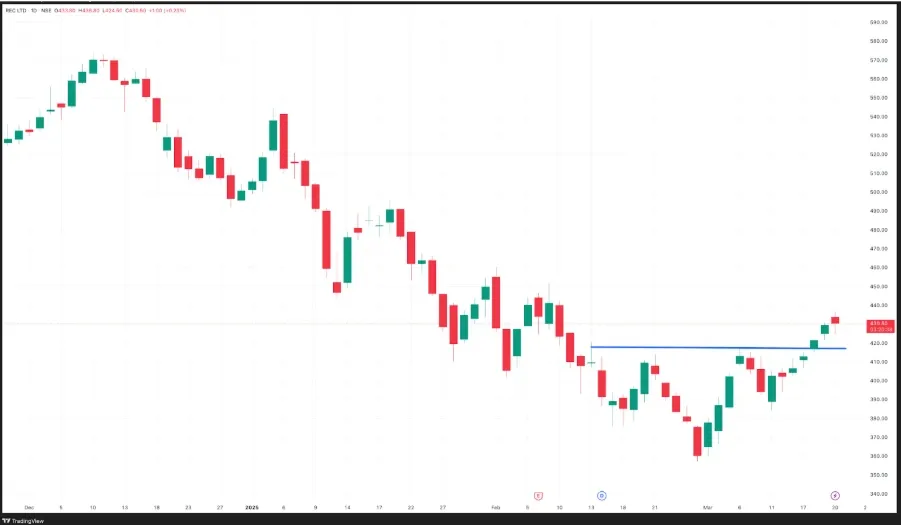
After peaking out near ₹650 levels by hitting twice at the same level during July 2024, the stock declined nearly 45%. Recently at the bottom, the stock has formed an Inverse Head & Shoulders pattern with a breakout near ₹416 levels. REC Ltd shares are up more than 19% so far March 2025.
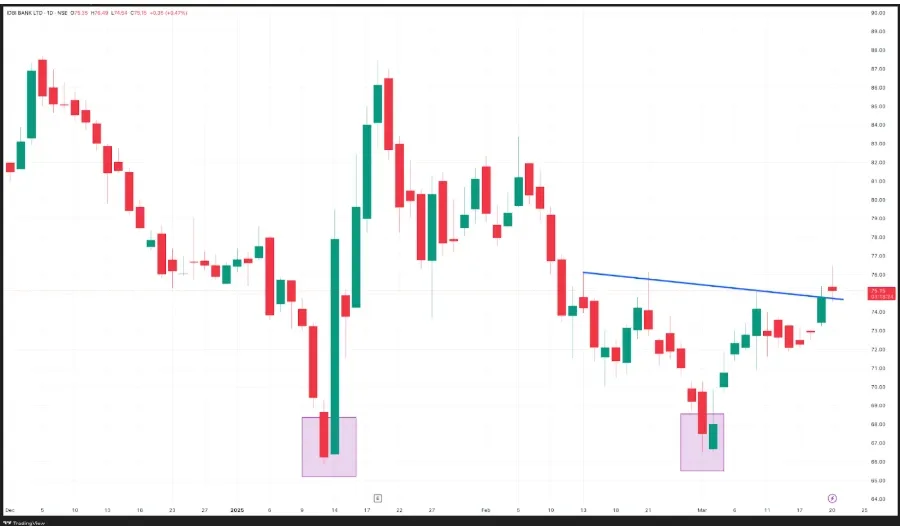
IDBI Bank
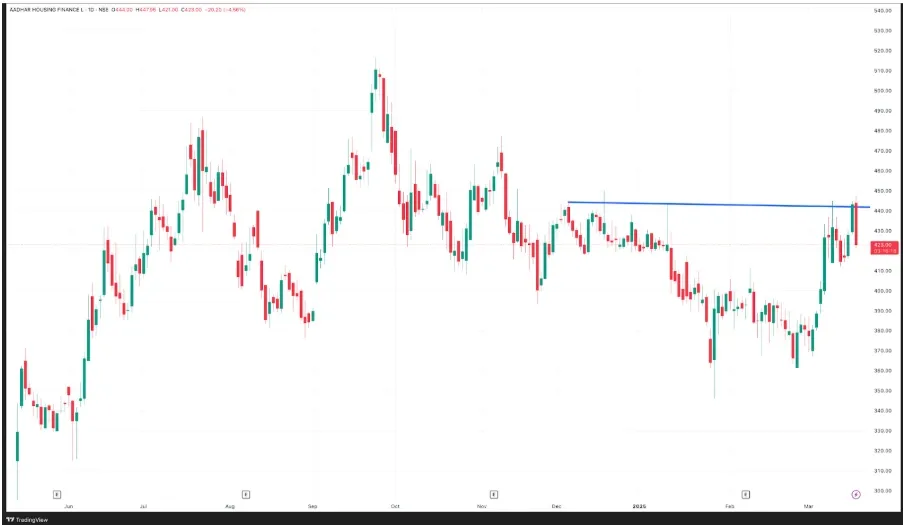
Aadhar Housing Finance
NTPC Ltd
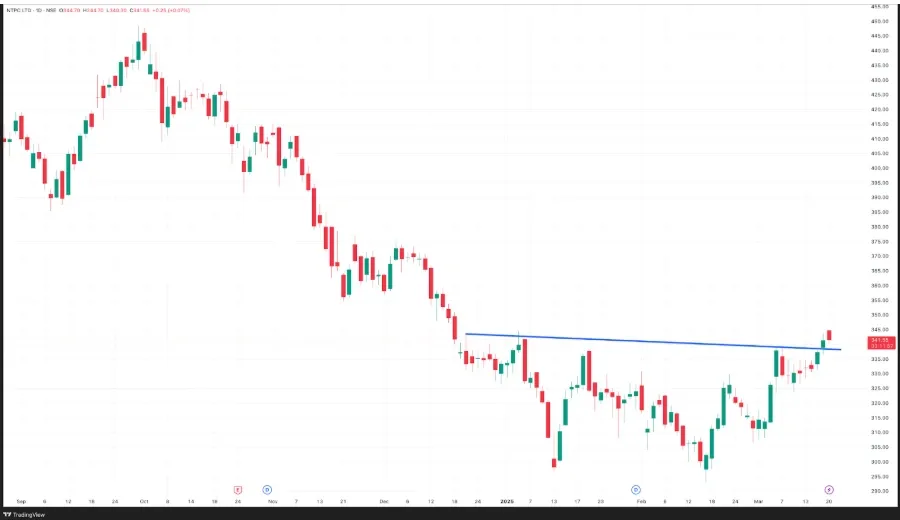
The stock hit a peak near ₹448 levels twice during September end 2024. The stock corrected nearly 35% from its peak and has recently formed an Inverse Head and Shoulders pattern. Recently the stock has given a neckline breakout near ₹339 levels which needs to sustain on closing basis. NTPC Ltd shares are up 9.7% in March 2025.
Investments in the securities market are subject to market risk. Read all the related documents carefully before investing. The stock discussed in this article is only for educational purposes and not a buy or sell recommendation. Investors are advised to conduct their own analysis and risk due diligence before trading and investing in the stock market.
About The Author
Next Story


