Market News
NSE Q2FY27 profit is over 3 times that of BSE: Know which exchange fared better in earnings

6 min read | Updated on November 05, 2026, 15:23 IST

SUMMARY
Leading stock exchanges NSE and BSE have reported their September quarter earnings. NSE remains significantly larger in revenue and profitability, as its revenue rose nearly 2.8 times that of BSE, while net profit was more than 3 times that of BSE’s Q2 net profit.
Stock list
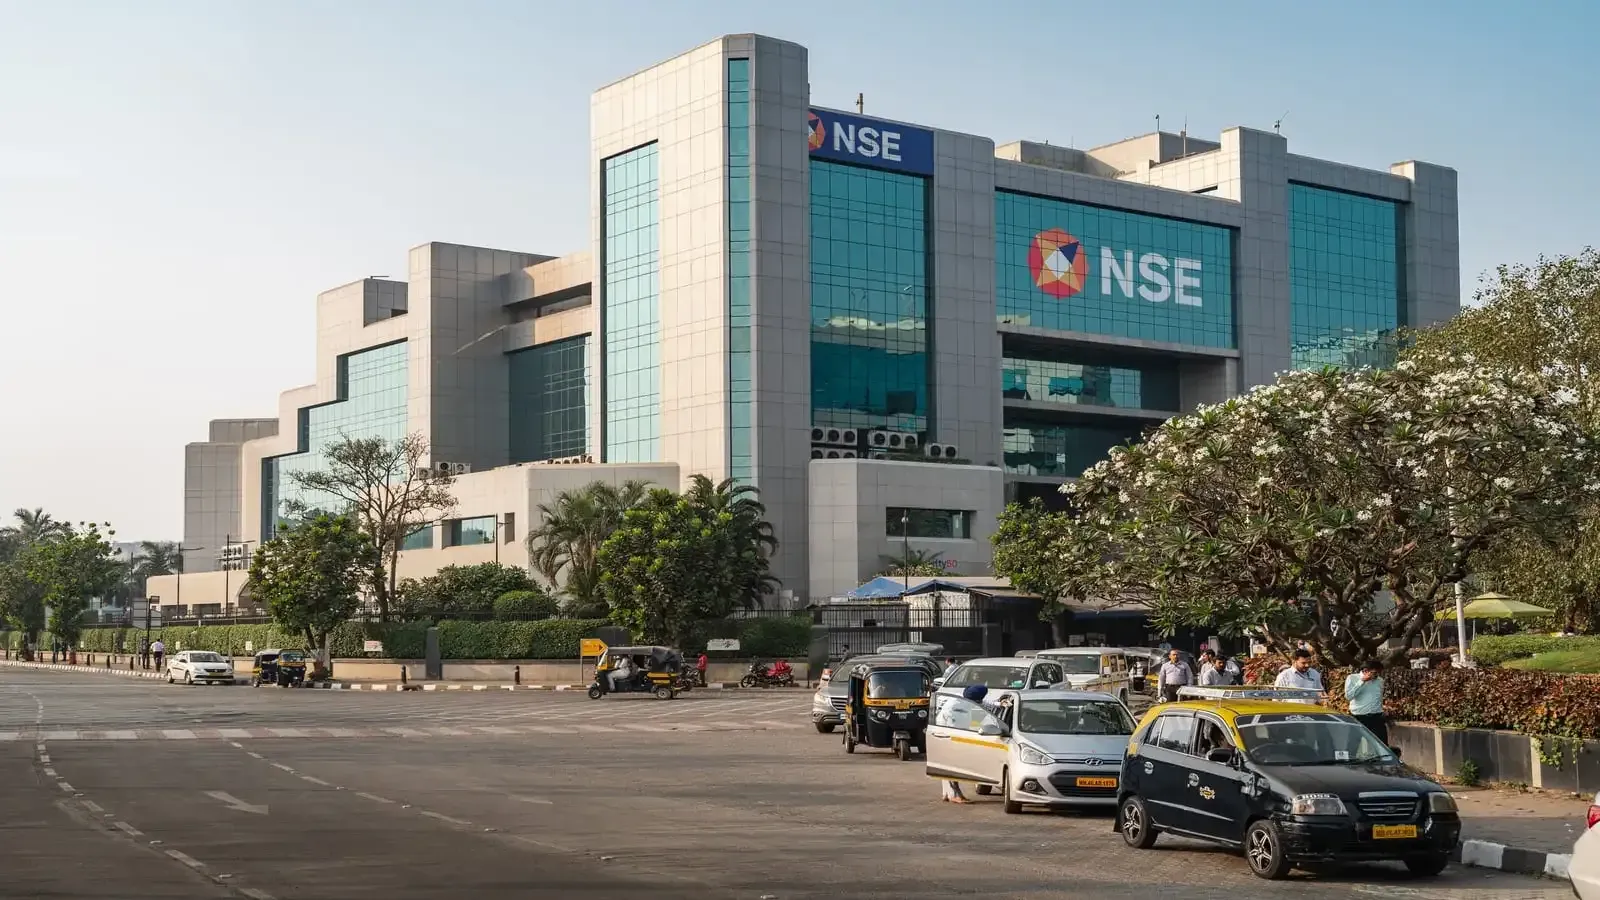
India’s leading stock exchanges, NSE and BSE saw strong investors traction today. BSE shares rose over 6.5% intraday, while NSE shares gained nearly 3%. NSE and BSE stock are on the surge following the quarterly result announcement by these stock exchanges this week.
NSE and BSE together virtually control 100% of the organised stock and derivatives trading market in India. Both companies operate as a duopoly business and compete with each other for market share. NSE shares trade on the BSE, whcih got listed recently on September 24, 2026. Meanwhile, BSE shares joined the NIFTY50 on September 30 replacing Wipro.
NSE vs BSE: Q2FY27 earnings highlights
| Key metric* | NSE | BSE |
|---|---|---|
| Revenue from operations | ₹4,067 crore (11% YoY) | ₹1,432.6 crore (34% YoY) |
| Net profit | ₹2,577.6 crore (23% YoY) | ₹807.5 crore (45% YoY) |
| PAT margin | 76% | 52% |
| Operating EBITDA | ₹3,079 crore (107% YoY) | ₹973 crore (55% YoY) |
- As seen from the above table, NSE continues to dominate in scale and profitability, while BSE is delivering faster revenue and net profit growth.
- During Q2FY27, NSE’s revenue from operations increased by 11% to ₹4,067 crore, while that of BSE rose by 34% to ₹1,432.6 crore. NSE remains significantly larger in revenue and profitability, as its revenue rose nearly 2.8 times that of BSE, while net profit was more than 3 times that of BSE’s Q2 net profit.
- NSE reported a PAT margin of 76%, compared with BSE’s 52%. This means NSE retained around ₹76 as net profit for every ₹100 of revenue, against ₹52 for BSE, reflecting its stronger profit conversion.
- NSE’s operating EBITDA surged 107% YoY to ₹3,079 crore, compared with BSE’s 55% growth to ₹973 crore. NSE’s EBITDA growth was substantially stronger than its revenue growth.
- Average daily options premium turnover fell 25% at NSE and about 24% at BSE from the previous quarter. NSE Q2FY27 revenue breakdown
NSE Q2FY27 revenue breakdown
| Revenue stream | Q2FY27 | Q2FY26 | YoY change |
|---|---|---|---|
| Transaction charges | 3,035 | 2,789 | 9% |
| Listing services | 150 | 88 | 70% |
| Data center rack charges | 60 | 49 | 24% |
| Data connectivity charges | 267 | 293 | -9% |
| Data feed and terminal services | 165 | 115 | 43% |
| Licensing services | 40 | 37 | 6% |
| Clearing and settlement services | 73 | 55 | 32% |
| Operating investment income | 237 | 217 | 9% |
| Other operating income | 41 | 33 | 24% |
| Total operating revenue | 4,067 | 3,677 | 11% |
Transaction charges from options trading rose by 6% to ₹2,216 crore. Weekly Nifty options brought in ₹1,699 crore. This is approximately 42% of NSE’s operating revenue for the quarter. Transaction charges from monthly stock options rose 22% YoY to ₹332 crore, while other Index options generated ₹185 crore.
Transaction charges in the cash segment rose by 30% YoY to ₹474 crore, while those of futures declined by 3% YoY to ₹328 crore.
BSE Q2FY27 revenue breakdown
| Revenue stream | Q2 FY27 | Q2 FY26 | YoY change |
|---|---|---|---|
| Transaction charges | 1,127.8 | 794.0 | 42% |
| Services to corporates | 165.9 | 138.5 | 19.8% |
| Treasury income on clearing and settlement funds | 36.5 | 42.8 | -14.7% |
| Other operating income | 102.4 | 93.2 | 9.9% |
| Total operating revenue | 1,432.7 | 1,068.5 | 34.1% |
Transaction charges rose 42% YoY to ₹1,127.8 crore, about 79% of BSE’s operating revenue for the quarter. Services to corporates accounted for about 12% of operating revenue during the September quarter.
Equity-derivatives activity explains most of BSE’s recent revenue growth. Revenue from this segment increased to ₹951.9 crore from ₹624.2 crore a year earlier. Meanwhile, Average daily premium turnover was up 50.2% YoY to ₹22,530.7 crore.
NSE and BSE report sequential slowdown
NSE’s average daily options premium turnover for the September quarter was 25% less than in the quarter ended June 2026. BSE’s average daily options premium turnover for the same period was about 24% less than in the quarter ended June 2026.
The sequential slowdown coincided with the introduction of SEBI’s closing auction session (CAS) on August 3, 2026. CAS determined closing prices for stocks with derivatives contracts, and those prices also fed into derivatives expiry settlement. SEBI’s October 15 circular shifts expiry settlement to a volume-weighted average price (VWAP) basis using the last 30 minutes of continuous cash-market trading, effective December 7, 2026.
NSE had a 92% market share in the cash segment and a 68% share in the equity-options segment during the quarter. BSE’s calculated share of the two exchanges’ combined options premium turnover rose to 32.0% from 24.4% a year earlier. However, it was only slightly above the 31.5% recorded in Q1 FY27, suggesting that the pace of market-share gains had moderated.
Decreased trading activity negatively impacted both exchanges. Net profit of NSE fell 17% and operating revenue declined 11% compared with the previous quarter. For BSE, operating revenue dropped 8.5% and net profit declined 7.5% in the same period. The transaction fee decline was partly offset by an increase in revenue from corporate services at BSE.
In absolute terms, NSE remained ahead of BSE in terms of revenue and profitability, with more than three times BSE’s profit and a higher net profit margin. Meanwhile, BSE’s faster revenue growth came largely from equity derivatives, which accounted for about 90% of the increase in its operating revenue.
About The Author
Next Story