Market News
NIFTY IT bounces back, is it a reversal or worst is yet to come? Here is what chart suggests

3 min read | Updated on February 26, 2026, 10:50 IST


SUMMARY
NIFTY IT index has seen the worst monhtly loss in the history as it fell 19% in February till date. The technical charts for the NIFTY IT index shows oversold signals, indicating the index could stabalise here before it decides the further direction.

The monthly RSI level for NIFTY IT index, indicates a support at 39, which was previously tested in Covid-19 crash. Image: Shutterstock.
The NIFTY IT index is trading in green for the first time in six trading sessions. The index has fallen more than 23% from the 03r February high levels touched after tariffs on India were reduced to 18% by the US. However, AI led fears gripped the software services companies as new models by Anthropic AI’s Claude AI made far reaching breakthroughs in the technology space. Since then the IT stocks have seen a brutal selloff across categories. The NIFTY IT index witnessed worst day on 04th February by slumping 5.8% in a single trading session. The selloff continued as investors assessed their long term bets on the IT companies as the newer AI models threatened to make the existing business model obsolete.
The stocks extended the fall on Tuesday after a private research report by Citrini Research claimed dystopian scenario for software companies if the AI progresses ahead as envisaged. On the other hand, the Anthropic on Tuesday also announced partnering with Salesforce, Thomson Reuters and FactSet on developing plugins in the areas of human resources, financial analysis, equity research and others. It also added plugins on Microsoft Excel and Powerpoint, prompting that the AI is tool to complement the existing platforms to increase the productivity and output.
The development has spurred investor interest back into the software industry as Salesforce shares jumped 4% on Tuesday. Taking cues from this development, the NIFTY IT index has also jumped over 3% on Wednesday, recouping partial losses of Tuesday. After today’s recovery, will the bounce back sustain or is it just a pause in the bigger correction? Here is what charts suggest.
Monthly charts
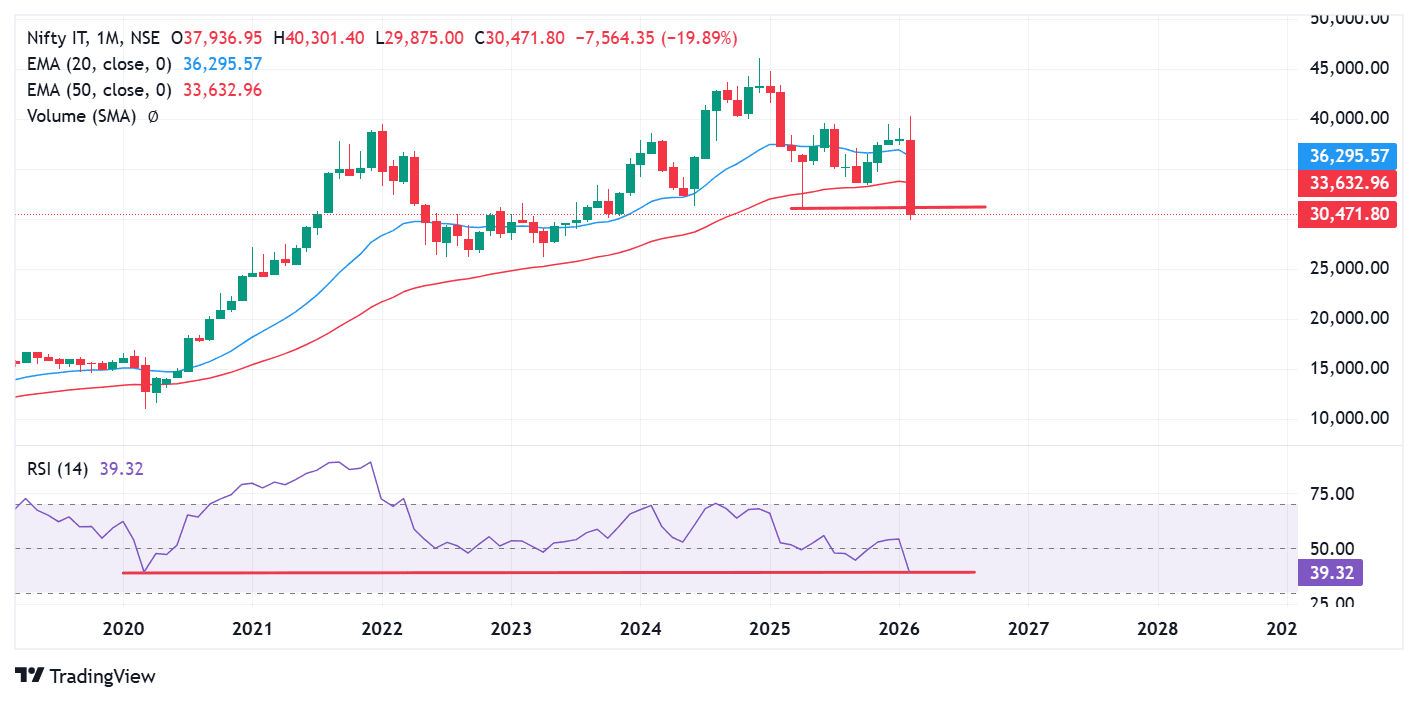
Lets consider the longer picture first. On the monthly charts, NIFTY50 is now trading at the lows of April 2025, which was touched on the aftermath of tariff announcements last year. The long term and institutional investors will closely monitor this level of 30,479 on the monthly closing basis. If the index closes above the 30,479 levels on monthly closing basis, it would then form a double-bottom pattern, which could signal a reversal from the current trend.
Additionally, the index trades at the monthly RSI of 39.3, which was previously touched during the Covid crash lows in March 2020. This indicates the index is trading in the oversold territory in the longer time-frame charts. A bounce back from the current levels and positive closing for the next month could stabilise the prices for IT stocks, before it charts the direction for the further upmove.
Weekly charts
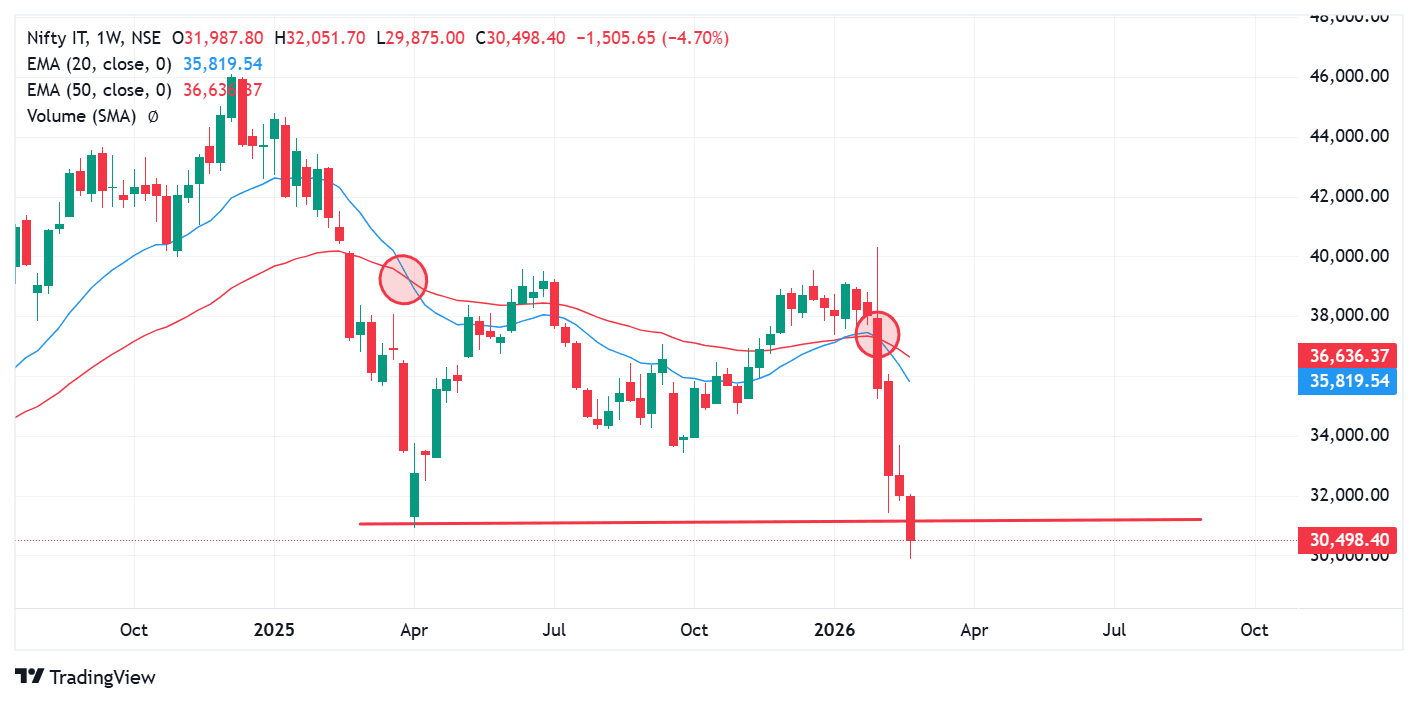
On the weekly charts, the index witnessed a negative crossover of 20 EMA crossing the 50 EMA from above, which resulted in a nearly 20% in four weeks. The index has previously witnessed similar setup in March 2025, after which the index bounced back. During the March 2025 fall, the index was 20% away from the 20 and 50 EMA signalling wide gap between averages and price, in the following month, the index bounced back to touch the moving averages. Fundamentally, the price and averages cannot stay away for too long, they bounce back in the case of sharp correction and fall in the case of sharp rally.
Experts believe, in the current scenario the index could witness similar trend as the current price is nearly 20% away from the key moving averages.
About The Author
Next Story


