Market News
HDFC Bank Q1 results | How to trade in HDFC Bank ahead of its Q1 earnings?
.png)
4 min read | Updated on February 12, 2026, 13:54 IST


SUMMARY
Shares of HDFC Bank are broadly trading within a symmetrical triangle pattern on the weekly chart and forming a bearish flat and pole pattern on the daily chart. Traders can monitor both of these patterns to gain insight into planning a directional or non-directional strategy. Meanwhile, the options market is pricing in a move of ±3.6% ahead of the 25th July expiry.
Stock list
Will HDFC Bank break out or hover in a symmetrical triangle pattern?
Experts believe that HDFC Bank could report mixed results for the June quarter. The bank's standalone profit after tax (PAT) could grow by 29%-30% year-on-year, in the range of ₹15,500 crore to ₹15,800 crore. However, it may decline by 2%-3% quarter-on-quarter (QoQ) basis. In the previous quarter (Q4FY24), the bank reported a net profit of ₹16,512 crore.
Additionally, HDFC Bank's net interest income (NII) may remain flat on QoQ basis between ₹29,500 crore to ₹30,000 crore due to slow loan and deposit growth. Net interest margins (NIMs) may also see a slight contraction.
Earlier this month, HDFC Bank, in its Q1FY25 business update, reported that it gross advances declined by 0.8% QoQ and CASA deposits slipped 5% on QoQ basis.
Investors and traders will be watching the Q1 results closely for insights on business growth and management commentary. Ahead of its results, HDFC Bank shares are trading 0.2% lower at ₹1,611 as of 11:30 am on Friday. However, the stock is down more than 5% since the beginning of the year.
Technical view
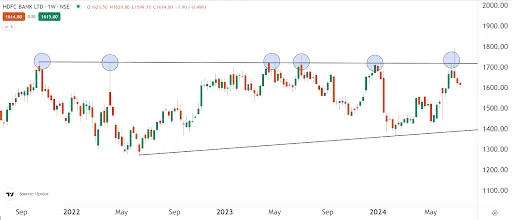
Since October 2021, the HDFC Bank has been broadly trading in a range inside the symmetrical triangle pattern on the weekly chart. A symmetrical triangle is a chart pattern formed by two converging trend lines connecting a series of sequential peaks and troughs. These trendlines create a shape resembling to triangle and indicate a period of consolidation before price breakout in either direction.
As seen on the weekly chart below, HDFC Bank has faced six rejection, including the recent July 2024 from the pattern’s upper trendline. In addition, the stock has fallen over 10% from its recent all-time high following the formation of the bearish reversal shooting star pattern, formed in the first week of July.
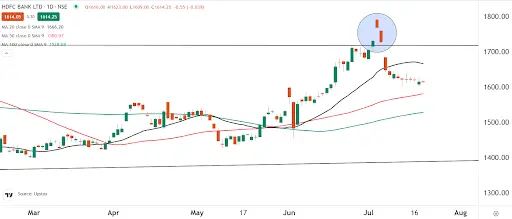
For further directional clues, traders can monitor the daily chart of the HDFC Bank as it consolidates between its 20 and 50 day moving averages and is forming a small bearish pole and flag pattern. A break of this range will provide traders further directional clues.
Options overview
The current open interest (OI) build-up of the 25 July expiry has the highest call base at 1,700 strike, indicating that the stock may face resistance around this level. On the other hand, the highest put OI is placed at 1,600 strike.
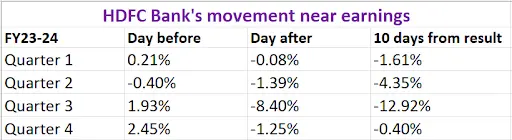
Before diving into strategies, let's review HDFC Bank’s share price movements arround its earnings announcements over the last four quarters.
Options strategy for HDFC BANK
With the options market expecting a price movement of ±3.6% before 25 July expiry, traders can consider Long and Short Straddle strategies to capitalise on the expected volatility.
Derivatives trading must be done only by traders who fully understand the risks associated with them and strictly apply risk mechanisms like stop-losses. The information is only for educational purposes. We do not recommend any particular stock, securities and strategies for trading. The stock names mentioned in this article are purely for showing how to do analysis. Take your own decision before investing.
About The Author
Next Story


