Market News
Maruti Suzuki Q1 results preview: Net profit likely to decline, revenue expected to remain flat; check key technical levels
.png)
4 min read | Updated on July 30, 2025, 07:36 IST


SUMMARY
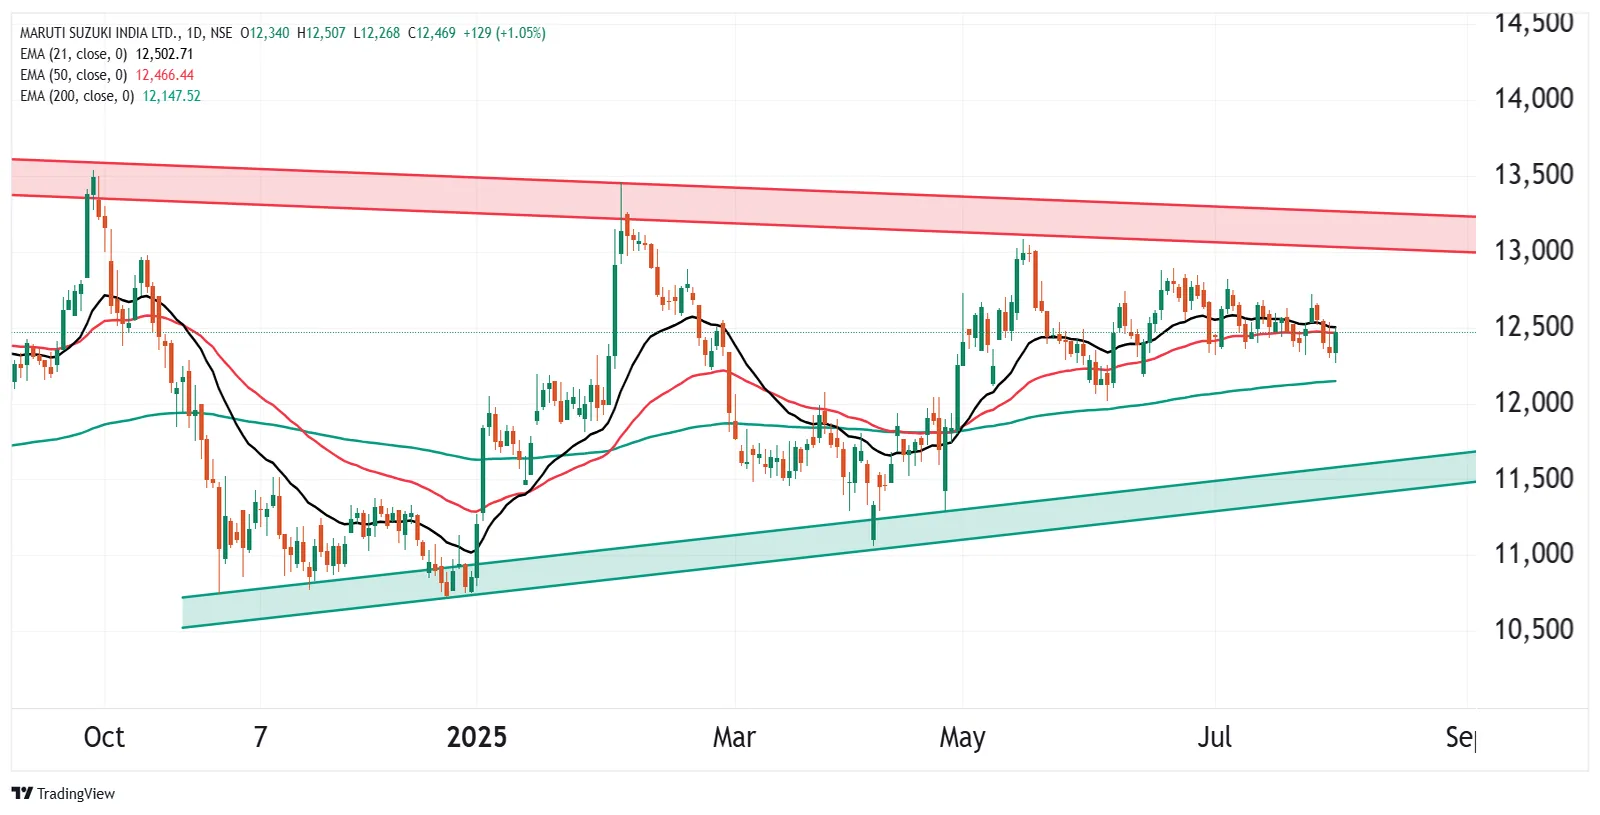
Maruti Suzuki’s stock has been consolidating between its all-time high of ₹13,680 and key support at ₹10,750 since 2024, forming a symmetrical triangle pattern on both weekly and daily charts. Traders should watch the ₹12,750–₹12,300 range for short-term direction, as a closing breakout from this zone may signal the next move.
Stock list

Maruti Suzuki technical structure remain rangebound between its all-time high (₹13,680) and the crucial support zone of ₹10,750.
Maruti Suzuki India, the automobile giant, is set to announce its Q1 FY26 results on 31 July 2025. The Wagon-R car manufacturer is expected to report mixed quarterly earnings, with a drop in net profit and marginal growth in revenue.
According to experts, Maruti Suzuki's revenue could increase by 1–3% year on year (YoY) to ₹36,470–₹36,660 crore, while its net profit could decline by 9–15% YoY to ₹3,110–₹3,150 crore. The decline in quarterly profit is mainly due to subdued sales volumes, with Maruti's quarterly sales rising by just 1.1% YoY to 5,27,000 vehicles during the June quarter. Meanwhile, price hikes and the early onset of the monsoon season are likely to have impacted showroom footfall.
Maruti Suzuki reported standalone revenues of ₹35,531 crore in Q1 FY25 and ₹40,674 crore in the previous quarter. Its net profit stood at ₹3,650 crore in the same quarter of the previous fiscal year and ₹3,711 crore in Q4 FY25. The EBITDA margin for the June quarter is expected to contract by 180–210 basis points due to a rise in marketing and advertising expenses.
Investors will be watching the management's comments on the outlook for demand and its impact on vehicle production, especially in light of the supply chain crisis caused by a shortage of rare-earth magnets. Updates on new car launches will also be closely monitored.
Ahead of the Q1 results announcement, shares of Maruti Suzuki ended Tuesday's session at ₹12,469, up 1%. So far this year, Maruti Suzuki shares have risen by over 11.4%.
Technical view
The technical structure of the Maruti Suzuki remains rangebound and is consolidating between its all-time high (₹13,680) and the crucial support zone of ₹10,750 since 2024. It is forming a symmetrical triangle pattern on the weekly and daily chart.
It is a chart formation in which converging trendlines connect a series of lower highs and higher lows, forming a triangle shape. This pattern suggests a period of price consolidation before a potential breakout occurs in either direction.
For short-term clues, traders can also monitor the range of ₹12,750 and ₹12,300. A break of this range on a closing basis will provide further directional insights.
Options outlook
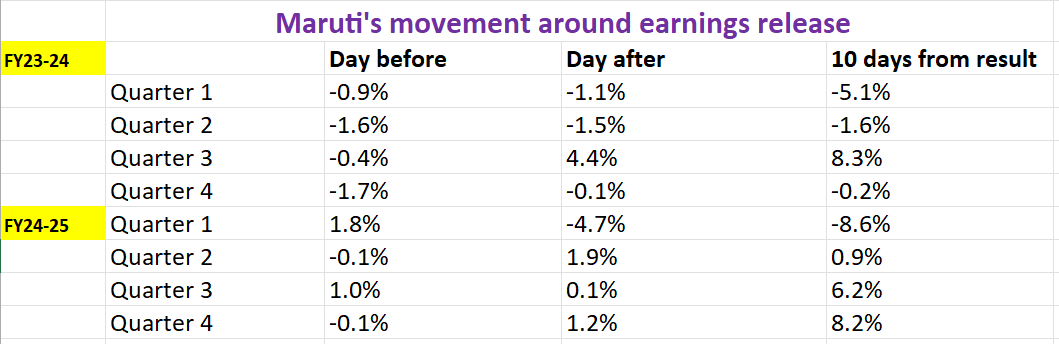
Let's take a look at how Maruti Suzuki’s stock has performed during the past two years around earnings announcement.
With the options market projecting a ±5.1% move ahead of the 28 August expiry, traders might look at employing both long and short Straddle strategies to take advantage of the expected volatility and possible price fluctuations.
In a long straddle, you purchase both an at-the-money (ATM) call option and an ATM put option for Maruti Suzuki, using the same strike price and expiry date. This approach profits when the stock price moves well beyond ±5.1% in either direction, allowing gains from significant upward or downward price swings.
Conversely, a short straddle involves selling an ATM call and put option on Maruti Suzuki with the same strike price and expiry date. This strategy is profitable if the stock price remains stable, moving less than ±5.1% prior to expiry. The limited price movement enables the seller to retain the premiums collected.
For range breakout, traders can consider directional spreads like bull put spreads or bear call spreads. These strategies allow traders to align their positions with their expectations for both price direction and volatility, helping manage risk and potential return.
Disclaimer:
Derivatives trading must be done only by traders who fully understand the risks associated with them and strictly apply risk mechanisms like stop-losses. The information is only for educational purposes. We do not recommend any particular stock, securities and strategies for trading. The stock names mentioned in this article are purely for showing how to do analysis. Take your own decision before investing.
About The Author
Next Story


