Market News
Kalyan Jewellers Q1 results: Revenue likely to see double-digit growth; check earnings preview and key technical levels
.png)
4 min read | Updated on August 07, 2025, 08:57 IST
SUMMARY
Kalyan Jewellers is set to report its Q1 FY26 results on 7 August. Revenue is expected to show double-digit growth, driven by demand for festive and wedding purchases. Although shares have fallen by over 21% year to date, they are trading firmly ahead of the results, supported by a symmetrical triangle setup. The next move may be defined by a breakout above ₹620 or a breakdown below ₹580.
Stock list

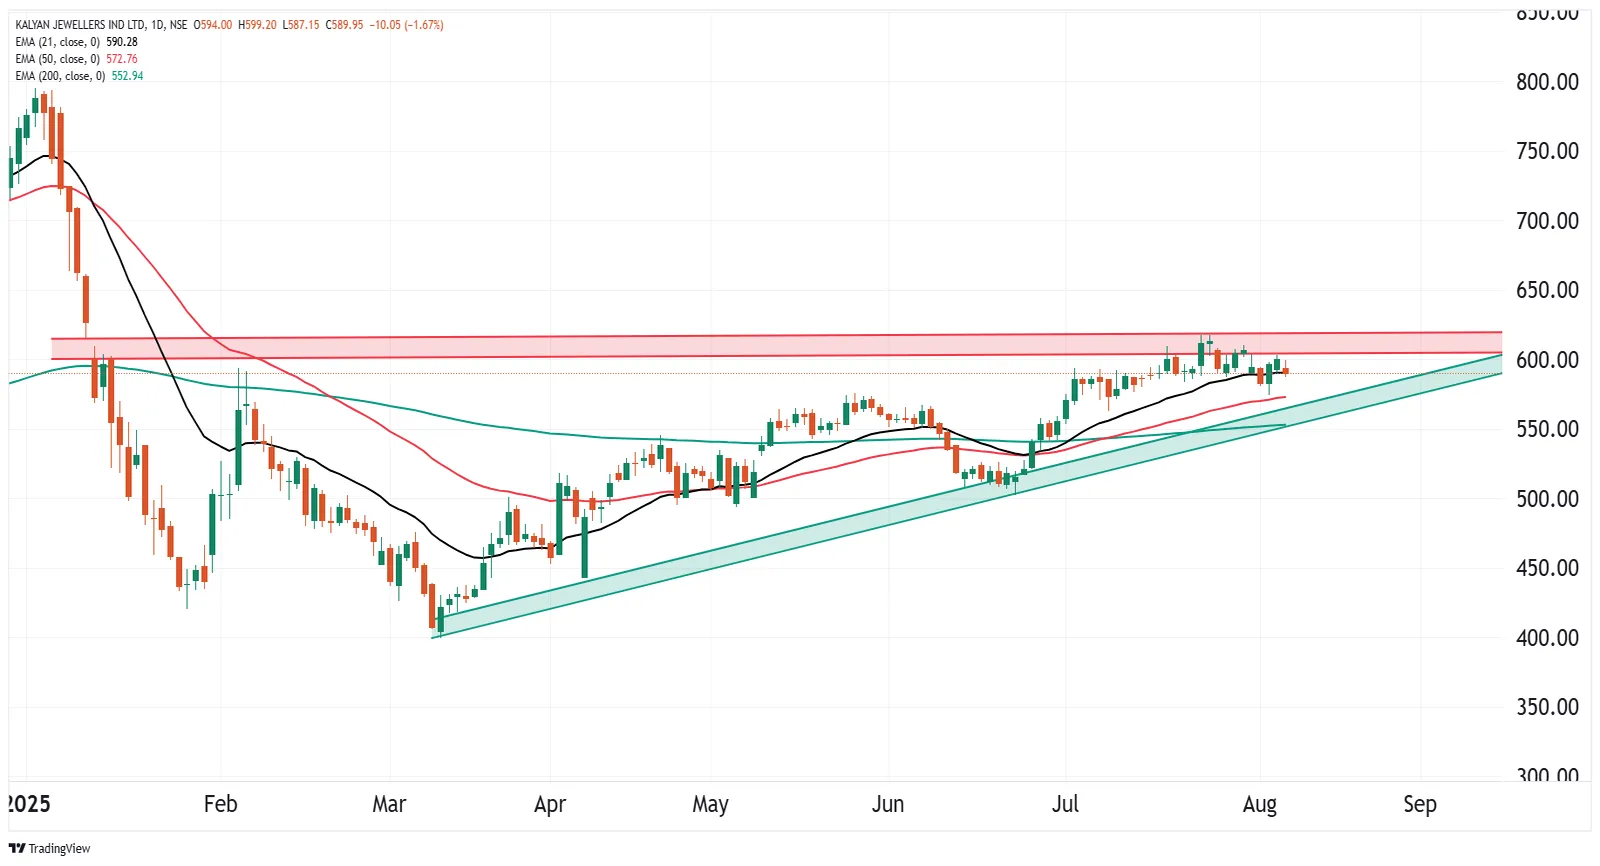
Kalyan Jewellers is trading within a symmetrical triangle pattern, respecting both support and resistance trendlines.
Kalyan Jewellers, a jewellery retail chain operator, will announce its results for the June quarter on 7 August 2025. The company is expected to report double-digit revenue growth in Q1, as indicated by the quarterly business updates.
According to Kalyan Jewellers' quarterly business numbers, the company witnessed revenue growth of 31% year-on-year in its India operations in Q1 FY26, mainly due to robust demand during Akshaya Tritiya and the wedding season. Despite volatility in gold prices due to geopolitical tensions, same-store sales growth was approximately 18%. Kalyan Jewellers launched 10 new showrooms in India, bringing its total store count to 406 (Kalyan India: 287; Kalyan Middle East: 36; Kalyan USA: 2; Candere: 81).
In the Middle East, revenue growth was approximately 26% year on year. According to the company, its international business operations contributed around 15% to overall consolidated revenue. Meanwhile, the digital-first jewellery platform Candere, owned by Kalyan Jewellers, recorded revenue growth of around 67% during the same period, thanks to a significant improvement in showroom footfall and web traffic.
In FY26, the company plans to launch 170 showrooms across the Kalyan and Candere formats (90 Kalyan and 80 Candere in India).
In the June quarter (Q1 FY25), Kalyan Jewellers registered a consolidated net profit of ₹178 crore, while revenue from operations stood at ₹5,535 crore. In Q4FY25, the company reported revenue of ₹6,182 crore and a net profit of ₹188 crore.
Investors will be keen to hear management's commentary on the demand outlook during the quarterly results announcement, especially given that gold prices are trading near record highs. There has been growth in same-store sales numbers.
Ahead of the Q1 results announcement on 6 August, Kalyan Jewellers shares are trading 1% lower at ₹590. They have delivered a negative return to investors in 2025, falling by over 21% year-to-date.
Technical view
Kalyan Jewellers is trading within a symmetrical triangle pattern, respecting both support and resistance trendlines. Despite testing the upper resistance zone near ₹615–₹620, it failed to break out decisively. The stock is now hovering around its 21-EMA and remains above the 50- and 200-EMA. A breakdown below ₹580 could weaken the structure, while a close above ₹620 may trigger fresh upside.

Options outlook
For the 29 August expiry, the highest open interest build-up is seen at the 600 strike for both calls and puts, suggesting a potential consolidation around this level. Currently, the at-the-money 590 strike is priced at ₹44 for both call and put options, implying an expected move of approximately ±7.5% by expiry. To gauge whether such a move is likely, we’ll examine Kalyan Jewellers’ price behaviour around its past six quarterly results.

Options strategy for Kalyan Jewellers
The implied move of ±7.5% opens up opportunities for both volatility and directional trades. Traders expecting a significant price swing can opt for a Long Straddle, buying both call and put options of the same strike and expiry. The strategy benefits if Kalyan Jewellers move beyond the implied range of ±7.5%.
Meanwhile, those anticipating limited movement may consider a Short Straddle, which benefits if the stock stays within the ±7.5% band post-earnings.
For directional traders, a Bull Call Spread may be ideal if a breakout from the symmetrical triangle is expected, while a Bear Put Spread suits those expecting a breakdown below the trendline connecting swing lows of June and April.
Disclaimer:
Derivatives trading must be done only by traders who fully understand the risks associated with them and strictly apply risk mechanisms like stop-losses. The information is only for educational purposes. We do not recommend any particular stock, securities and strategies for trading. The stock names mentioned in this article are purely for showing how to do analysis. Take your own decision before investing.
About The Author
Next Story

