Market News
ITC Q2 results: Revenue, net profit likely to see modest growth; Check options strategy and key technical levels
.png)
3 min read | Updated on October 30, 2025, 09:39 IST


SUMMARY
Diversified conglomerate ITC will announce its second-quarter results on 30 October 2025, with analysts expecting a tepid performance. Investors will watch for management commentary on demand trends and the GST transition’s impact on margins.
Stock list
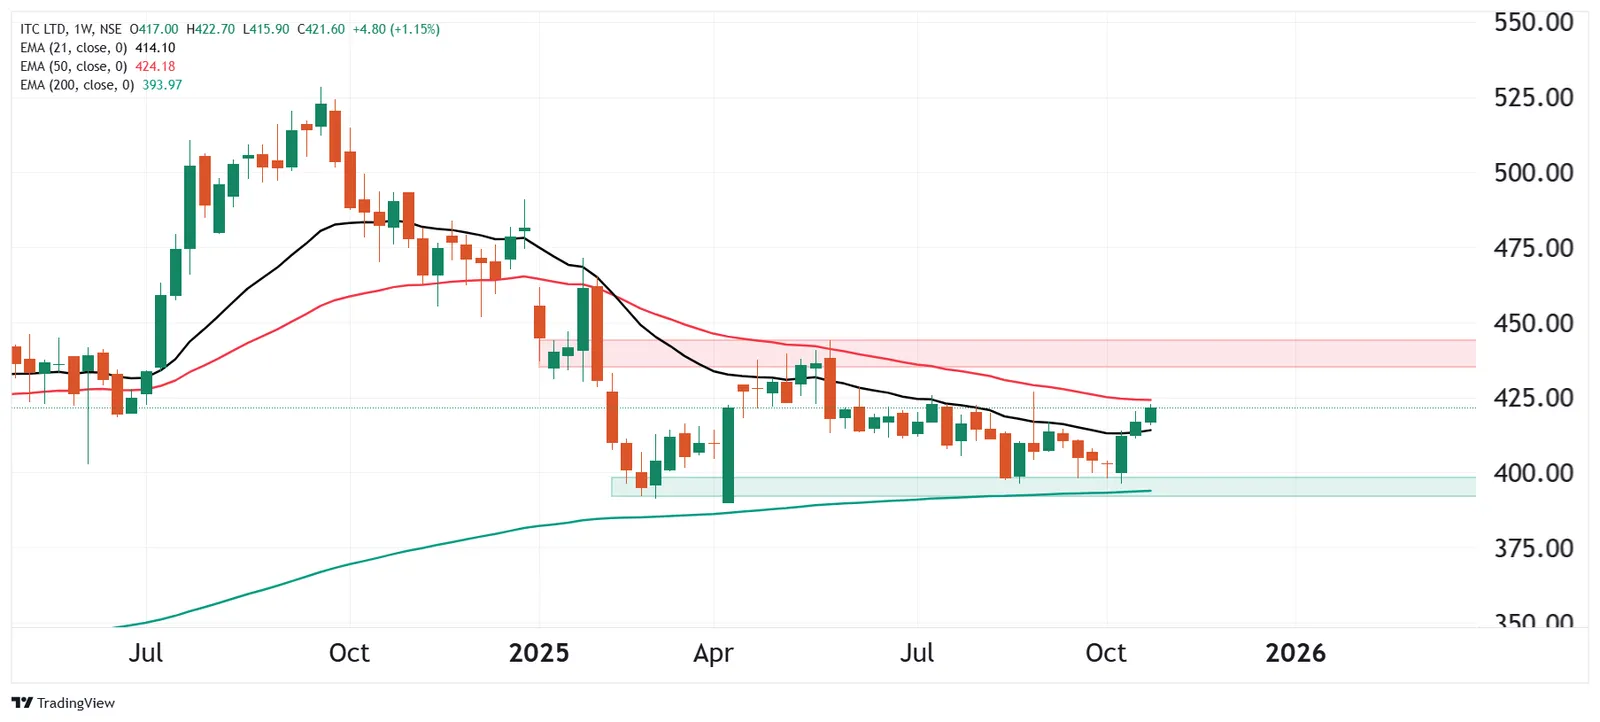
ITC weekly chart indicates a steady recovery from the support level around ₹395–₹400
The diversified conglomerate ITC is set to unveil its second-quarter results on 30 October 2025. The consumer goods giant is expected to report mixed earnings, with revenue and net profit growth in the low single digits.
Experts believe ITC could report standalone revenue growth of between 4% and 6%, rising from ₹19,690 crore to ₹19,875 crore, led by higher growth in the agricultural business and increased cigarette sales. In the same quarter last year, ITC reported revenue of ₹18,649 crore.
Meanwhile, ITC's net profit could rise by 1–3% year-on-year (YoY), reaching ₹5,130–5,210 crore, aided by moderating inflation in raw material prices. The company registered standalone net profit of ₹5,078 crore and ₹4,912 crore in Q2FY25 and the previous quarter, respectively.
During the results announcement, investors will closely monitor revenue and volume growth across different business segments, such as FMCG, cigarettes, and agribusiness. Additionally, they will be looking for management commentary on demand and overall consumption, especially in the wake of the GST rate cut. Investors are also looking forward to the impact of the GST transition on the company’s revenue and profitability.
Ahead of the Q2 results announcement, ITC shares ended the session at ₹421, up 1%. So far this year, ITC shares have fallen by 12%.
Technical view
ITC’s weekly chart indicates a steady recovery following testing of the support level around ₹395–₹400, which coincides with the 200-week exponential moving average (EMA). Over the past few weeks, the stock has formed a higher low pattern and is now trading above the 21-week EMA (₹414), signalling a short-term revival in momentum.
However, the immediate resistance zone lies between ₹425 and ₹440, where the 50-week EMA is located. Sustained trading above this level could confirm a trend reversal and open the way towards the ₹455–₹460 region. Conversely, the ₹400–₹395 region remains a strong area of support. Closing below this level would negate the positive bias and invite renewed selling pressure.
Options outlook
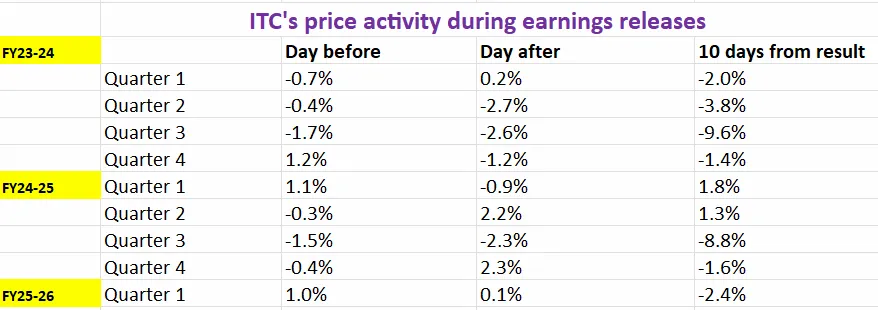
ITC's at-the-money (ATM) strike price for 25 November expiry is 422.5, with both call and put options priced at ₹13.6. This implies that traders are anticipating a price movement of approximately ±3.2%. Before planning options strategies, let's examine ITC’s historical price behaviour during past earnings announcements.
Options strategies for ITC
With the options market implying a potential move of about ±3.2% by 25 November, traders may wish to consider straddle strategies in order to capitalise on their expectations of volatility.
A long straddle involves buying an at-the-money (ATM) call and put option of ITC with the same strike price and expiry date. This strategy is beneficial if the stock price moves sharply — up or down — beyond the implied range of ±3.2%, as gains on one option will outweigh losses on the other.
Conversely, if you expect ITC to remain within a tight range and the actual movement to stay below the implied range by expiry, you may wish to consider a short straddle. This involves selling an ATM call and put option with the same strike price and expiry date. Profits are made from time decay and a drop in volatility, provided the stock remains within a certain range.
About The Author
Next Story


