Market News
Wipro Q1 earnings: Profit growth, deal wins, revenue guidance and symmetrical triangle signal
.png)
3 min read | Updated on July 17, 2025, 11:22 IST


SUMMARY
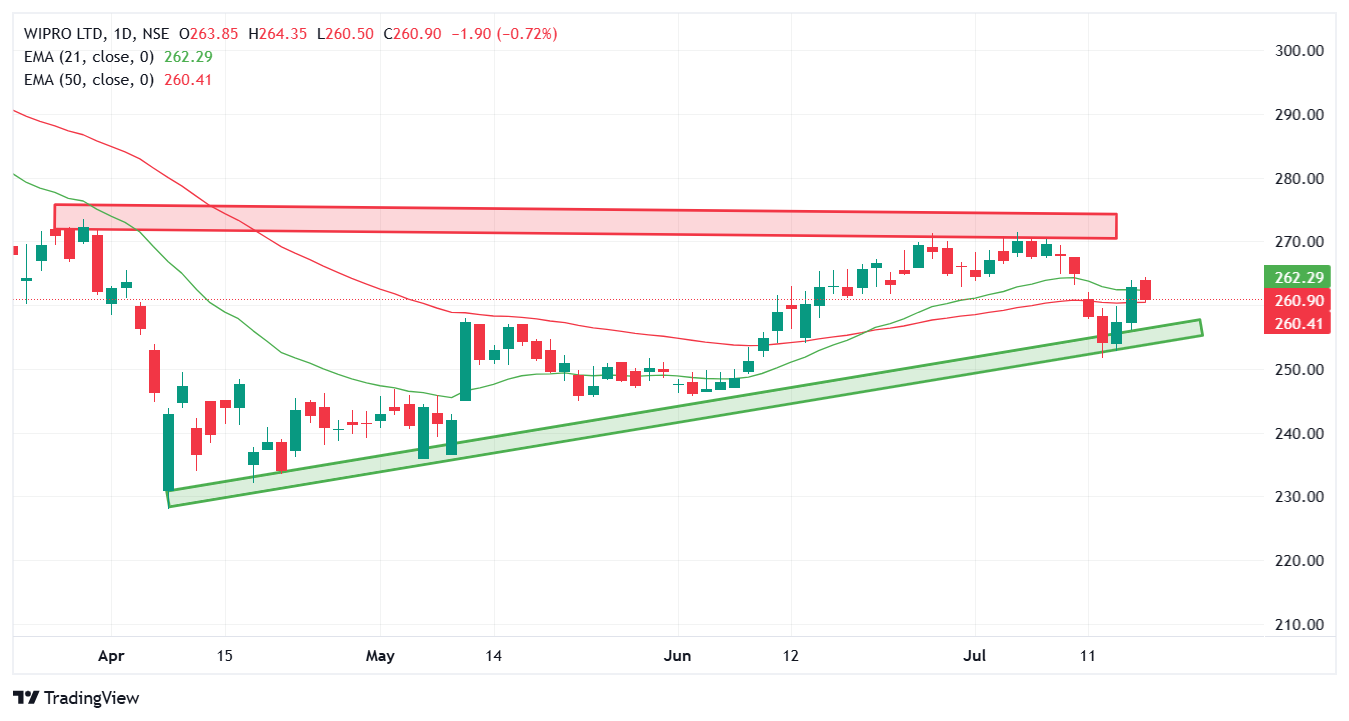
The technical structure of Wipro remains rangebound and is trading below its 200-day exponential moving average. Additionally, the stock is forming a symmetrical triangle pattern on the daily chart. A breakout or breakdown of this pattern will provide further directional clues.

Wipro is headquartered in Bengaluru. Srini Pallia is the current CEO of the IT services firm. | Image: Shutterstock
IT major Wipro will announce its June quarter earnings today after market hours. The company is expected to report lower-than-expected earnings in line with its peers.
According to experts, Wipro's Q1 revenue could remain in the range of ₹22,050 to ₹22,210 crore, up 0-1.5% YoY. Sequentially, revenue could drop marginally. The company registered revenues of ₹22,504 crore in Q4FY25 and ₹21,964 crore in the same quarter last year.
Meanwhile, its consolidated net profit could increase by 7-8% YoY to ₹3,210 to ₹3,350 crore but could remain 7-10% lower sequentially. Wipro reported a net profit of ₹3,588 crore in Q4FY25 and ₹3,037 crore in the June quarter of FY25. Wipro's EBIT margin is expected to remain flat in the range of 17% to 17.6% during the quarter.
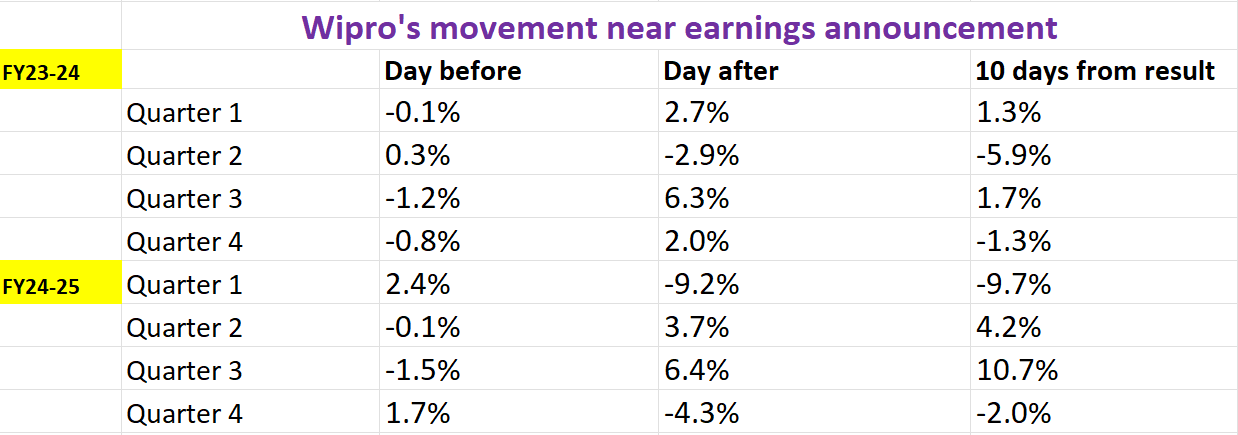
During the result announcement, investors will closely track Wipro's revenue growth guidance for upcoming quarters, new deal wins and management’s commentary on business outlook amid U.S. tariffs.
Ahead of its result, Wipro ended Wednesday’s session 2% higher at ₹263. So far this year, Wipro shares are down 13%, along with other IT stocks, amid uncertainty around U.S. trade tariffs.
Technical view
The technical structure of Wipro remains sideways to bullish and is forming a symmetrical triangle pattern on the daily chart. However, the stock is trading below its crucial support zone of 200-day exponential moving average (EMA), indicating weakness.
Options outlook
The open interest data of the July 31st expiry saw a significant call open interest base at 270 strike, indicating resistance for the stock around this zone. Conversely, the put base was seen at 250 strike with relatively low volume, hinting at minor support for the stock around this level.
Options strategy for Wipro
Based on options data suggesting a potential price movement of ±5.3%, traders have the opportunity to engage in either a long or short volatility strategy.
For those looking to capitalise on the expected volatility, the Long Straddle strategy is appropriate. This involves buying both an at-the-money (ATM) call and put option with the same strike price and expiry of Wipro, with the aim of profiting from a move of more than ±5.3% in either direction.
On the flip side, the Short Straddle strategy is suitable for scenarios where volatility is expected to fall. In this approach, a trader would sell both an ATM call and put option with the same strike price and expiry, implying that the price of Wipro will remain within a range of ±5.3% after the earnings release.
Meanwhile, traders seeking a directional approach on break of the symmetrical triangle pattern can consider directional spreads. The bull call spread and bear put spread strategies provide a refined alternative to simple option buying.
About The Author
Next Story


