Market News
Will NIFTY50 continue its bullish momentum in July?

5 min read | Updated on July 01, 2025, 12:08 IST


SUMMARY
The NIFTY50 has been a winner in July for most of the last 15 years. The technical charts, too, support this move for July 2025. The medium and long-term view suggests a continuation of the uptrend with small short-term hiccups

NIFTY50 gained 3% in June, what's in store for July.
July 2025 is officially here, and the historical performance of the NIFTY50 holds some exciting prospects, with a strong track record in July over the past 15 years. So let's analyse whether history will repeat itself for NIFTY50, and what the charts are depicting.
| Year | June | July | June MoM (%) | July MoM (%) |
|---|---|---|---|---|
| 2010 | 5,313 | 5,368 | 4.5% | 1.0% |
| 2011 | 5,647 | 5,482 | 1.6% | -2.9% |
| 2012 | 5,279 | 5,229 | 7.2% | -0.9% |
| 2013 | 5,842 | 5,742 | -2.4% | -1.7% |
| 2014 | 7,611 | 7,721 | 5.3% | 1.4% |
| 2015 | 8,369 | 8,533 | -0.8% | 2.0% |
| 2016 | 8,288 | 8,639 | 1.6% | 4.2% |
| 2017 | 9,521 | 10,077 | -1.0% | 5.8% |
| 2018 | 10,714 | 11,357 | -0.2% | 6.0% |
| 2019 | 11,789 | 11,118 | -1.1% | -5.7% |
| 2020 | 10,302 | 11,073 | 7.5% | 7.5% |
| 2021 | 15,722 | 15,763 | 0.9% | 0.3% |
| 2022 | 15,780 | 17,158 | -4.9% | 8.7% |
| 2023 | 19,189 | 19,754 | 3.5% | 2.9% |
| 2024 | 24,011 | 24,951 | 6.6% | 3.9% |
| 2025 | 25,517 | ? | 3.1% | ? |
July has been one of the strongest months for the Indian stock markets in the last 15 years, with evident bullish momentum. The NIFTY50 has surged in July in 11 out of the last 15 years.
Further, in the last 10 years, the only negative return in July occurred in 2019, with a decline of 5.7% following a disappointing Union Budget presented in July 2019. This was largely due to the lower-than-expected corporate tax cut and additional surcharge on high-income taxpayers, which dampened the sentiments of high-net-worth individuals, including foreign portfolio investors.
However, all other years in a decade recorded positive returns in July, likely driven by strong monsoon demand and the optimism surrounding it.
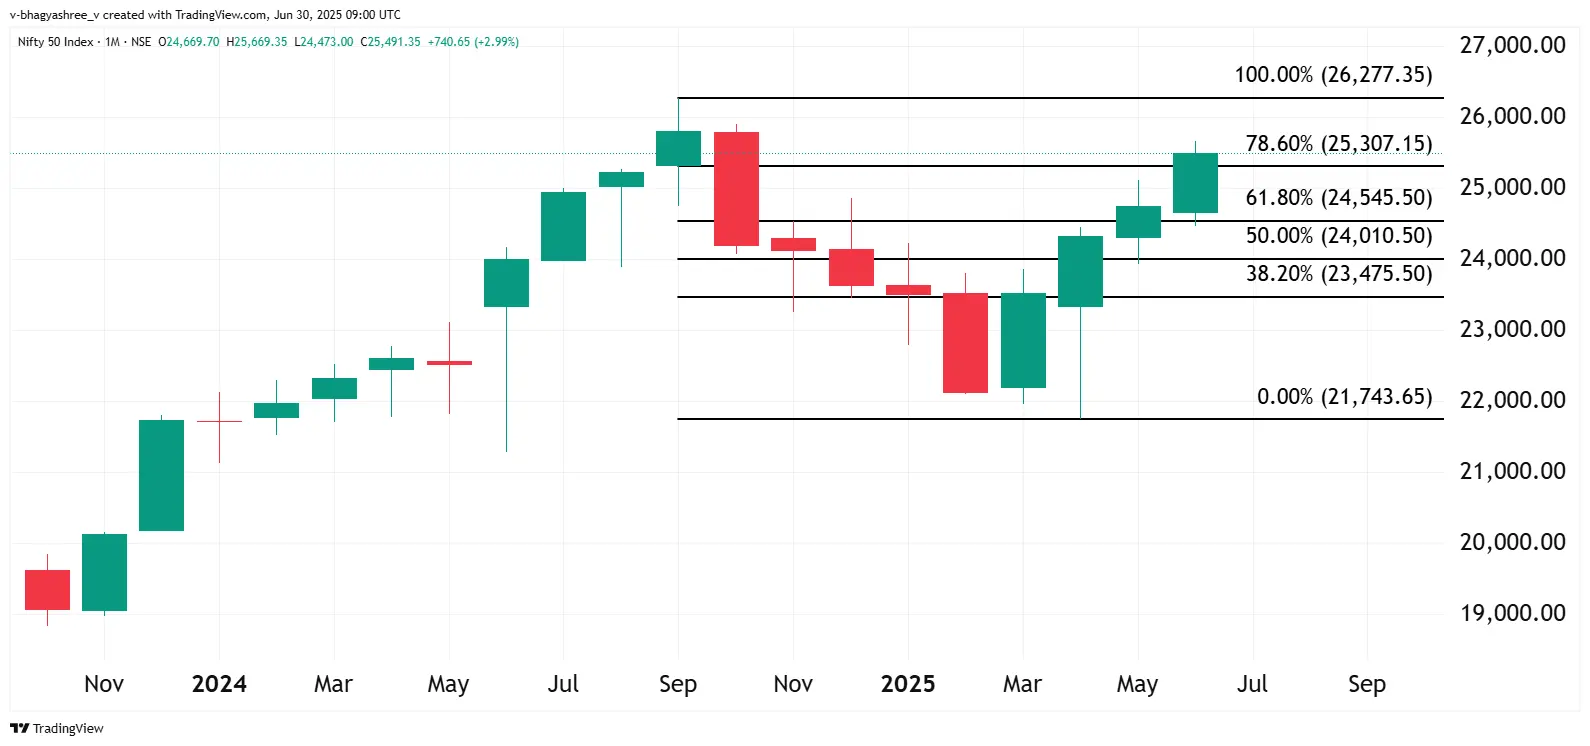 The NIFTY50 rallied for the fourth consecutive month in June 2025, achieving a V-shaped recovery from the decline between October 2024 and February 2025. The index has recovered more than 78% of the prior decline, closing above 78.6% retracement i.e., the resistance, giving a strong bullish candle. Additionally, we mentioned in our previous article a resistance zone at 25,000, which the NIFTY50 surpassed in June.
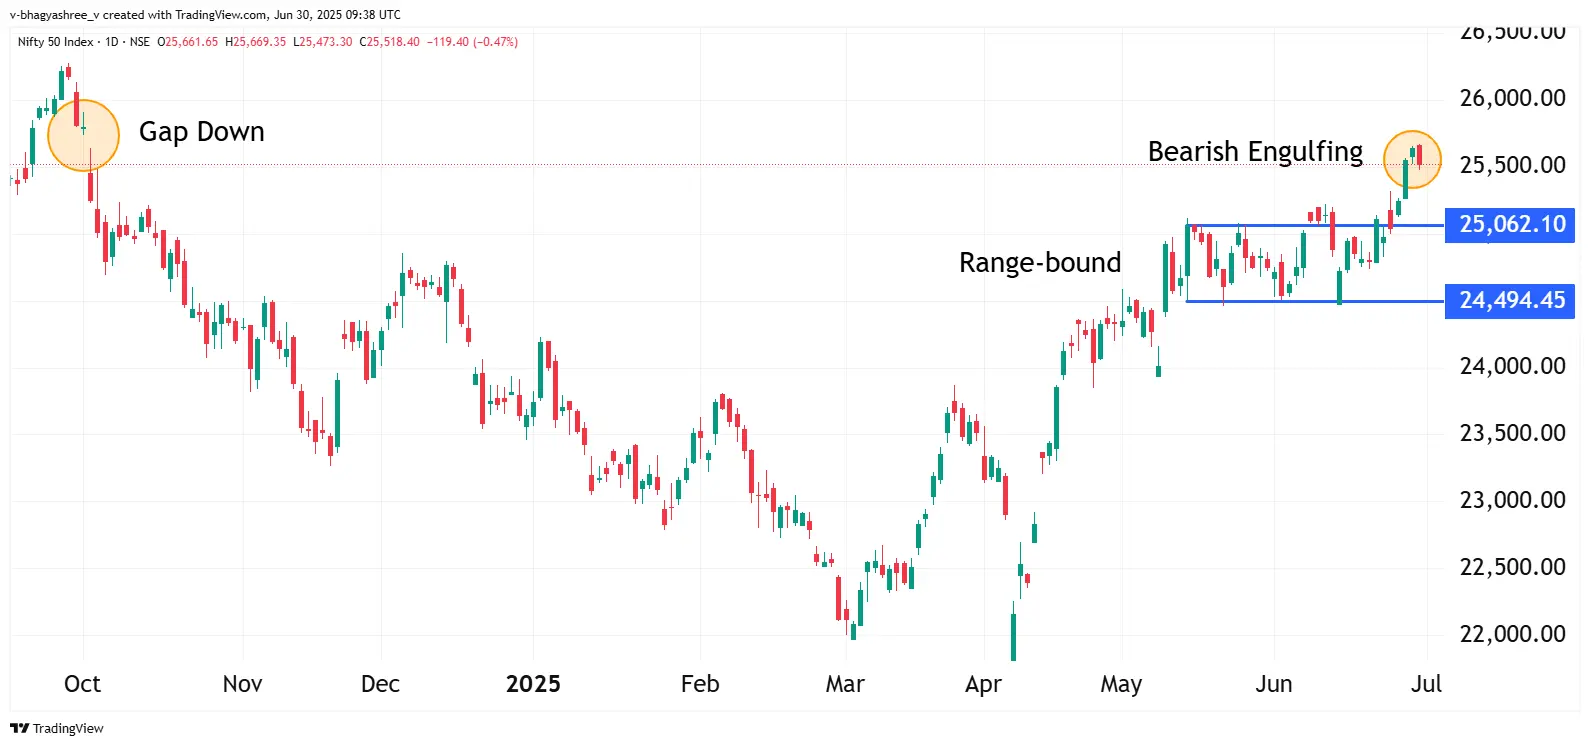 On the daily chart, the NIFTY50 saw a range-bound movement between 24,500 to 25,000 from mid-May to mid-June. However, the index broke out of the range in the last few trading sessions of June, sustaining above the 25,000 mark and gaining 700 points.
Yet, the index retreated after nearly filling the gap created on October 3, 2024. On the last trading day of June 2025, the index formed a bearish engulfing candlestick pattern. It is a small bullish candle followed by a larger bearish candle that fully covers the previous candle's body, suggesting a possible trend reversal. This pattern appears at the end of an uptrend.
If the price falls below the low of the bearish engulfing pattern, it signals a likely short-term decline or profit booking in the current context of the uptrend.
Economic calendar
| Date | Day | Event | Importance |
|---|---|---|---|
| July 1 | Tuesday | Manufacturing PMI for June | * |
| July 3 | Thursday | Services PMI for June | * |
| July 14 | Monday | WPI Inflation YoY June | *** |
| July 14 | Monday | Inflation rate YoY June | *** |
| July 28 | Monday | Industrial Production YoY June | * |
The manufacturing PMI—an indicator that tracks changes in production, orders, jobs and inventories—is projected to rise to 58.4 from 57.6, signalling positive economic growth. Moreover, the services PMI, which indicates the health of the service sector, is expected to grow to 60.7 from 58.8 earlier. The wholesale price index (WPI) is expected to increase to 2.7% from the previous 0.39%, likely driven by rising domestic demand and monsoon. Further, CPI inflation is expected to remain stable. Meanwhile, the index of industrial production (IIP), covering manufacturing, mining and electricity, is estimated to show robust growth of 4.2% from 1.2%.
All said and done, the positive historical trends in July, coupled with the bullish breakout in the Nifty50 charts and the positive estimates of the upcoming economic events, have been fuelling ongoing optimism in the Indian stock markets. Having said that, the markets may witness some profit-booking in the short term.
About The Author
Next Story


