Market News
Weekly market outlook: US Fed rate decision, Q4 earnings, volatility index, F&O cues are top cues to track this week
.png)
6 min read | Updated on April 29, 2024, 09:28 IST


SUMMARY
After confirming the shooting star pattern during the week ending 8 April, the NIFTY50 rallied but encountered resistance in the 22,500-22,600 zone. The index also formed a negative candle on the 26 April, erasing most of the gains made the previous day.
.webp)
US Fed rate decision, Q4 earnings to dictate market direction.
After two weeks of losses, markets rebounded and ended the last week of April in the green, gaining over 1%. This was led by strong results from the major banks.
Midcap and Smallcap stocks outperformed their benchmarks, with the NIFTY Midcap 100 rising 4% to a new all-time high. Similarly, the Smallcap 100 index gained 4.3% to close at a new all-time high.
All the major sectoral indices ended in the green, with PSU Banks (+6.4%) and Metals (+3.5%) being the top gainers.
Index breadth- NIFTY50
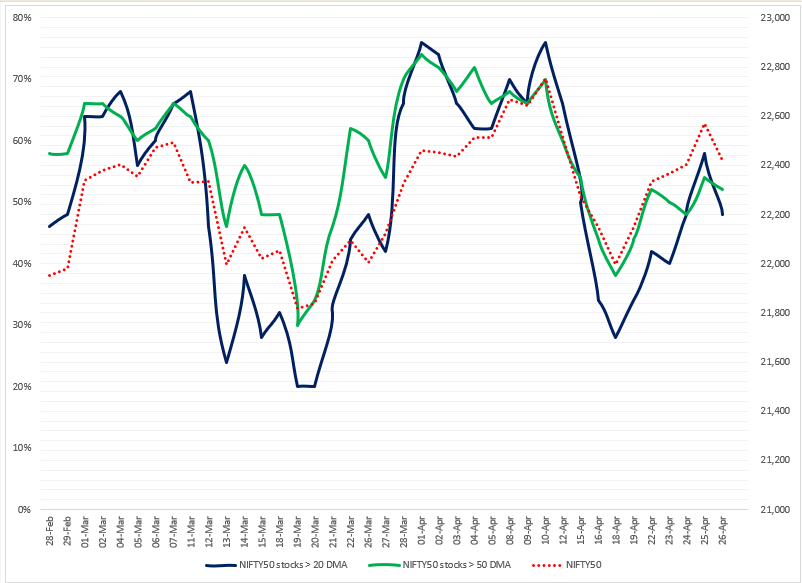
Breadth on the NIFTY50 index has shown signs of recovery following last week's sell-off, with the percentage of stocks trading above their 20 and 50-day moving averages (DMAs) improving to 48% and 52% respectively. However, as shown in the chart below, both the breadth indicators remain at the lower end of the typical sideways range, which fluctuates between 50% and 70%.
In our previous blog, we highlighted the critical intersection of stocks trading above their 20 and 50 DMAs, marked by the blue and green lines on the chart. This intersection, which occurred on the 23rd of April, was followed by a rally in the NIFTY50 index, which took it above 22,500. However, this rally was short-lived. As shown in the chart below, the blue line, which represents the NIFTY50 stocks trading above the 20-DMA, has fallen back below the green line, signalling weakness in the strength.
FIIs positioning in the index
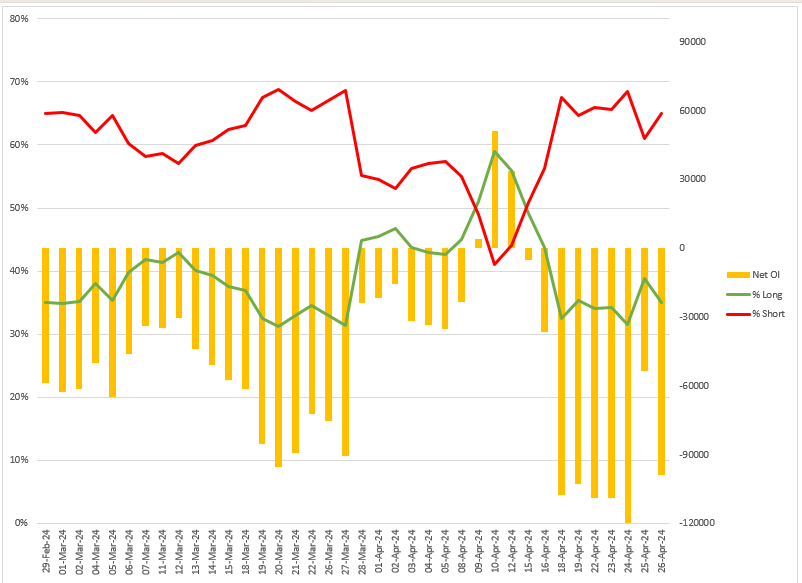
Foreign Institutional Investors (FIIs) started the May F&O series with a long to short ratio of 65:35 in the index futures. The net short OI of FIIs almost halved on 25 April (monthly expiry), leading to a short-covering rally in the index.
However, since January, the FIIs position in the index futures has remained largely net short without leading to a significant fall in the index. As shown in the chart below, the index has remained largely range-bound (21,700 and 22,700) despite a net short OI of well over 60%. We advise our readers to keep a close eye on any further additions or unwinding of OI resulting in a change in the net short ratio.
Amid the range-bound activity, Foreign Institutional Investors (FIIs) dumped shares worth ₹36,933 crore in the cash market in the month of April 2024. Conversely, domestic institutions stepped in and bought shares worth ₹42,065 crore. This activity resulted in a net institutional inflow of ₹5,132 crore.
 (As of 26 April)
F&O - NIFTY50 outlook
For the 2 May expiry, the open interest (OI) highlights a substantial call OI at 22,500 and 22,600 strikes, indicating it as an immediate resistance zone. Conversely, significant put options OI accumulated at 22,000 and 22,400 strikes. The initial setup of the OI suggests that traders are expecting NIFTY50 to trade between 22,700 and 21,800.

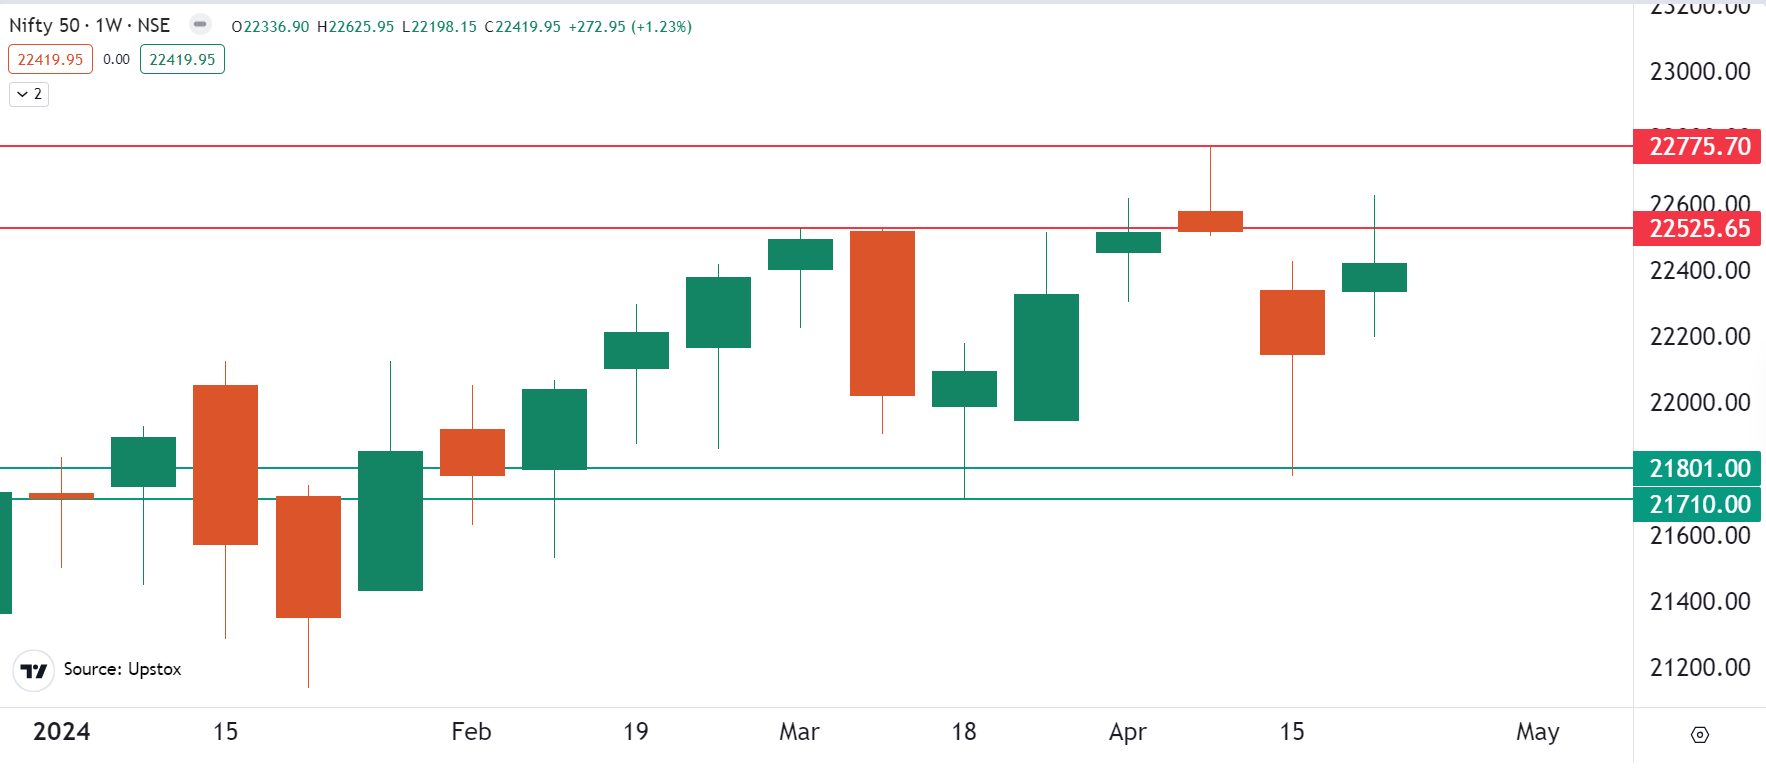
After confirming a shooting star pattern in the week ending 8 April, the NIFTY50 rallied but encountered resistance in the 22,500-22,600 zone. The index also formed a negative candle on the 26 April, erasing most of the gains made the previous day.
Meanwhile, the Volatility Index (India VIX) plunged over 18% last week to a five month low. This suggests the possibility of sharp intraday swings and range-bound trading in the coming days. Traders should remain wary of these sharp price swings, which could lead to a sudden spike in option premiums.
F&O - BANK NIFTY outlook
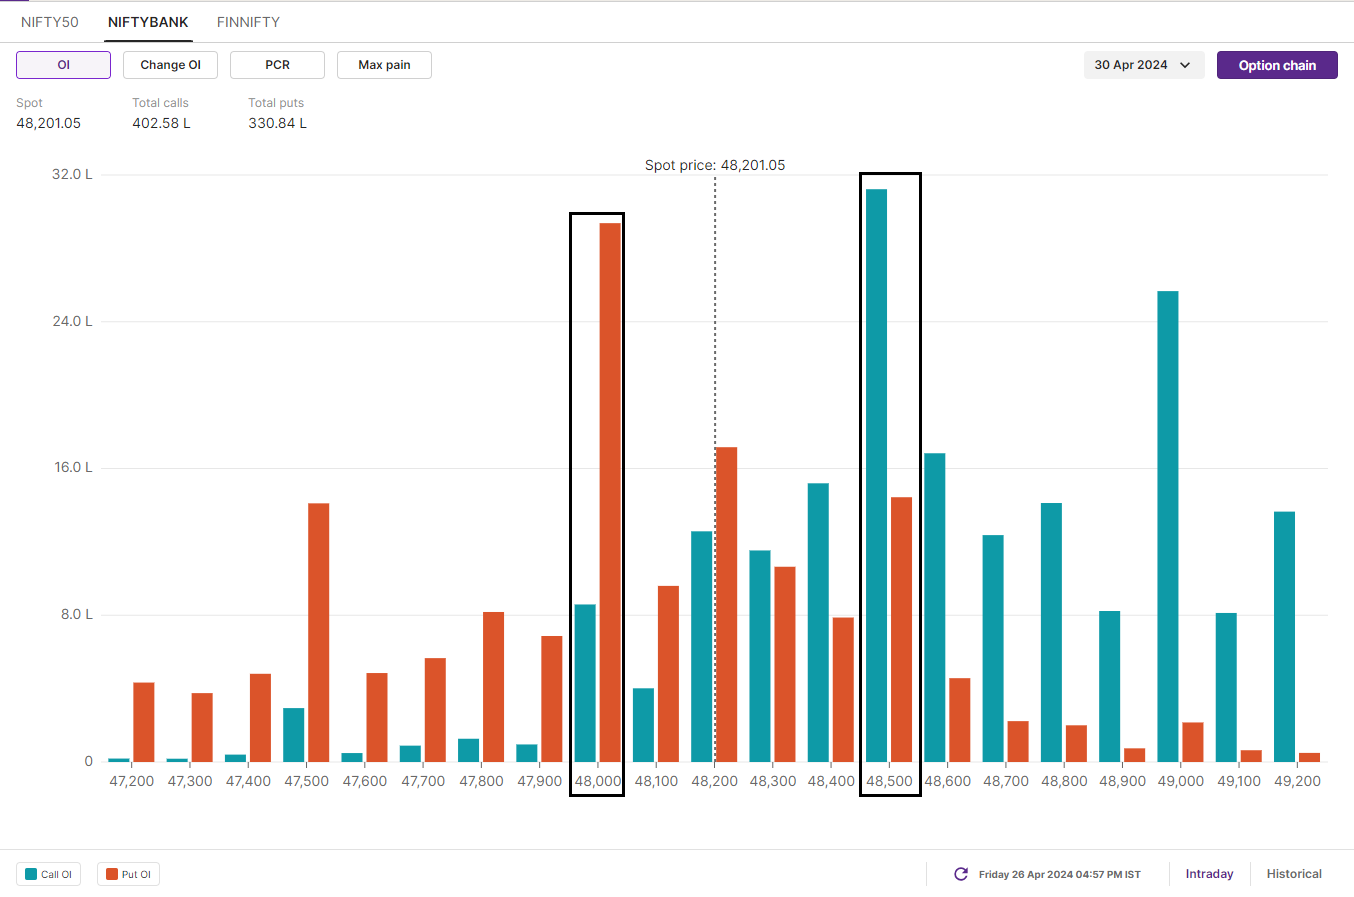
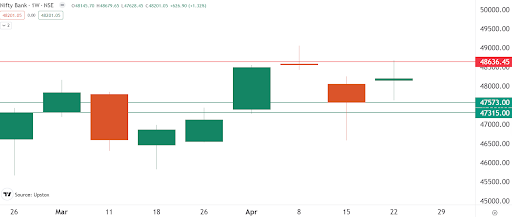
The options data for 30 May expiry highlights a substantial call option OI at 48,500 and put option at 48,000 strike. This build-up of open interest suggests that market participants are expecting BANK NIFTY to trade in a range of 47,700 and 48,900.
After confirming a gravestone doji on the 8 April, the BANK NIFTY encountered resistance in the 48,500-48,600 area and witnessed selling pressure. In addition, the index formed a doji candle on the weekly chart, signalling investor indecision.
Given that a doji candle is considered to be a neutral candlestick pattern, traders are advised to watch the high and low of the doji closely. A break on either side on a closing basis could provide traders with further directional clues.
Looking ahead to the upcoming holiday-shortened week, the critical support level for the NIFTY50 is set at 21,700. A break below this level on a weekly closing basis would indicate a reversal in the trend. Conversely, the key resistance level is 22,525. If the index closes above this level on a weekly basis, it could break out of its current three-month consolidation phase.
And we'll keep you updated on the changes and important developments via our morning trade setup blog, which is available every day before the market opens at 8 am.
Disclaimer: Derivatives trading must be done only by traders who fully understand the risks associated with them and strictly apply risk mechanisms like stop-losses. The information is only for consumption by the client and such material should not be redistributed. We do not recommend any particular stock, securities and strategies for trading. The securities quoted are exemplary and are not recommendatory. The stock names mentioned in this article are purely for showing how to do analysis. Take your own decision before investing.
About The Author
Next Story


