Market News
Week ahead | Q2 earnings, FII outflows, crude oil and global cues among key market triggers to watch
.png)
5 min read | Updated on October 21, 2024, 09:30 IST


SUMMARY
This week, Q2 earnings of NIFTY50 companies and foreign investors outflows will dicate the trend. The NIFTY50 is currently consolidating between 25,250 and 24,700. A break of this range on the closing basis will provide further directional clues.

Key things to know that could markets in the week ahead
Markets extended the losing streak to the third consecutive week, driven by continuous selling by foreign investors and subdued second quarter earnings of FY25. The NIFTY50 index ended the week on a negative note, below the 25,000 mark for the second week in a row.
Sectorally, Automobiles (-4.8%) and Metals (-1.6%) lost the most, while Private Banks (+1.3%) and PSU Banks (+0.9%) were the top gainers. Meanwhile, the broader markets ended the week on a mixed note. NIFTY Midcap 100 index lost 1%, while Smallcap 100 index gained 0.3%.
Index breadth- NIFTY50
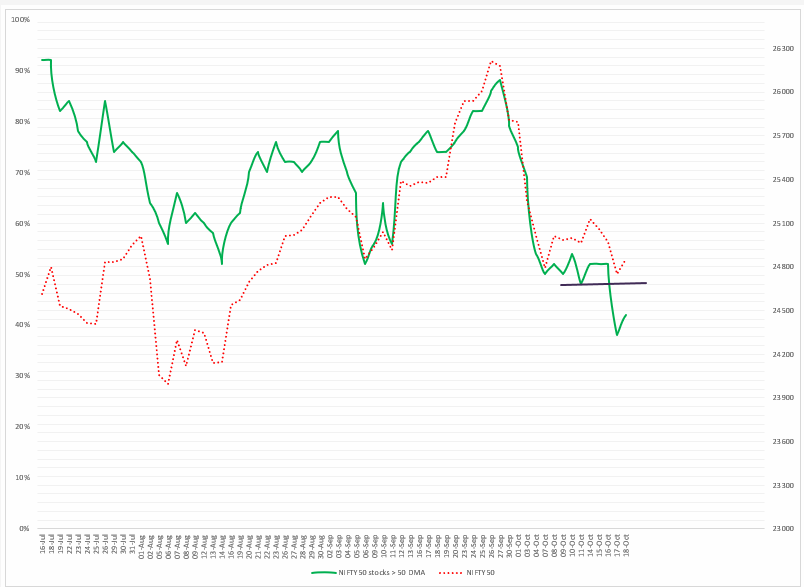
The breadth indicator, which measures the percentage of NIFTY50 stocks trading above their day moving average (DMA), fell to 40% last week. After a brief bounce of up to 52% during the week, the index fell nearly 1% in the weekly options expiry, with the breadth indicator falling to 38%.
As of Friday, 42% of the NIFTY50 is trading above its 50-day moving average, suggesting that the market is range-bound. If the percentage falls below 40%, the index could see further weakness.
FIIs positioning in the index
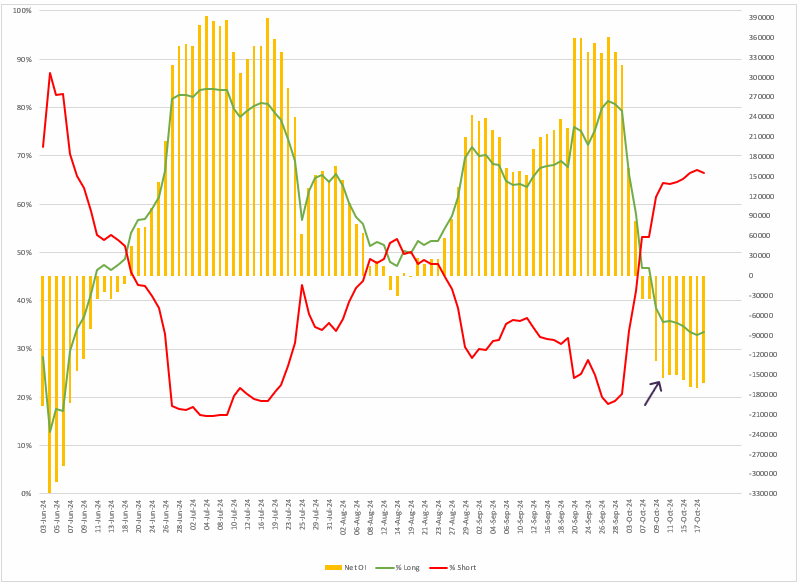
Foreign Institutional Investors (FIIs) sustained their short open interest in index futures, sustaining the long-to-short ratio of 34:66 throughout the week. This indicates the broader positioning of the FIIs on the indices remains weak.
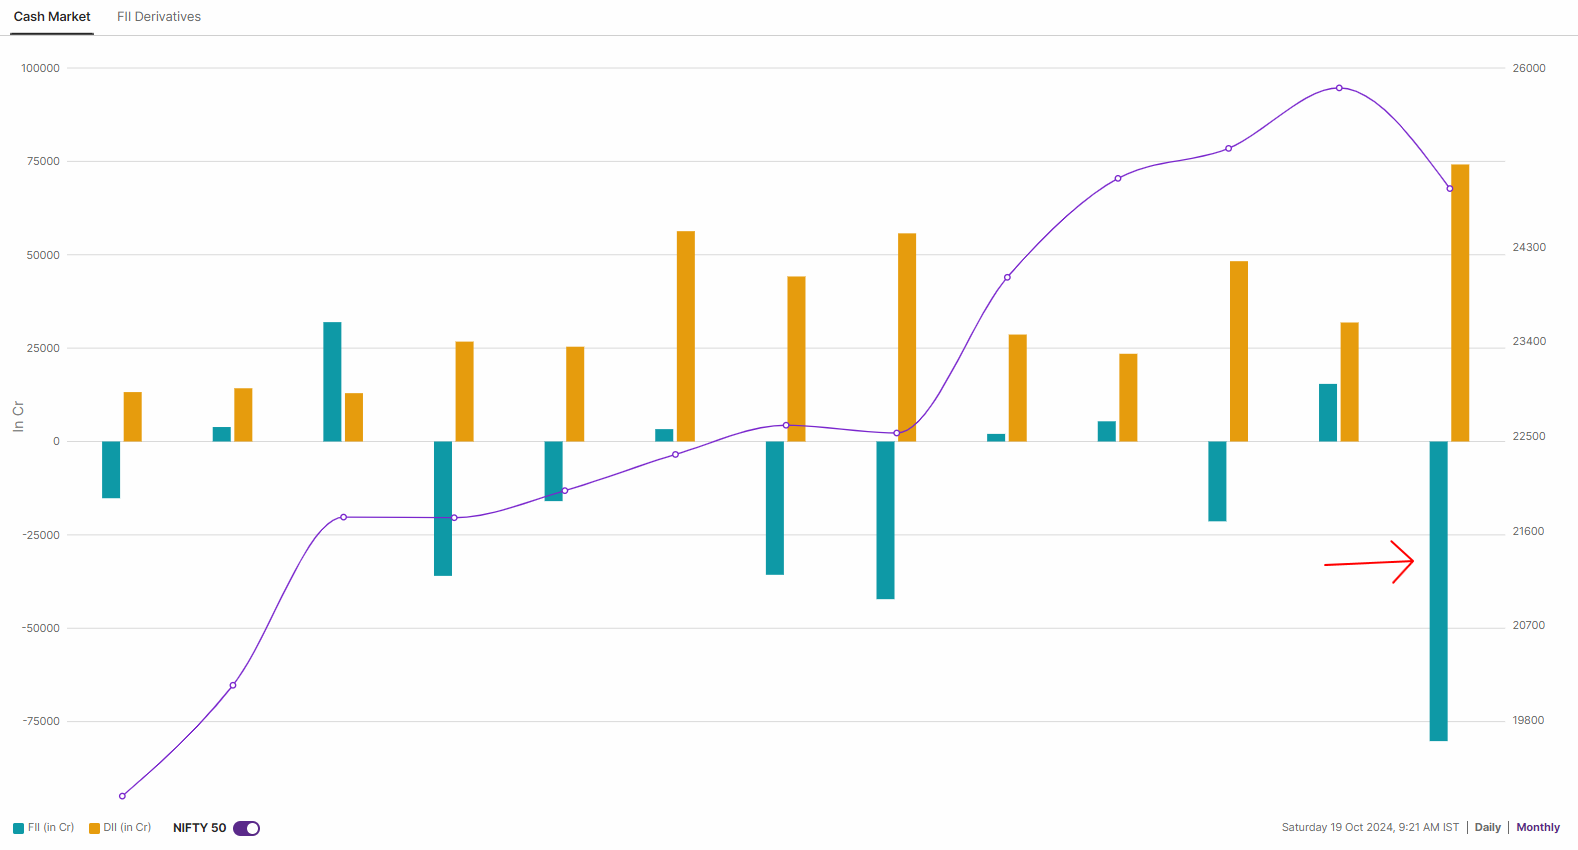
The cash market activity of Foreign Institutional Investors (FIIs) remained negative for the third consecutive week in October. As of October 18, FIIs sold shares worth ₹80,217 crore, marking their highest sell-off since March 2020. In contrast, Domestic Institutional Investors (DIIs) stepped in to absorb the selling pressure, recording a significant buying figure of ₹74,176 crore—their highest during the same period.
F&O - NIFTY50 outlook
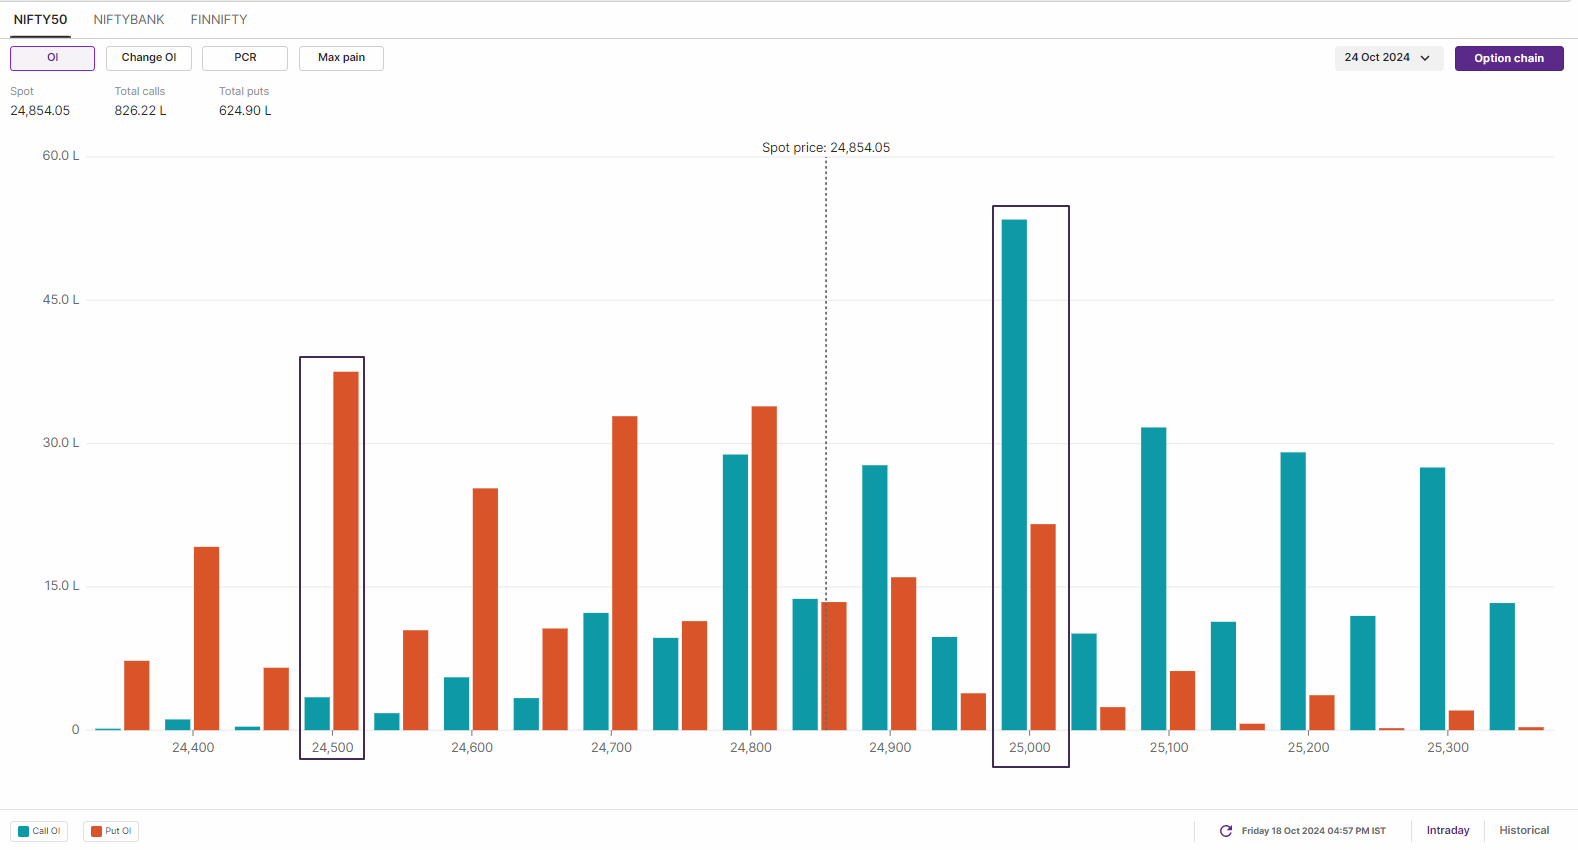
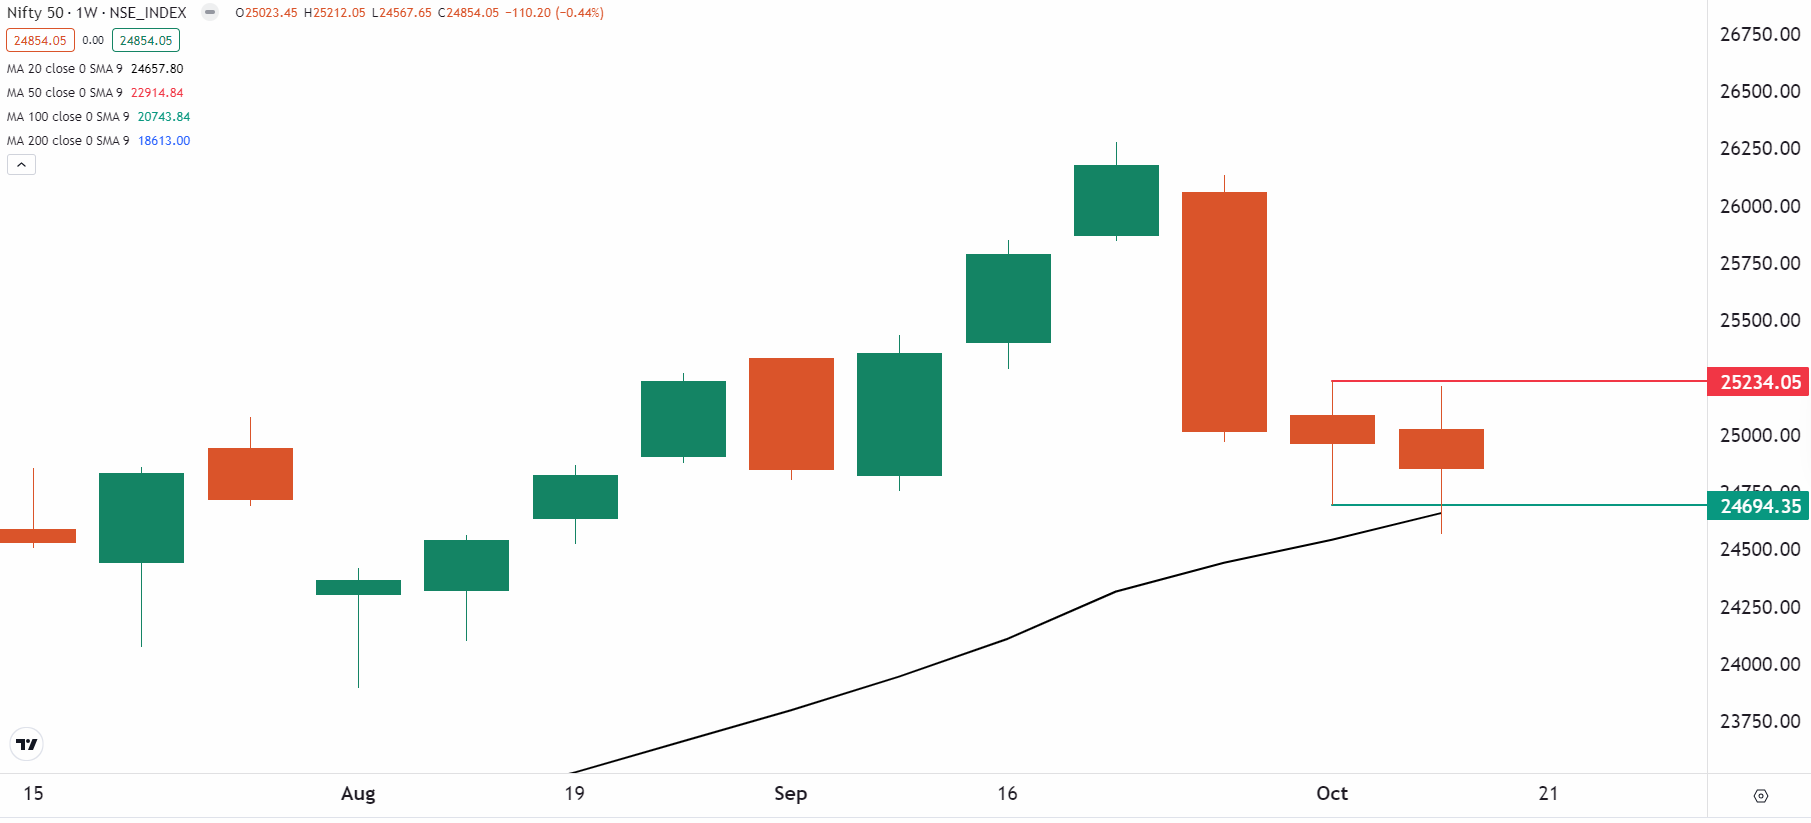
Open interest data for the 24th showed a significant call base at 25,000, indicating resistance for the index around this level. Conversely, the put base was seen at the 24,500 strike, indicating support for the index around this area.
On the weekly chart, the NIFTY50 index has broadly consolidated within previous week’s range and protected previous week’s low on closing basis. The immediate support for the index is around 24,700, while the resistance remains at 25,250. Unless the index breaks this range on closing basis, the trend may remain range-bound.
F&O - BANK NIFTY outlook
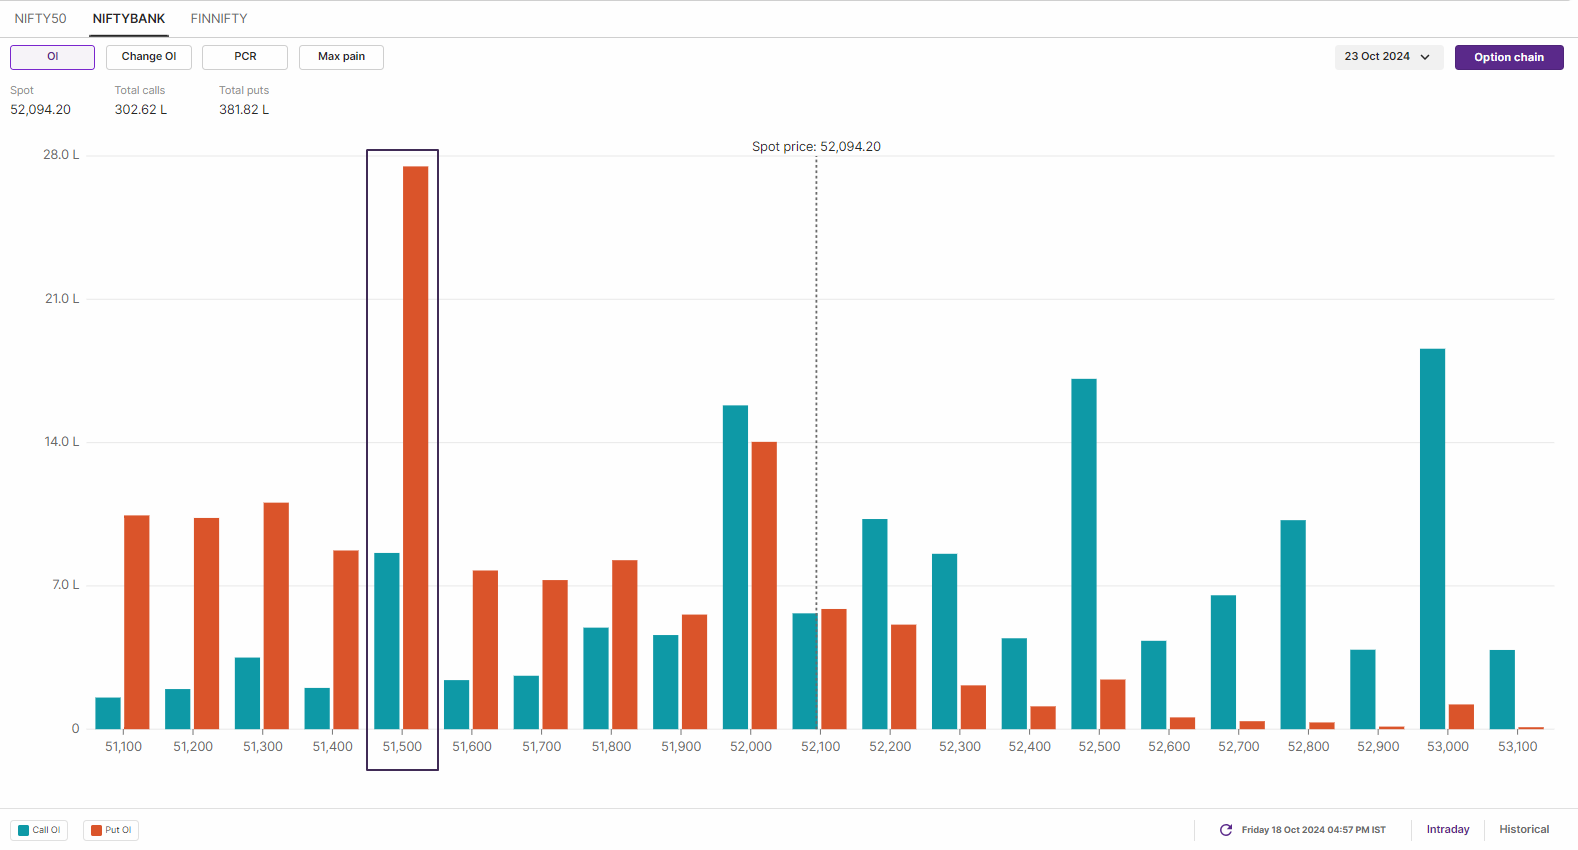
Open interest positioning on the BANK NIFTY for the 23 October expiry showed a strong put base at the 51,500 strike, indicating support for the index around this area. Meanwhile, the call base was seen at 52,500 and 53,000 strikes, marking these as key resistance zones
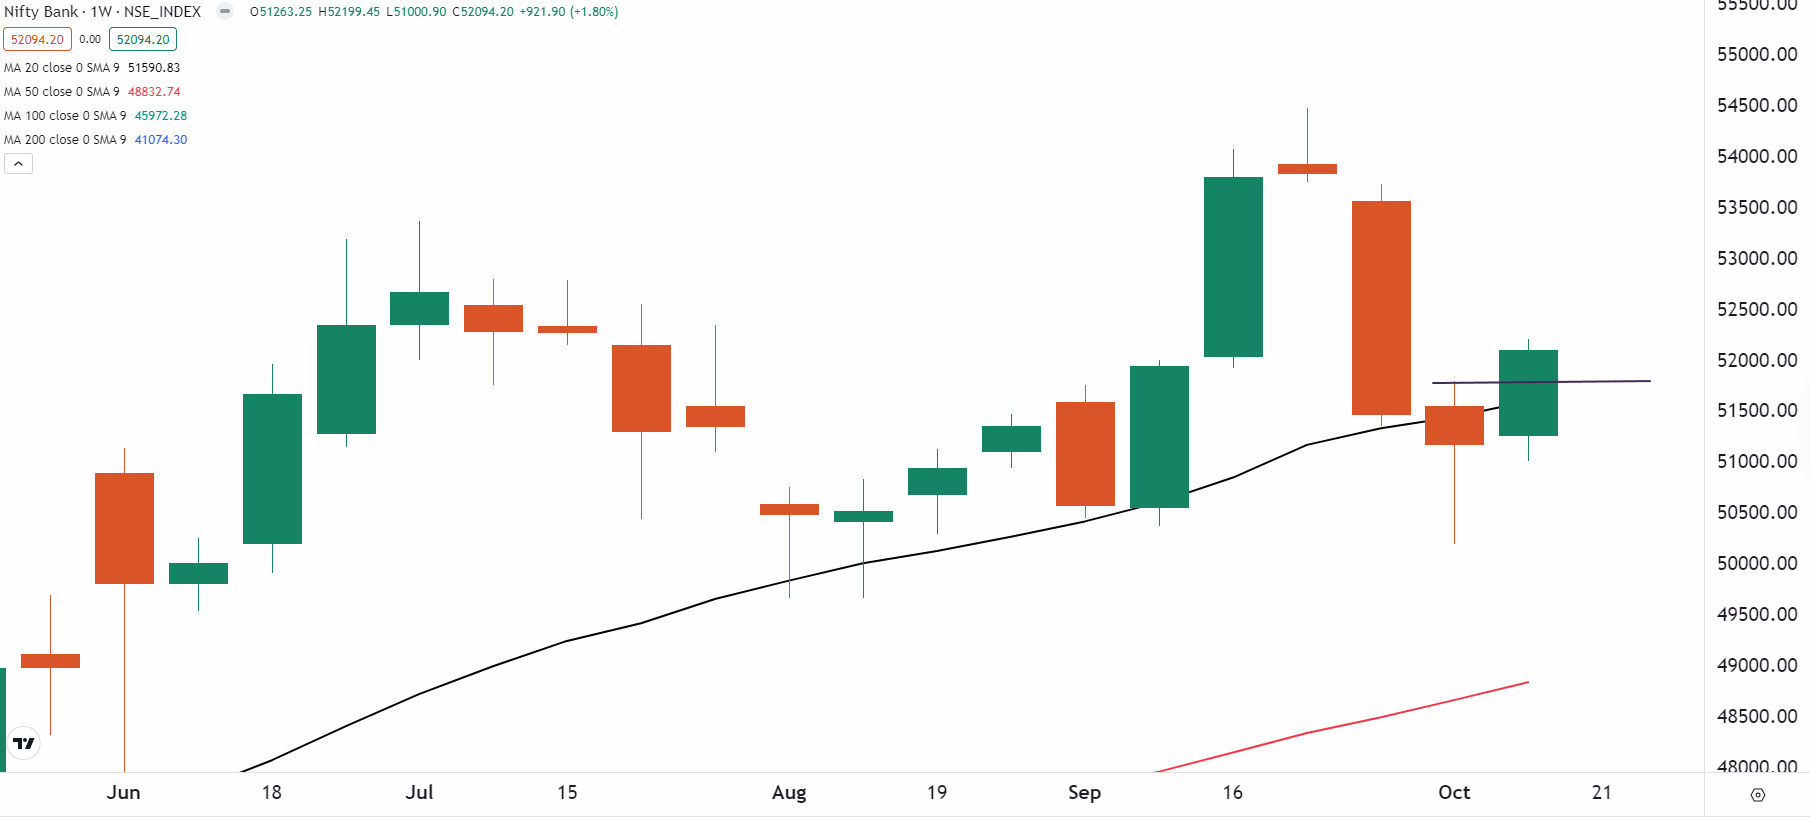
The BANK NIFTY closed above the previous week’s high, confirming the hammer candlestick pattern formed last week. The strong rebound from the 51,000 zone, indicates emergence of fresh buyers from the lower levels.
In the upcoming sessions, BANK NIFTY’s trend may remain sideways to bullish with immediate resistance around 52,500 zone. The support for the index remains at 51,000 mark. Traders may get further directional clues if the index breaks this range on a closing basis.
In the U.S, Tesla, Boeing, General Motors, American Airlines, UPS and Coca-Cola are the key companies reporting third quarter results.
In the coming sessions, the NIFTY50 may bounce back towards its immediate resistance level of 25,000. However, if the index fails to close above 25,250 on the daily chart, the trend may remain sideways with support around 24,700. A close above or below these levels will provide traders with further directional clues.
To stay updated on any changes in these levels and all intraday developments, be sure to check out our daily morning trade setup blog, available before the market opens at 8 am.
Disclaimer: Derivatives trading must be done only by traders who fully understand the risks associated with them and strictly apply risk mechanisms like stop-losses. The information is only for consumption by the client, and such material should not be redistributed. We do not recommend any particular stock, securities, or trading strategies. The securities quoted are exemplary and not recommendatory. The stock names mentioned in this article are purely to show how to do analysis. Make your own decision before investing.
Related News

About The Author
Next Story