Market News
Week ahead: Auto sales, Trump tariffs, FII flows among the key triggers to watch this week
.png)
5 min read | Updated on March 03, 2025, 07:50 IST


SUMMARY
Next week, auto sales data, Trump's tariffs and foreign fund outflows will determine the market's direction. Meanwhile, if the NIFTY50 falls below 21,800, it could extend losses.

Auto sales, Trump tariffs, FII flows among the key triggers to watch this week. Image Source: Shutterstock.
Markets extended their losing streak for the third consecutive week, slipping nearly 3% and recording their steepest weekly decline since December 2024. The NIFTY50 index ended the week at 22,124, down 2.9%, while the SENSEX closed the week at 73,198, down 2.8%.
Broader markets resumed their sell-off after a brief pause, with the NIFTY Midcap 100 and Smallcap 100 indices plunging over 5% each. The downturn was broad-based across major sectors, with IT (-7.9%) and PSU Banks (-5.3% ) declining the most.
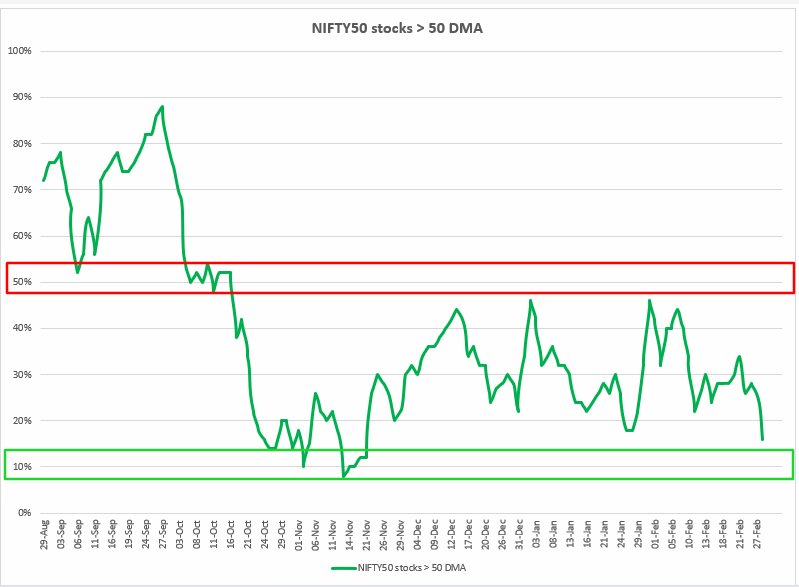
Index breadth
The breadth of the NIFTY50 index further weakened further last week, with only 16% of its stocks trading above their 50-day moving average (DMA), signaling continued weakness.
Historically, when the indicator has dropped to around 10%, the index has seen a short-term bounce from oversold levels. However, broader market breadth remains weak, as the indicator has stayed below the key 50% level for over five months. A sustainable recovery will only be visible once 50% of the NIFTY50 stocks consistently trade above their 50 DMA.
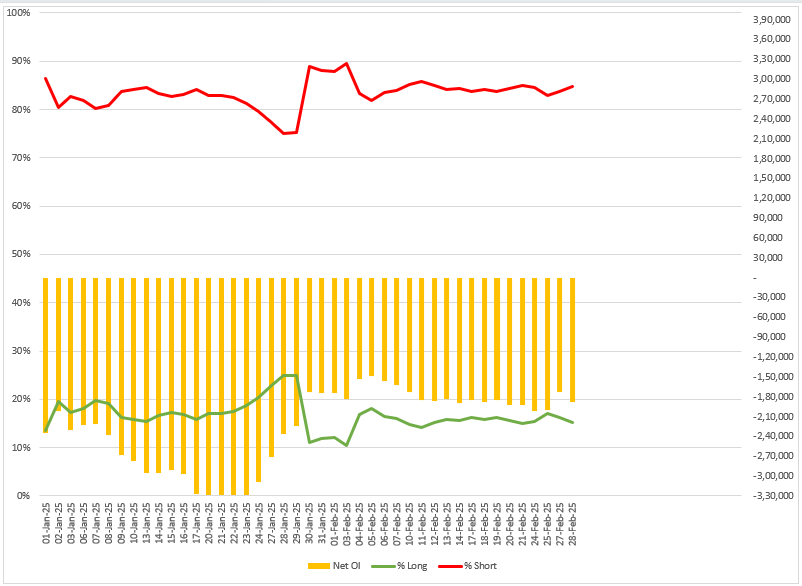
FIIs positioning in the index
Foreign Institutional Investors (FIIs) rolled over their bearish bets on index futures for the March series, starting the March series with the long-to-short ratio with 15:85. This indicates that the broader positioning of FIIs remains bearish with net open interest of futures contracts standing above -1.8 lac contracts.
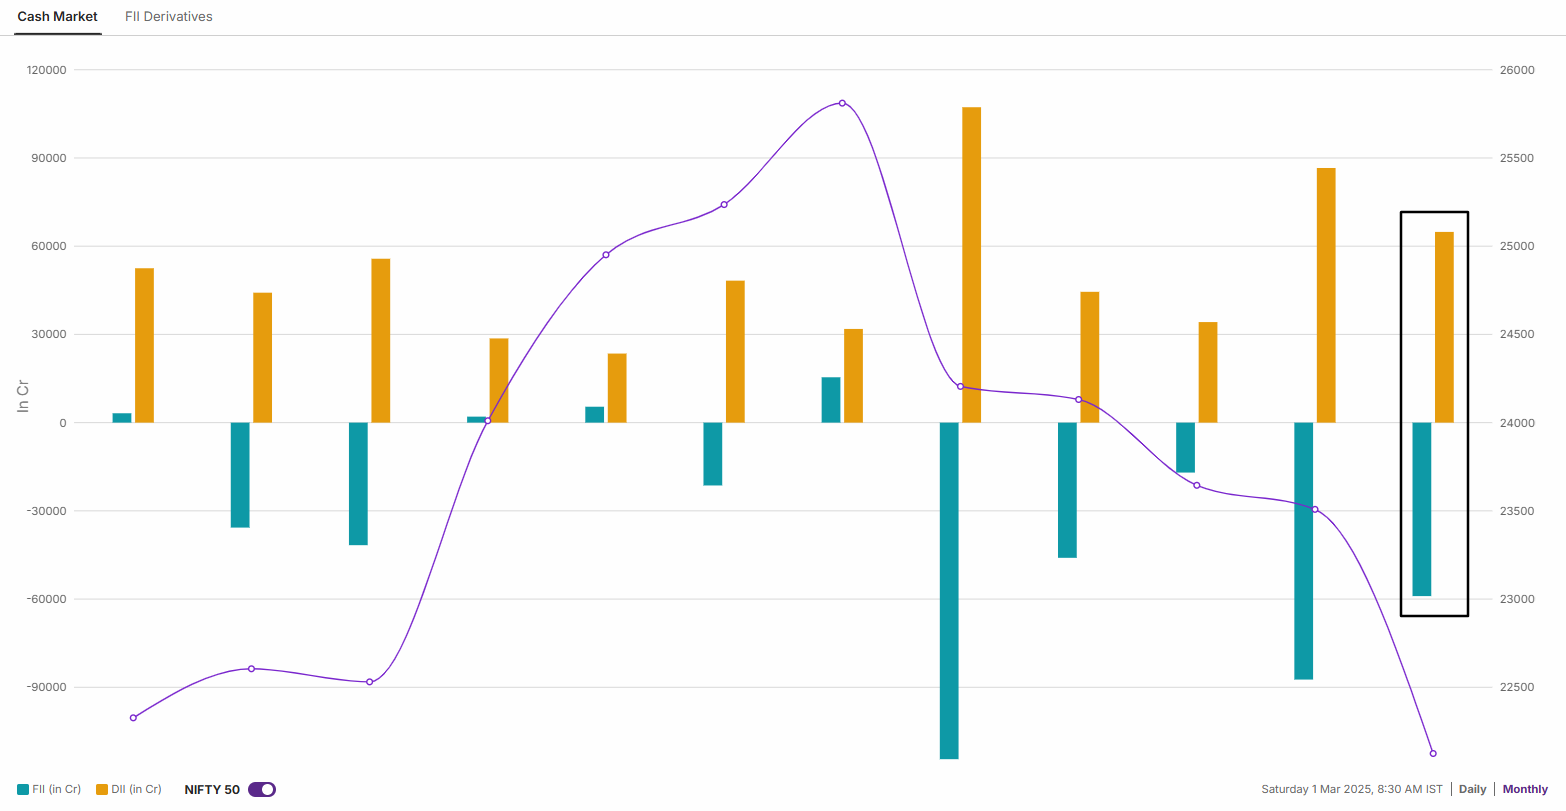
The cash market activity of the FIIs was in line with their bearish bets on index futures as they offloaded shares worth ₹59,988 crore in February. Meanwhile, the Domestic Institutional Investors remained net buyers and bought shares worth ₹59,988 crore.
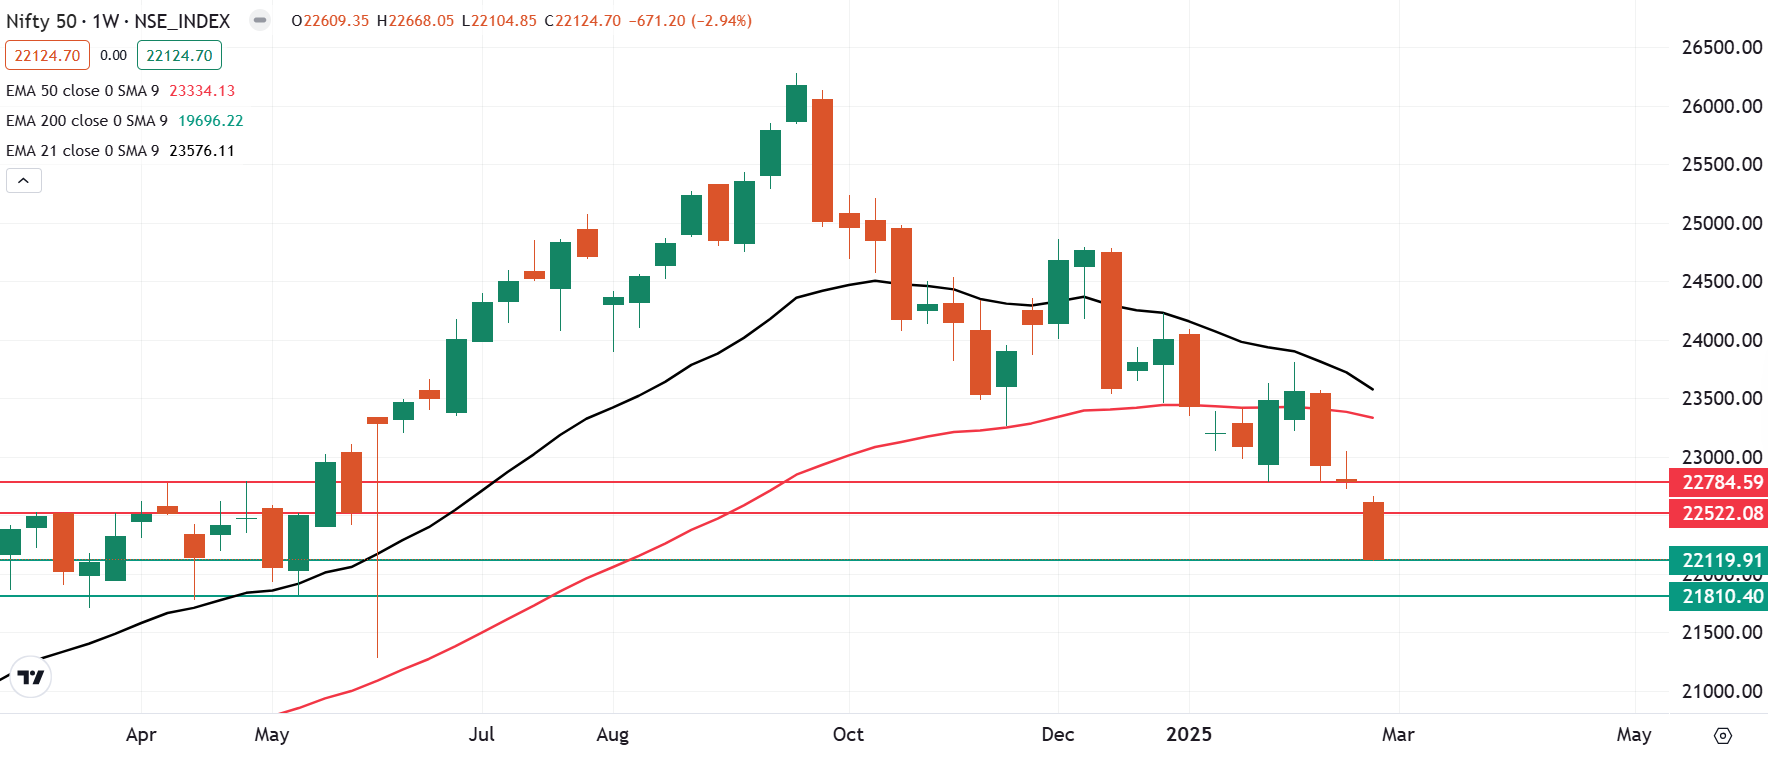
NIFTY50 outlook
The NIFTY50 index closed below the crucial support zone of 22,500, forming a bearish candlestick pattern on the weekly chart. Its technical structure of the index remains weak, with immediate resistance around the 22,800 zone.
On the down side, the next crucial support lies around the 21,800, aligning with the lows from March, April and May of the previous year. A close below this zone on the daily chart could indicate further weakness. Conversely, if the index rebounds , 22,800 will serve as the key resistance for the week.
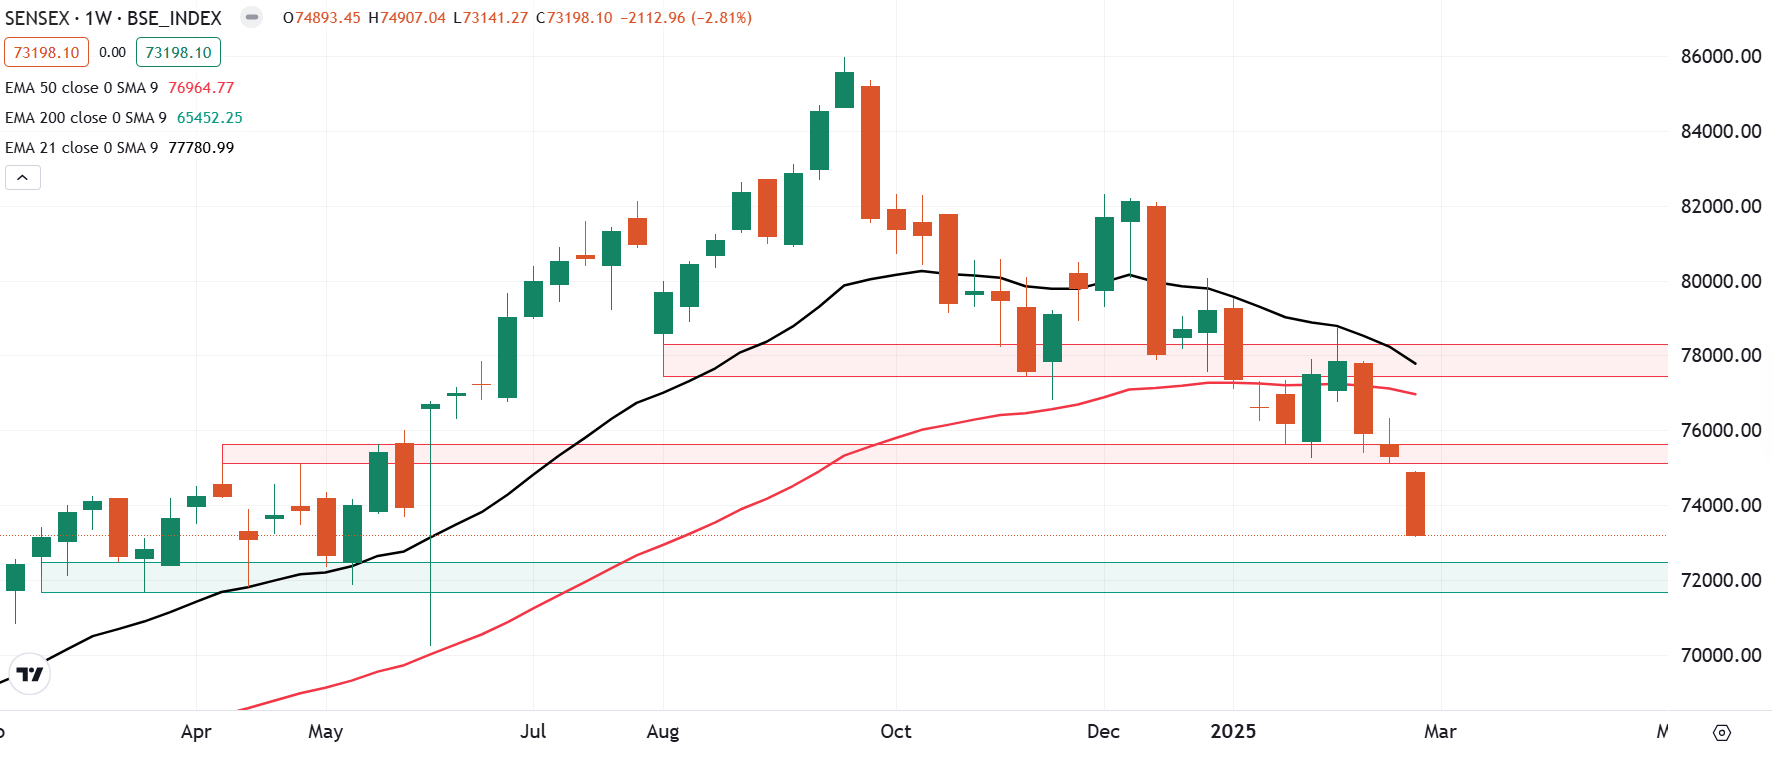
SENSEX outlook
The SENSEX also declined over 2%, closing the week below the crucial 75,000 level, indicating weakness. In the coming sessions, key support is positioned around 71,600. A decisive close below this level on the weekly chart could further dampen sentiment. On the upside, resistance is seen near the 75,500 zone.
On the domestic front, markets will also react to February’s wholesale auto sales data, which comes amid subdued retail demand.
For the upcoming week, the crucial support zone for the index is around 21,800 zone. If the index slips below this zone on a closing basis, it may further extend the weakness. Meanwhile, the immediate resistance for the index is around the 22,800 zone.
For intraday range updates and revisions to these levels, visit our daily morning trade setup blog, published at 8 AM before the market opens.
About The Author
Next Story


