Market News
Trade Setup for Sept 2: NIFTY50 to rely on banks for sustaining momentum above 25,000 mark
.png)
5 min read | Updated on September 02, 2024, 08:17 IST
SUMMARY
BANK NIFTY remained contained between its 50-day and 20-day moving averages (DMAs) last week. Traders should keep an eye on these key levels as a decisive break above or below can be a strong directional signal.
Stock list
On the daily chart, the NIFTY50 has formed a doji candlestick, indicating a pause.
Asian markets update at 7 am
The GIFT NIFTY is flat, indicating a flat to positive start for the NIFTY50 today. Meanwhile, other Asian markets are trading mixed. Japan's Nikkei 225 is up 0.4%, while Hong Kong's Hang Seng Index is down over 1%.
U.S. market update
- Dow Jones: 41,563 (▲0.5%)
- S&P 500: 5,648 (▲1.0%)
- Nasdaq Composite: 17,713 (▲1.1%)
U.S. indices ended the Friday’s session on a positive note after the latest reading of the Federal Reserves preferred gauge of inflation came in line with expectation. The data fo Personal Consumption Expenditures (PCE) of July came in at 2.6%, matching June’s reading and below the expectation of 2.7%.
Meanwhile, the core PCE, which strips out food and energy rose 0.2% month-on-month, in line with the Street estimates. With the expectation of rate cut in September, the debate has now shifted to how much the Fed will cut. As of Friday, the markets are pricing in a 30% chance of 50bps cut in Fed’s September meeting.
NIFTY50
- September Futures: 25,376 (▲0.5%)
- Open Interest: 5,57,477 (▲5.2%)
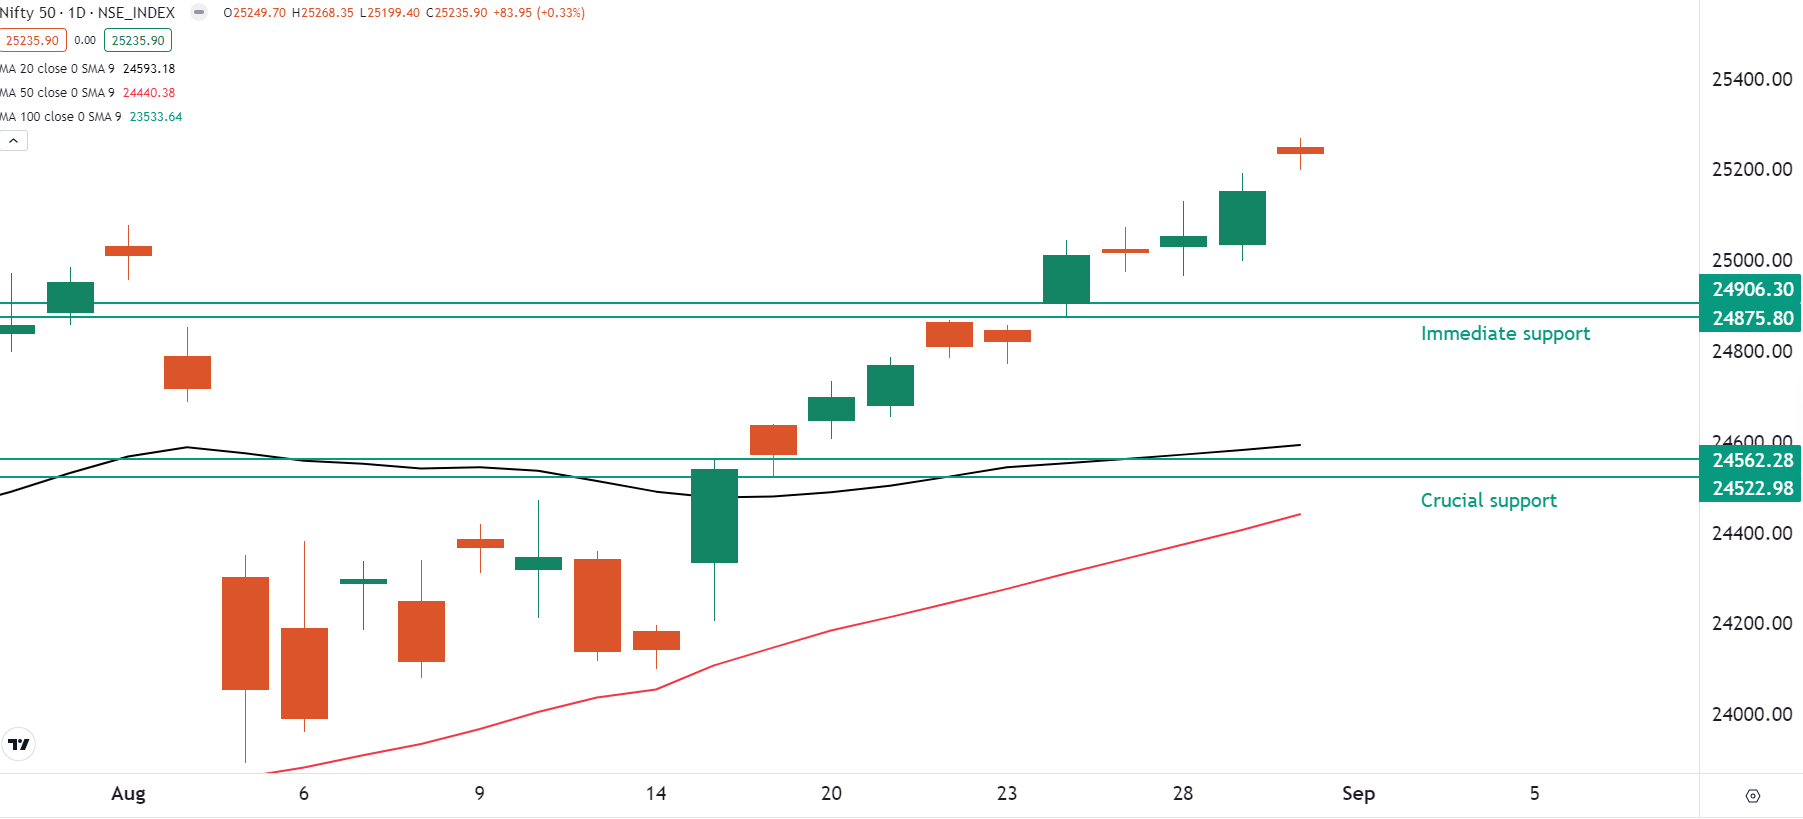
The NIFTY50 extended its winning streak for the twelfth consecutive day, its longest ever, to end the week on a bullish note. The index regained its previous all-time high after a month, led by strong gains in technology and pharmaceutical stocks.
On the daily chart, the index has formed a doji candlestick, indicating a pause. However, the index's short and long-term momentum remains positive as the it has not yet formed a reversal signal on the daily chart.
In today’ session, traders can keep an eye on the low and high of the doji candle. A close above the high will indicate continuation of the trend, while a close below the doji will signal a pause and profit-booking at higher levels.
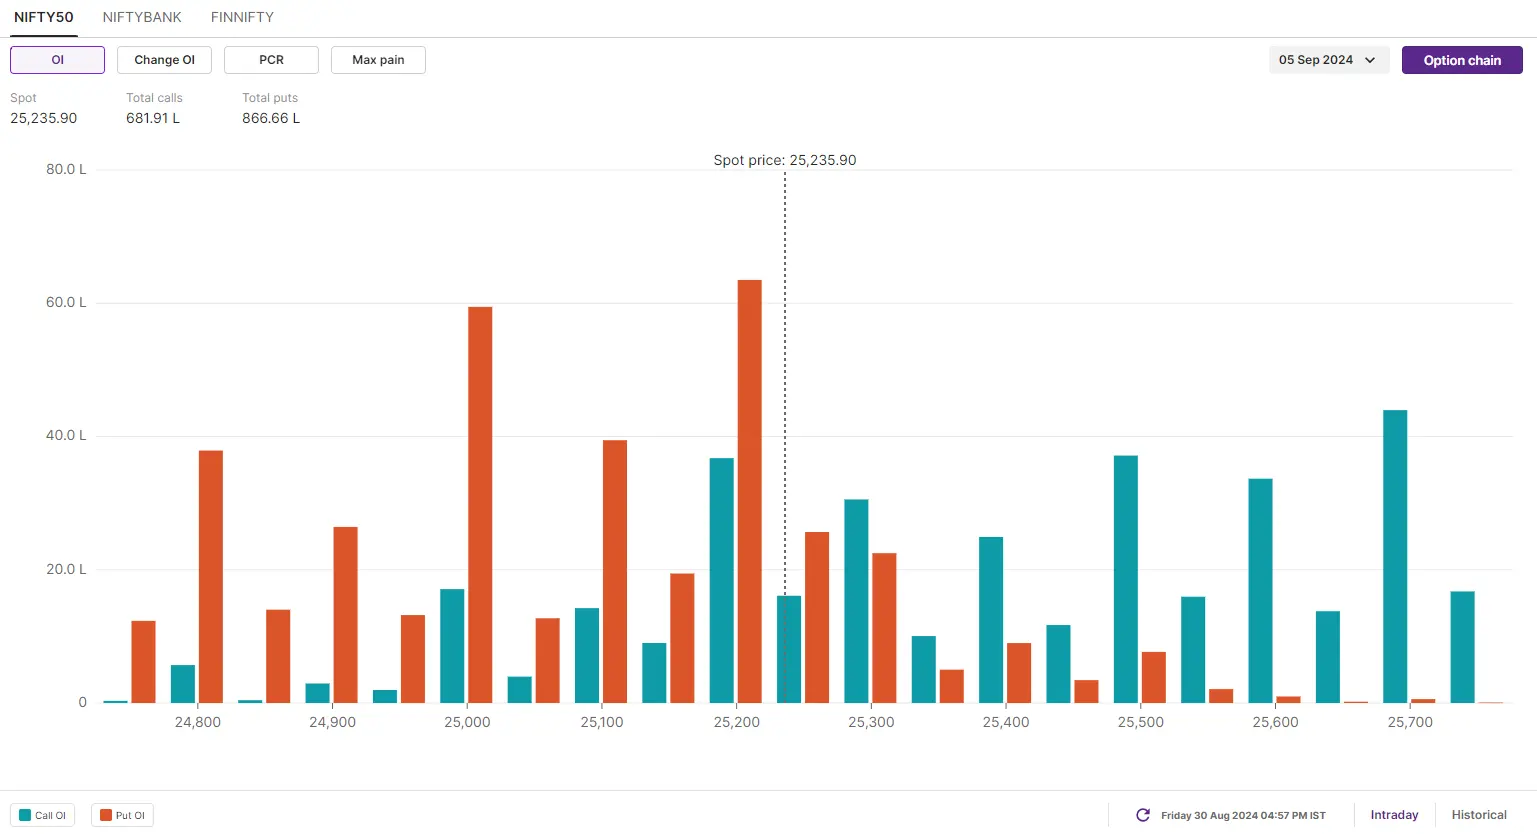
Meanwhile, the open interest data for the 5 September expiry has strong put base at 25,000 and 25,200 strikes, making these as immediate support levels for the index. Conversely, there was no significant accumulation of open interest on call strikes on Friday, with the exception of 26,000, which remains a psychological resistance.
BANK NIFTY
- September Futures: 51,490 (▲0.1%)
- Open Interest: 1,57,419 (▼1.4%)
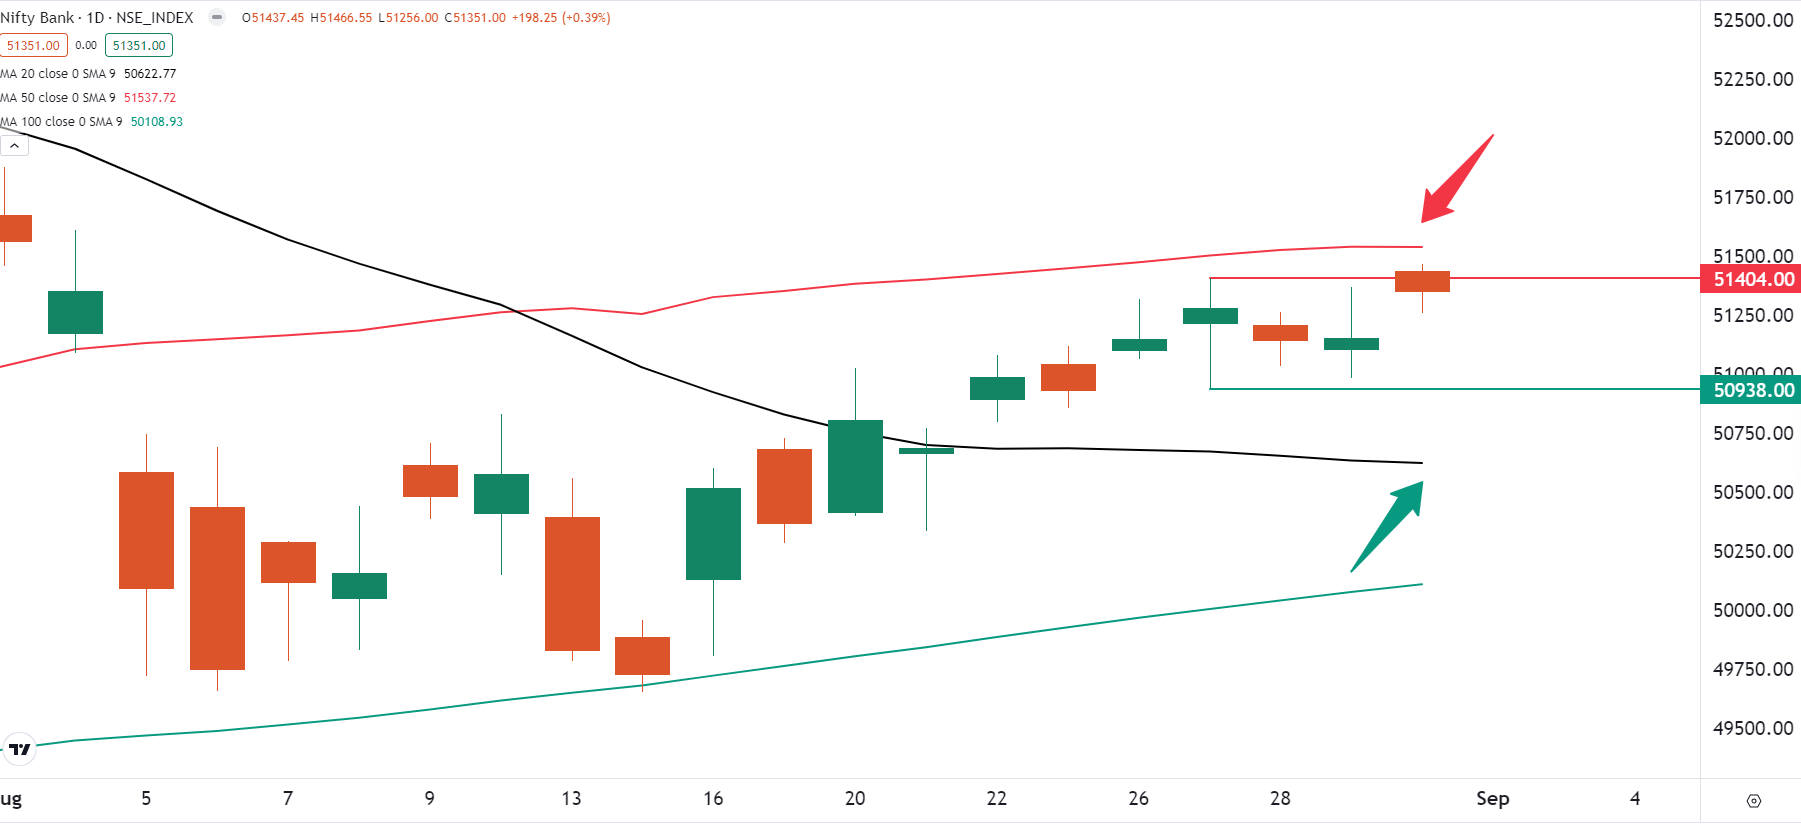
BANK NIFTY extended its range-bound movement for the third day consecutive day, forming a negative candle on the daily chart. Once again, the index encountered the resistance around the 51,500 zone and was unable to close above this crucial level.
In last week's Trade Setup blogs we advised our readers to remain vigilant on the BANK NIFTY's momentum. However, the index remained contained between its 50-day and 20-day moving averages (DMAs), trading within the range established by the 27th candle.
Traders should monitor the 50 and 20 DMA closely. A decisive break above or below these levels could offer traders strong directional signals. Additionally, it is important to note that, that the BANK NIFTY has closed above its previous week’s high and has protected July month’s low (around 50,400) on closing basis.
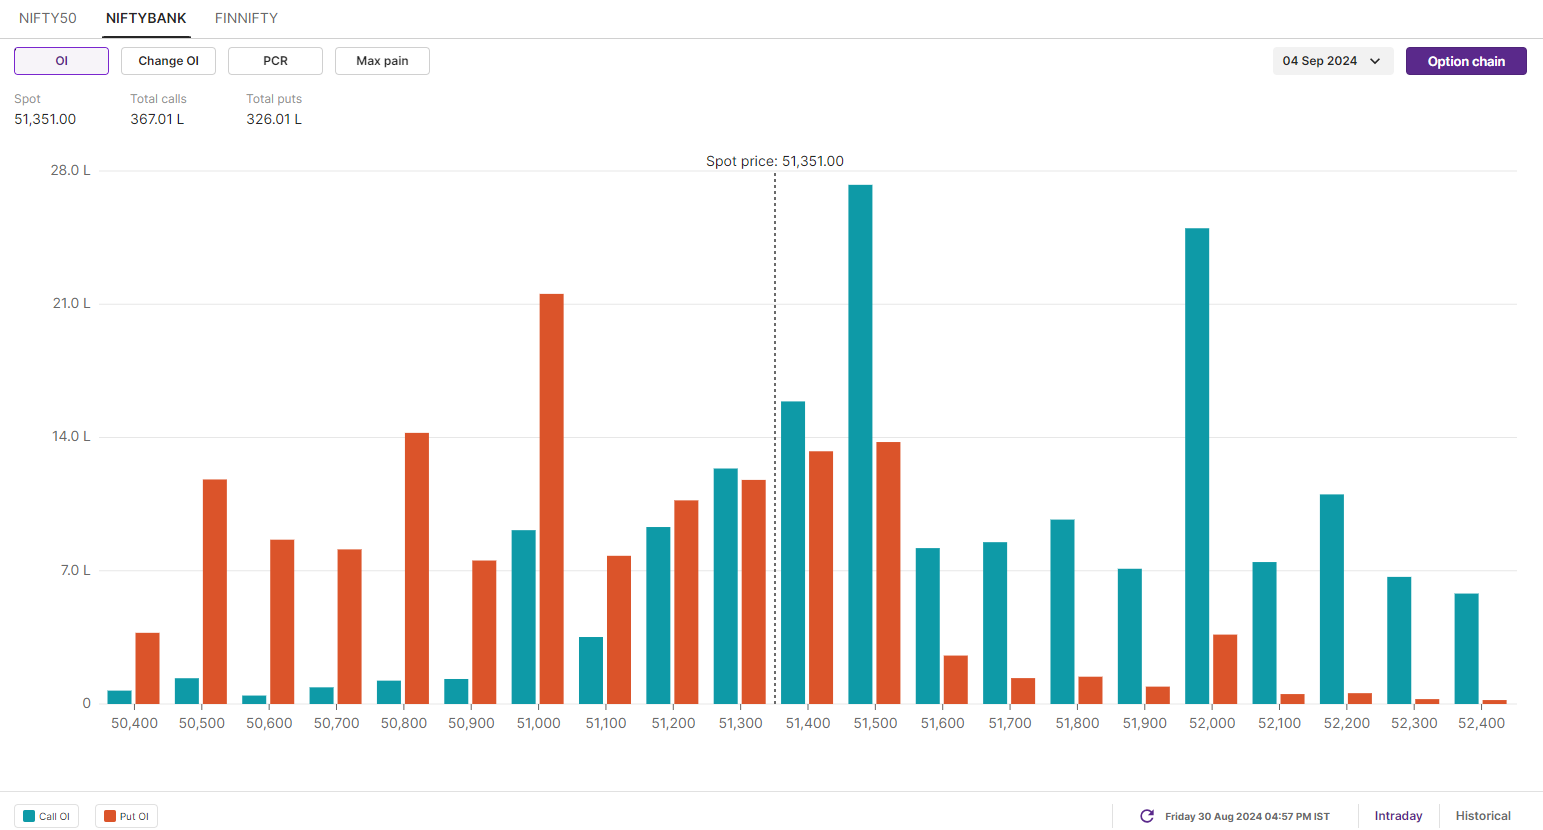
However, the positioning of open interest on the BANK NIFTY offers a contrarian view. The index has strong call open interest at the 51,500 and 52,000 strikes, marking these as immediate resistance zones for the index. On the other hand, the 51,000 and 50,000 levels have the highest put open interest, making these key support zones.
FII-DII activity
Stock scanner
Under F&O Ban: Balrampur Chini Mills
In Futures and Options or F&O, long build-up means an increase in Open Interest (OI) along with an increase in price, and short build-up means an increase in Open Interest(OI) along with a decrease in price.
Source: Upstox and NSE.
Disclaimer: Derivatives trading must be done only by traders who fully understand the risks associated with them and strictly apply risk mechanisms like stop-losses. The information is only for consumption by the client and such material should not be redistributed. We do not recommend any particular stock, securities and strategies for trading. The securities quoted are exemplary and are not recommendatory. The stock names mentioned in this article are purely for showing how to do analysis. Take your own decision before investing.
About The Author
Next Story

