Market News
Trade Setup for Oct 7: BANK NIFTY confirms shooting star pattern, eyes 100 DMA support
.png)
5 min read | Updated on October 07, 2024, 07:42 IST


SUMMARY
The BANK NIFTY ended the week below the previous week’s low, confirming the shooting star candlestick pattern on the weekly chart. However, in the short term, the index has entered the oversold territory and is eyeing support around its 100-day moving average.
Stock list

Foreign Institutional Investors (FIIs) continued their selling spree, offloading ₹9,896 crore worth of shares on October 4.
Asian markets update
The GIFT NIFTY is up 0.3%, indicating a positive start for the NIFTY50 today. Meanwhile, major Asian markets are also trading in the green. Japan’s Nikkei 225 is up 2%, while Hong Kong’s Hang Seng index rose 1.3%.
U.S. market update
- Dow Jones: 42,352 (▲0.8%)
- S&P 500: 5,751 (▲0.9%)
- Nasdaq Composite: 18,137 (▲1.2%)
U.S. indices ended Friday's session on a high note, as stronger than expected September jobs data highlighted continued robust hiring in the U.S. economy. The data from Labour Bureau showed that 2,54,000 jobs were added in September, more than the expectation of 1,50,000.
Additionally, the unemployment rate to 4.1% from 4.2% in August. Following the report, the Fed Funds futures reflects 99% of the market participants expect a 0.25% rate cut in the Fed’s November meeting as opposed to 0.5%.
NIFTY50
- October Futures: 25,173 (▼1.1%)
- Open Interest: 5,51,730 (▲3.3%)
The NIFTY50 extended its decline for the fifth straight day, closing just below the 50-day moving average. The sharp fall was driven by escalating geo-political tensions, a surge in crude oil prices and persistent selling by foreign investors following SEBI’s tightening of rules in the F&O segment.
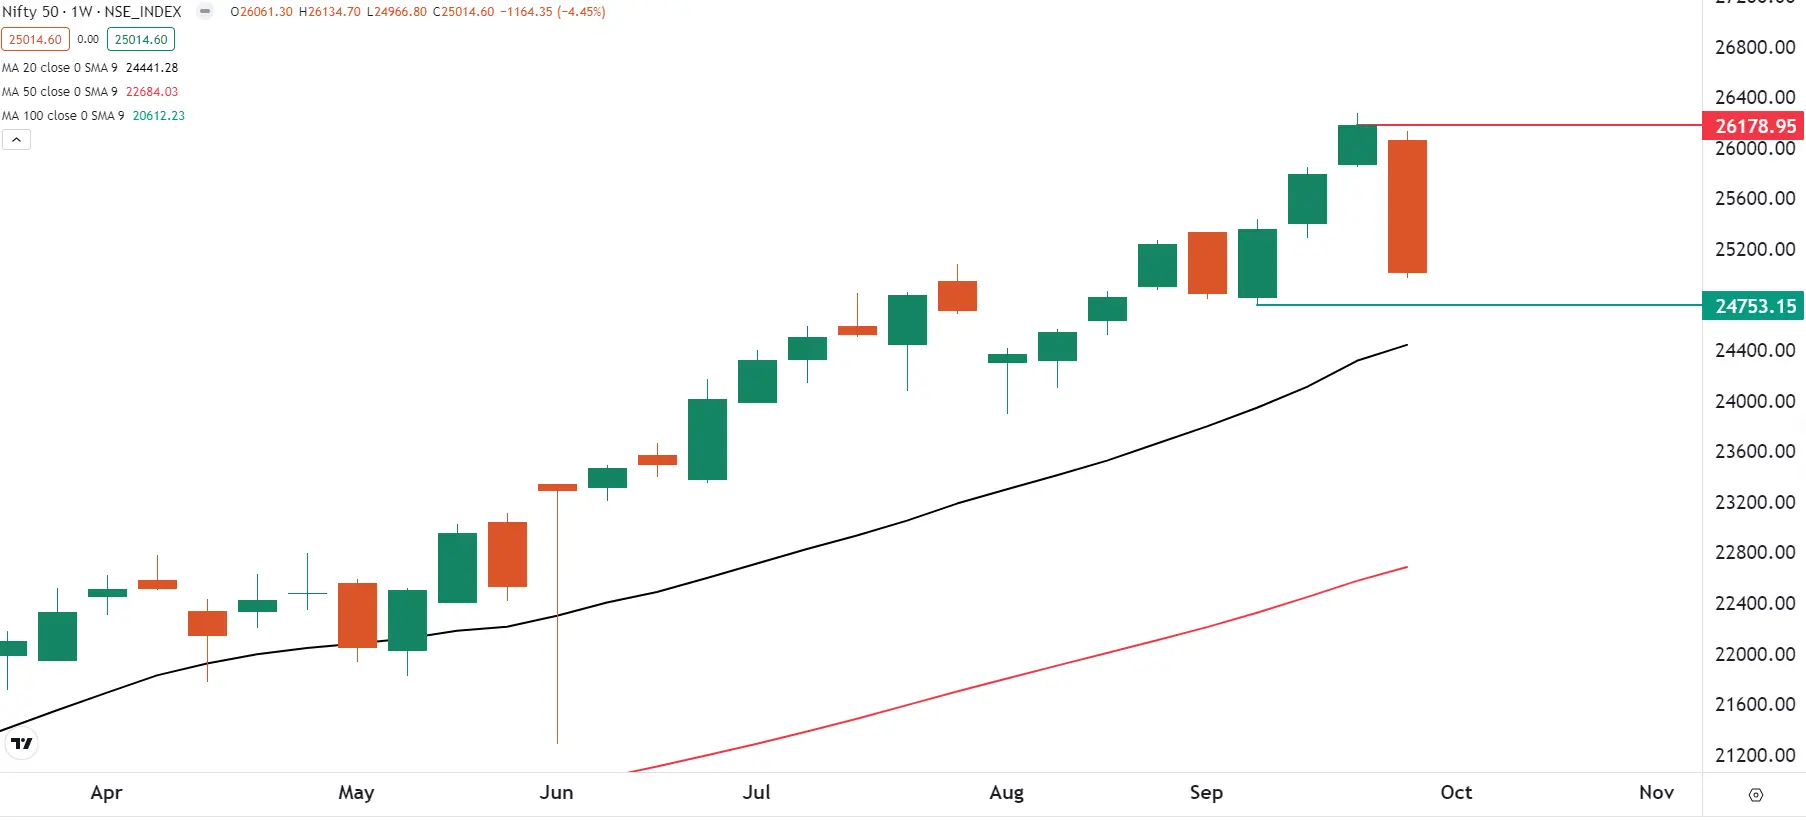
The technical structure of the index on the weekly chart has turned bearish as the index closed the week below the two-week low. As you can see on the chart below, the index is approaching the immediate support zone of 24,700, the low for the month of September. If the index breaks below this level, the next important support will be around 24,400, it's 20 week moving average.
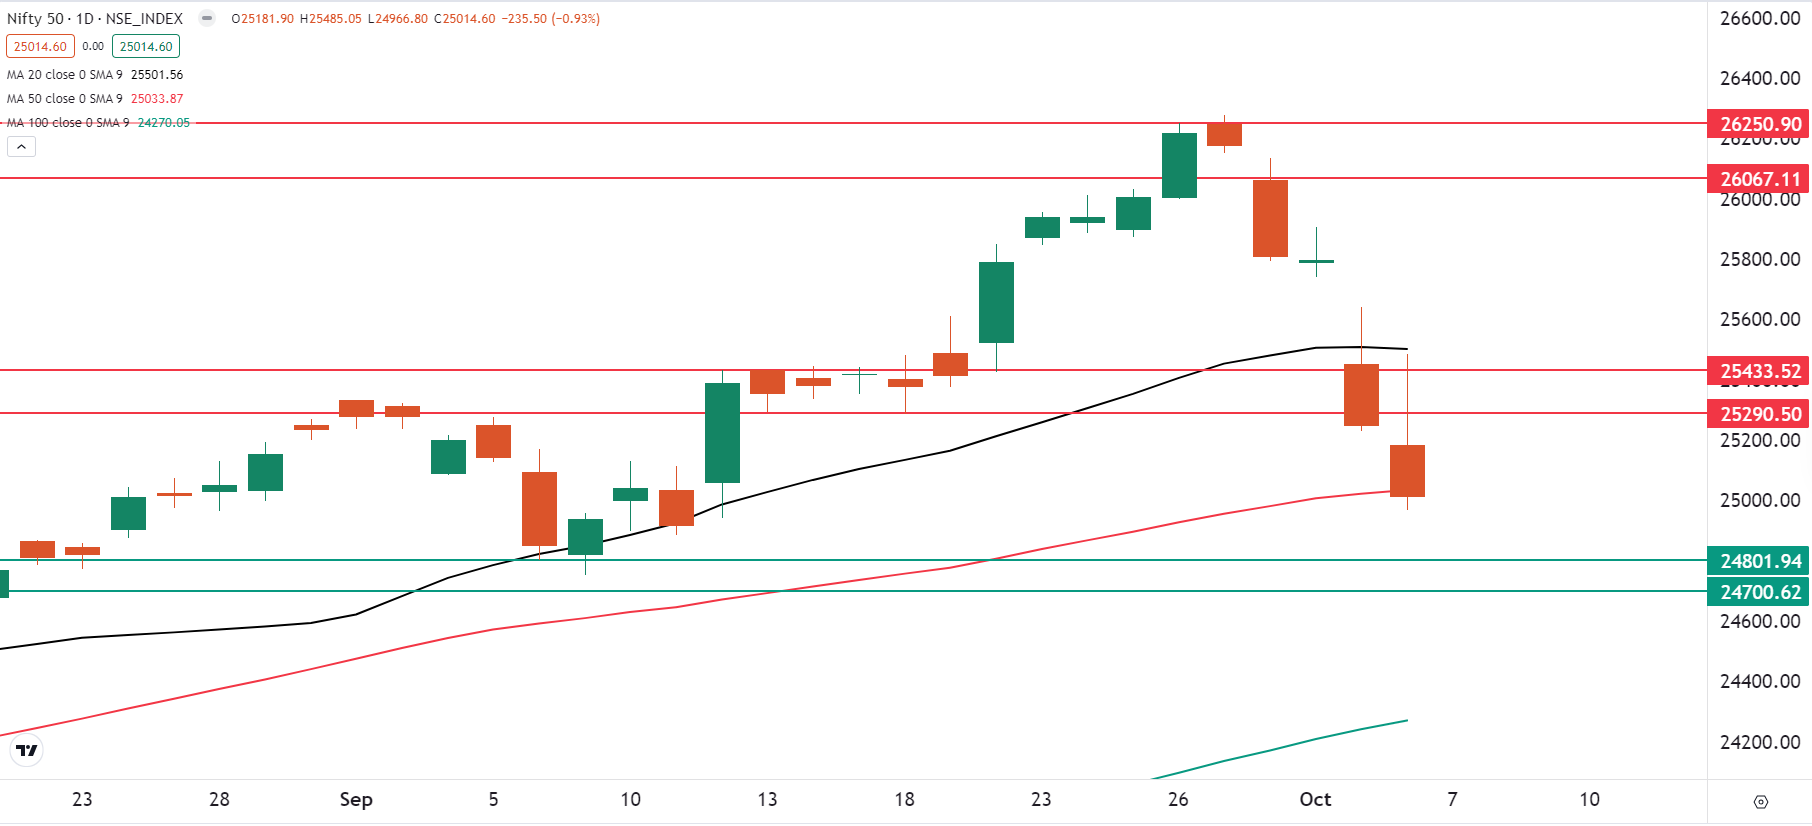
On the daily chart, the index sits at the crucial support of its 50-day moving average (DMA) and has fallen nearly 5% from its peak. This indicates that the index is currently oversold and may see a short-term bounce. However, it is important to note that the index's broader trend has turned negative until it recovers its 20 DMA on a closing basis.
BANK NIFTY
- October Futures: 53,871 (▼0.8%)
- Open Interest: 1,73,552 (▲6.4%)
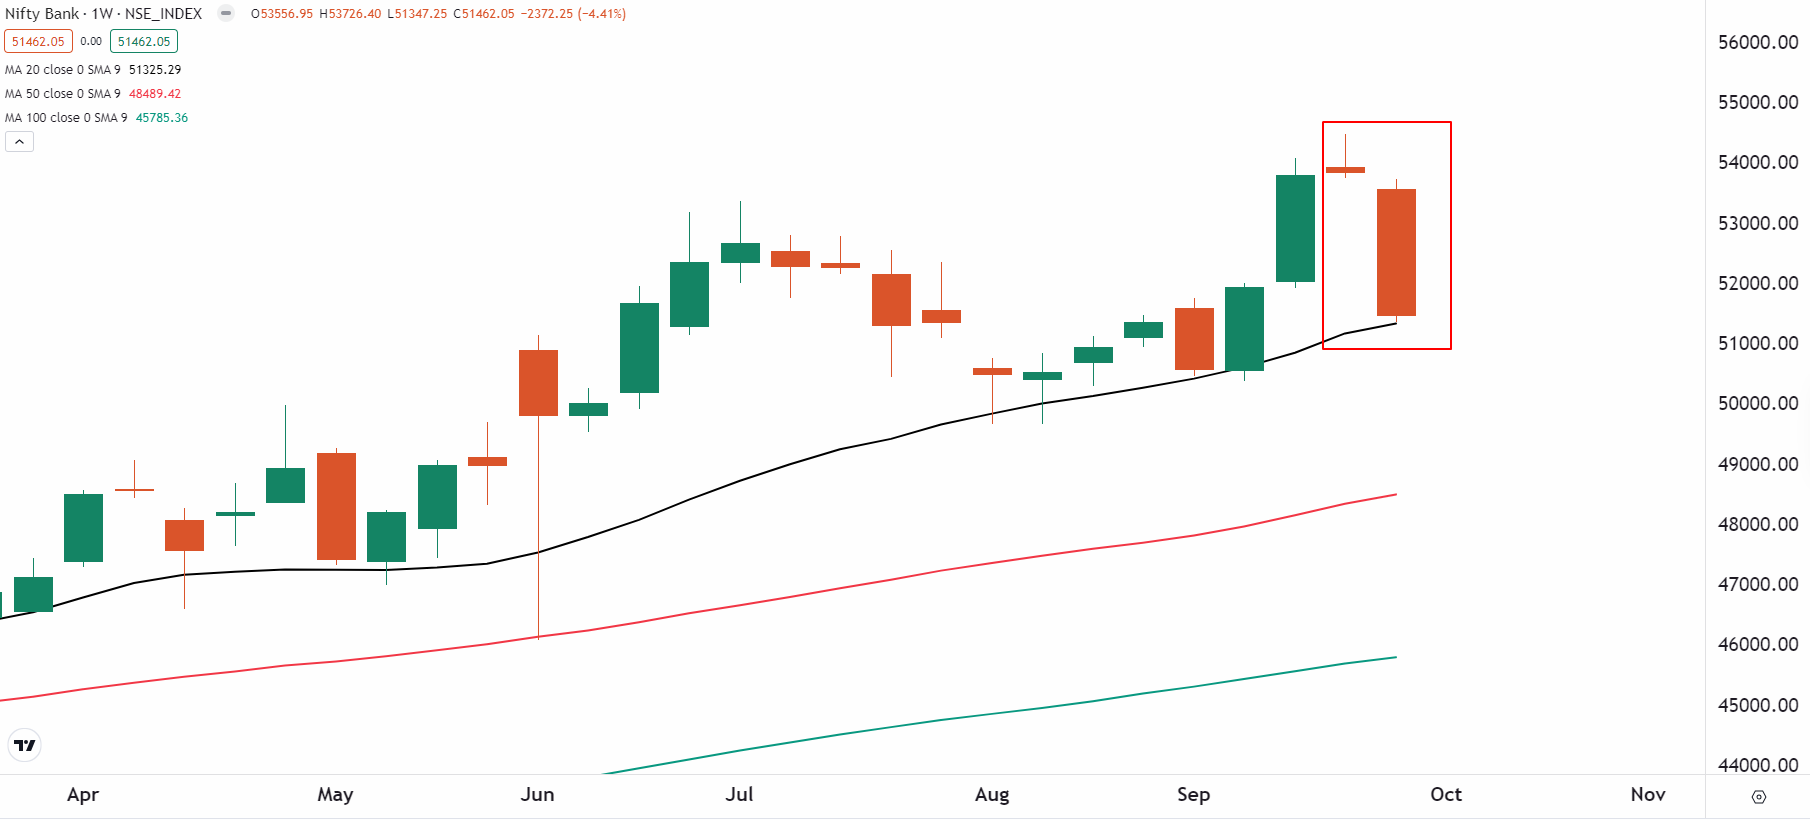
BANK NIFTY index also surrendered its 50-day moving average on Friday and extended the losing streak to the fifth day in a row. The index fell over 5% from its recent peak and formed a large bearish candle on the weekly chart.
As you can see on the chart below, the index ended the week below the previous week's low, confirming the shooting star pattern. It is a bearish reversal pattern with a small red body and a long upper shadow, indicating that buyers pushed the price higher but sellers took control before the close. In addition, the index has approached its 20-week moving average, which could act as immediate support.
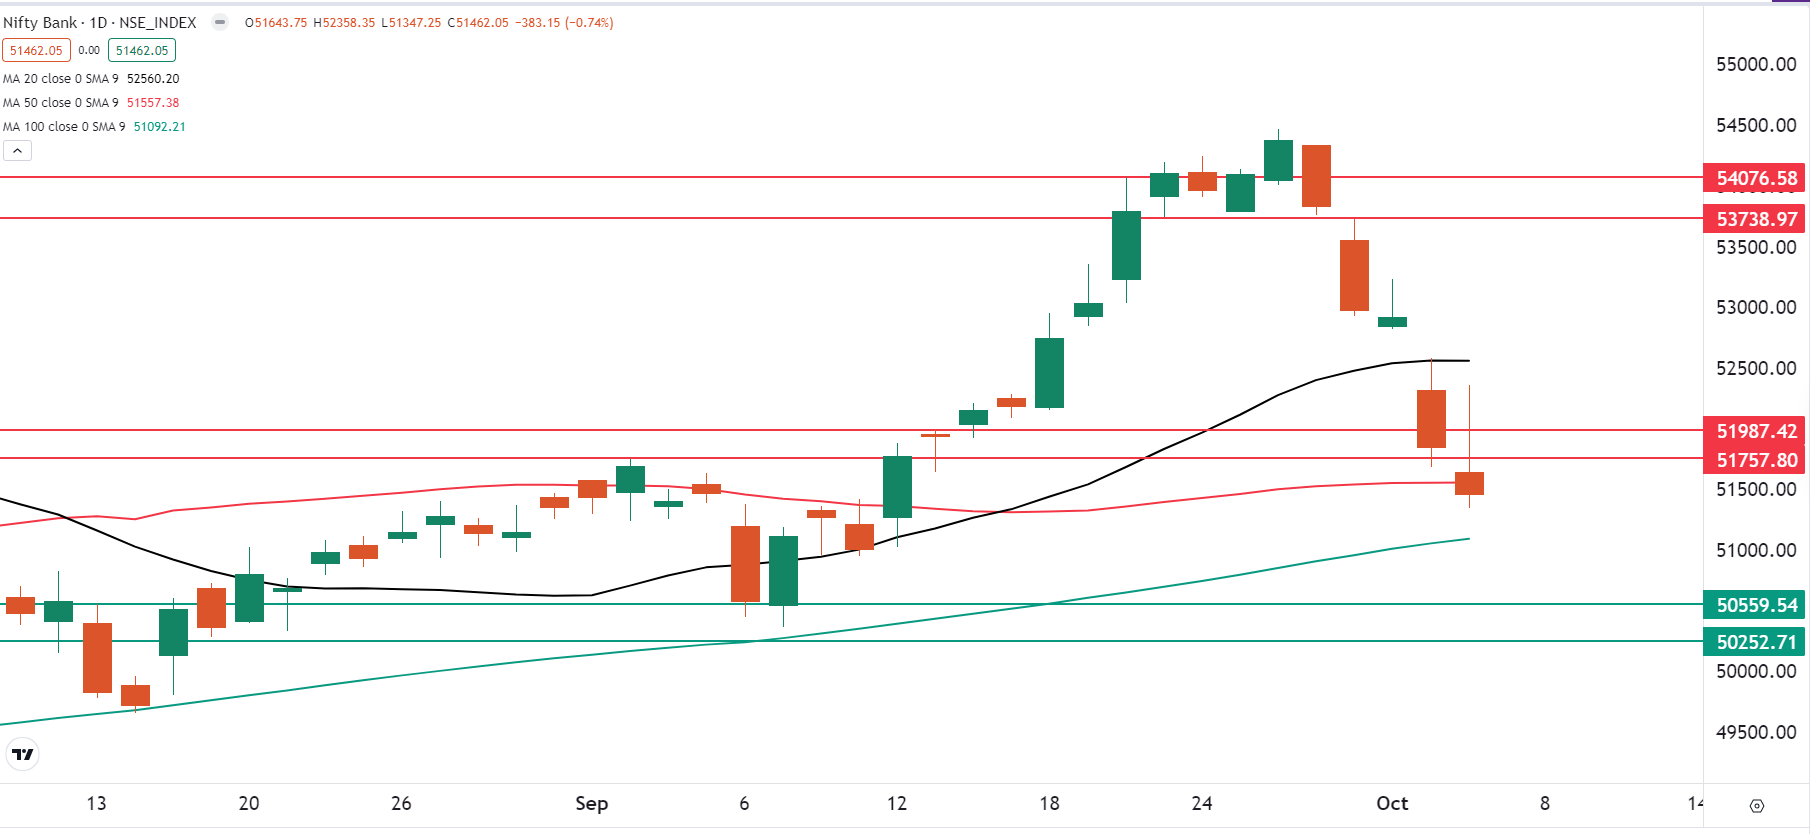
As per the daily chart, the broader trend of the index has turned negative with immediate resistance around its 20-day moving average (DMA). The index surrendered its 50 DMA on Friday and is eyeing the next crucial support zone of 51,000 to 51,100, which coincides with its 100 DMA. However, a short-term bounce cannot be ruled out, as the index has already declined over 5% in the past week.
FII-DII activity
Stock scanner
Under F&O ban: Bandhan Bank, Birlasoft, Gujarat Narmada Valley Fertilizers & Chemicals (GNFC), Granules India, Hindustan Copper, Manappuram Finance and RBL Bank
Out of F&O ban: NIL
Added under F&O ban: Gujarat Narmada Valley Fertilizers & Chemicals (GNFC)
In Futures and Options or F&O, long build-up means an increase in Open Interest (OI) along with an increase in price, and short build-up means an increase in Open Interest(OI) along with a decrease in price.
Source: Upstox and NSE.
Disclaimer: Derivatives trading must be done only by traders who fully understand the risks associated with them and strictly apply risk mechanisms like stop-losses. The information is only for consumption by the client and such material should not be redistributed. We do not recommend any particular stock, securities and strategies for trading. The securities quoted are exemplary and are not recommendatory. The stock names mentioned in this article are purely for showing how to do analysis. Take your own decision before investing.
About The Author
Next Story


