Market News
Trade Setup for Nov 8: NIFTY50 faces rejection from 21 EMA, all eyes on the weekly close
.png)
4 min read | Updated on November 08, 2024, 07:16 IST
SUMMARY
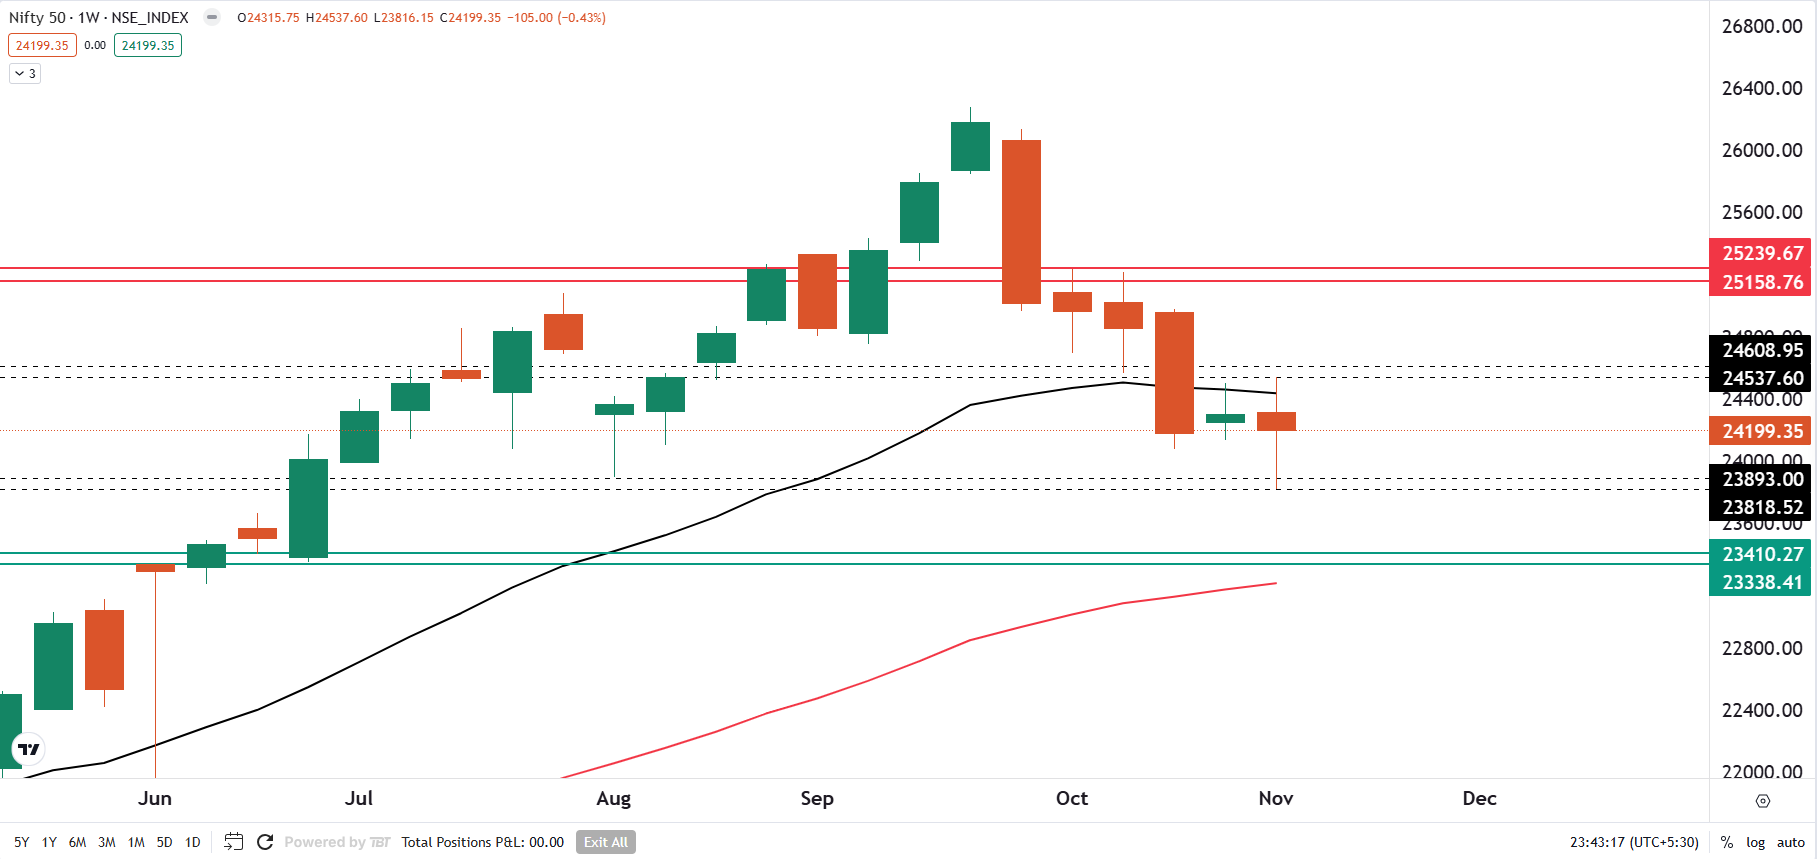
The NIFTY50 index is showing early signs of forming a doji candlestick pattern on the weekly chart. However, traders should closely monitor the weekly closing, as a close above the previous week’s high or low may change the technical structure of the index, providing further directional clues.
Stock list
The technical structure of the NIFTY50 index on weekly chart is currently signalling indecision.
Asian markets @ 7 am
- GIFT NIFTY: 24,279.00 (+0.01%)
- Nikkei 225: 39,543.75 (+0.38%)
- Hang Seng: Closed
U.S. market update
S&P 500: 5,973 (▲0.7%)
Nasdaq Composite: 19,269 (▲1.5%)
U.S. indices extended the positive momentum for the third day in a row and closed at a record high. The markets remained buoyant after the Donald Trump won the U.S Presidential election. In a widely expected move, the U.S. Federal Reserve cut the interest rate by quarter percentage. In a unanimous decision, the central bank lowered the rate in the range of 4.5% to 4.75%.
Notably, the central bank removed language from its September statement that it had "gained greater confidence" that inflation was inching towards its 2% target, suggesting that it may have new concerns about the inflation data.
NIFTY50
- November Futures: 24,300 (▼1.2%)
- Open Interest: 4,57,693 (▲3.0%)
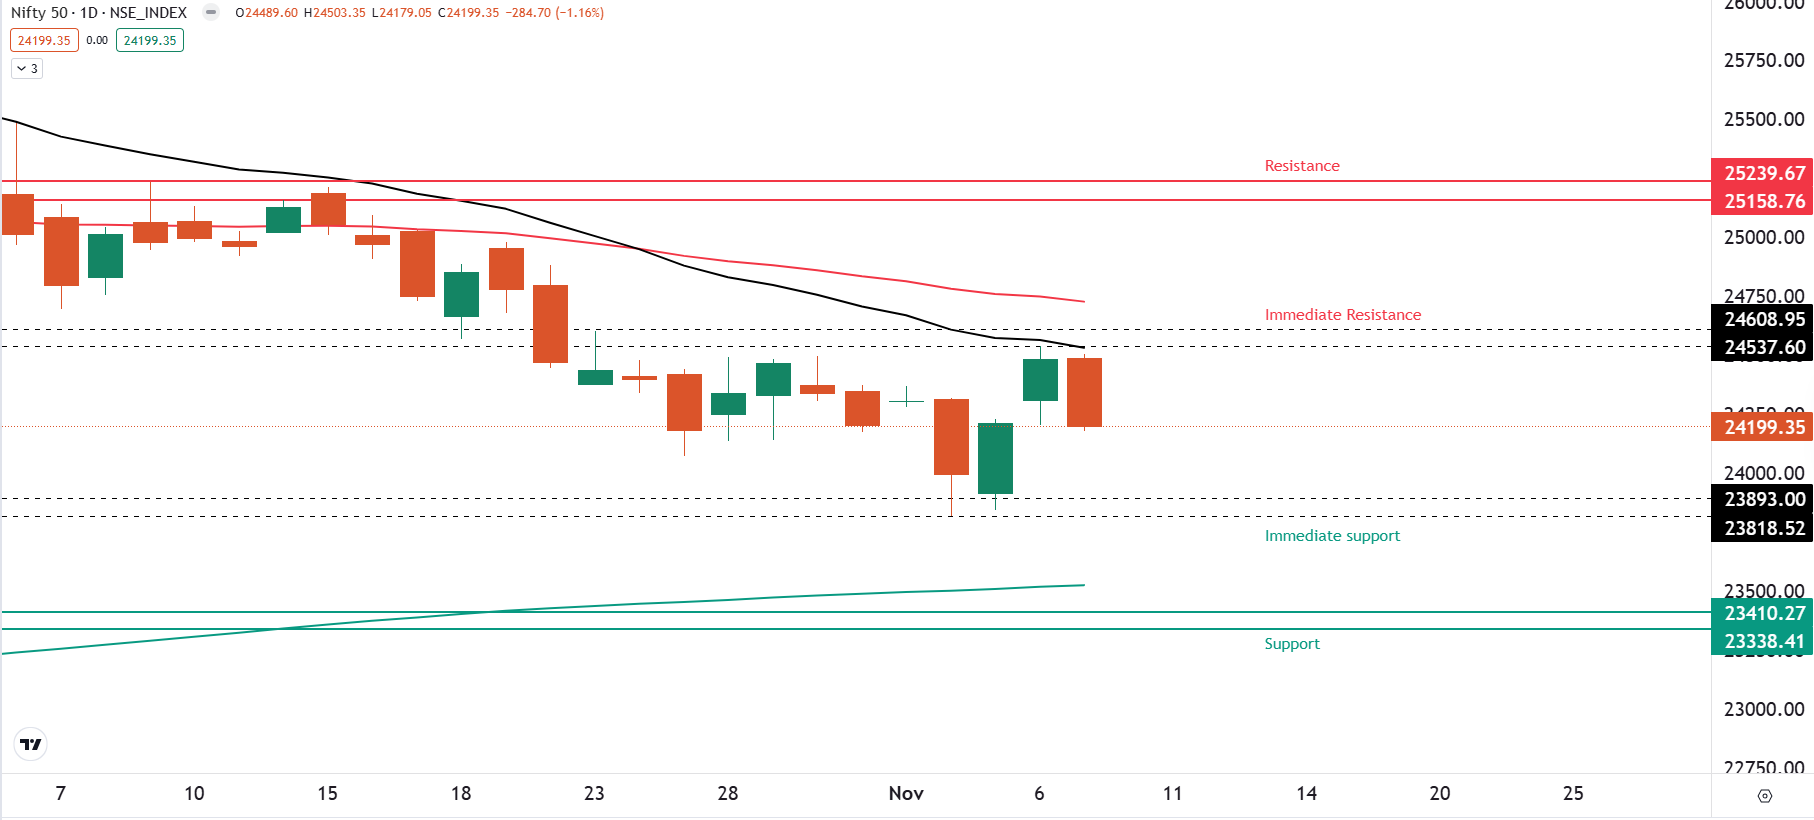
The NIFTY50 index reversed previous day’s gains and formed a bearish candle on the daily chart. The sharp sell-off was led by broad based selling across sectors with metals and energy stocks declining the most.
The technical structure of the index on weekly chart is currently signalling indecision. However, traders should closely monitor the weekly close as a close above or below the previous week’s low and high will change the technical structure of the weekly chart and will provide further directional clues.
On the daily, chart the index failed to close above the immediate resistance zone of 24,500 and 25,600, which coincides with the 21-day exponential moving average (EMA). Unless the index reclaims this zone on closing basis, the trend may remain bearish. On the flip side, if index surrenders the August month low of 23,893, the index may slip towards the 200 EMA, which is around 23,500 and 23,400 zone.
BANK NIFTY
- November Futures: 52,199 (▼0.9%)
- Open Interest: 1,72,311 (▲1.8%)
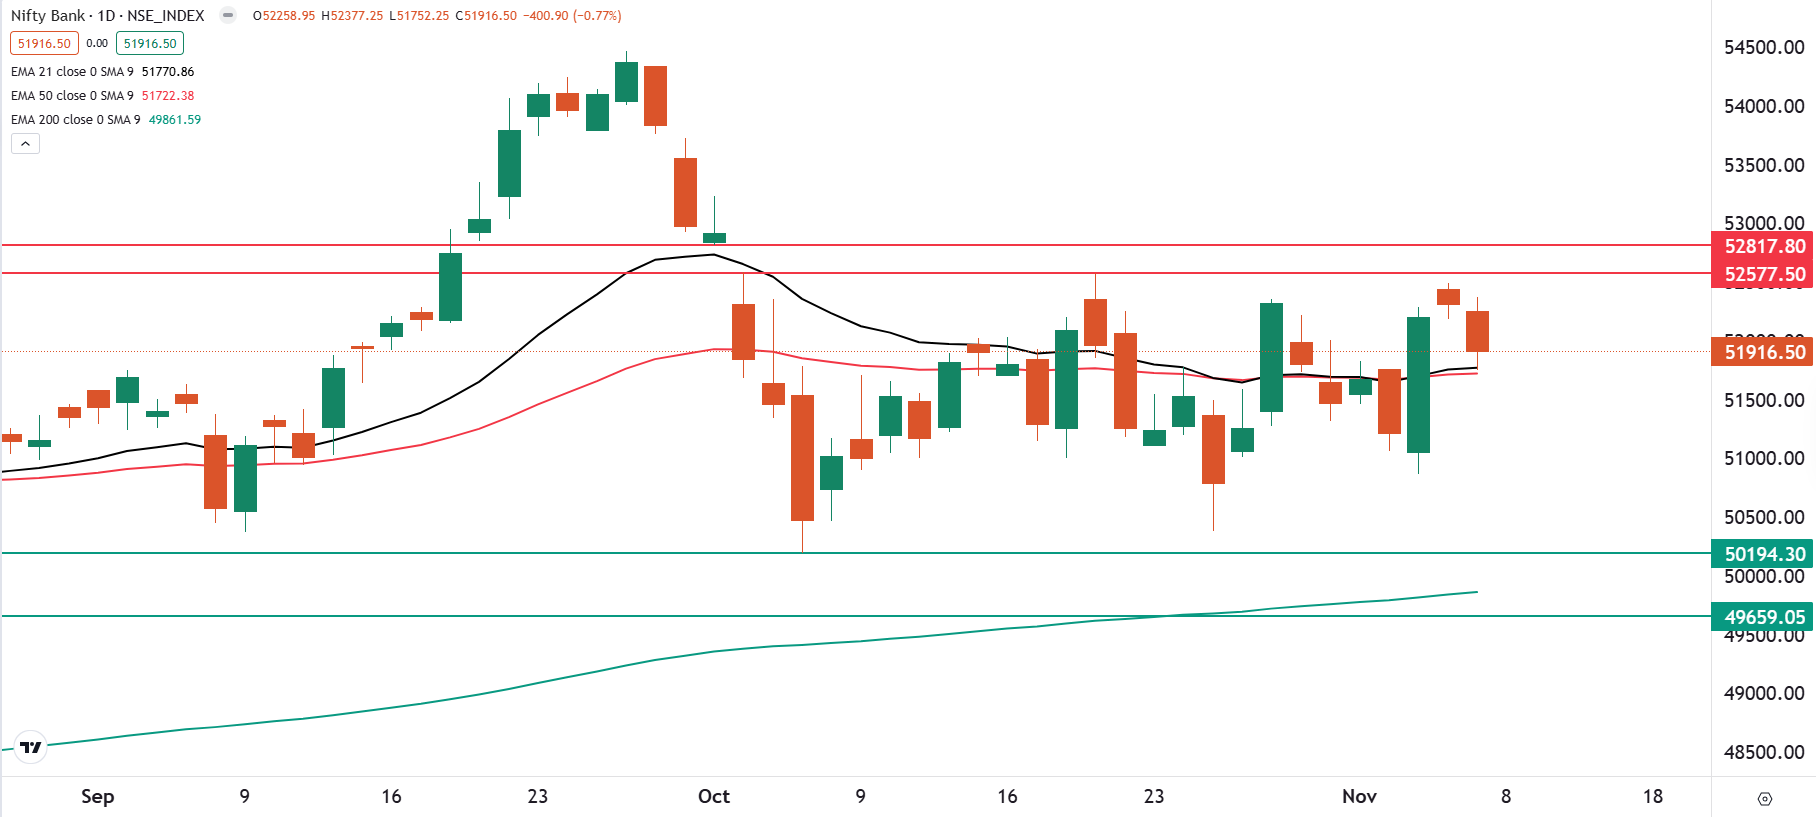
The BANK NIFTY index also came under profit-booking and failed to provide the follow-through of the bullish engulfing candle formed on 5 November. The index formed a negative candle on the daily chart but protected the 21 and 50 EMA on closing basis.
The technical structure of the BANK NIFTY on the weekly chart is also signalling a indecision as the index is indicating a formation of doji candlestick pattern. However, the index is currently protecting the low of the hammer candle (50,200) formed on the week ending 11 October. Unless the index surrenders this low on closing basis, the trend may remain sideways to bullish.
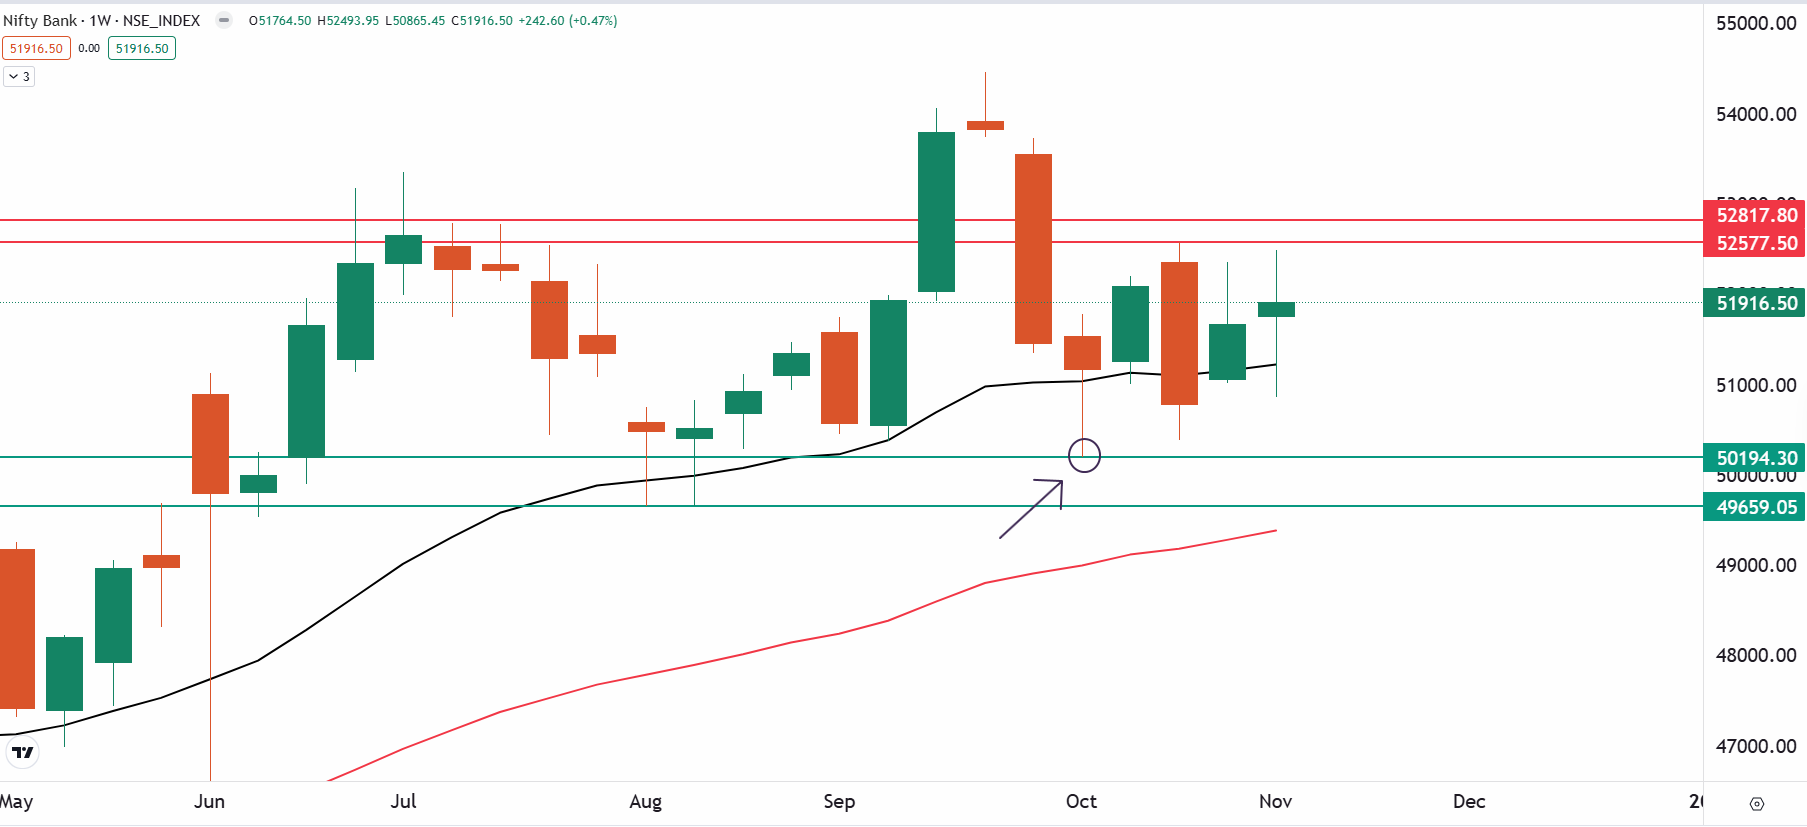
Meanwhile, on the daily chart, the index has failed to provide the follow-through of the bullish engulfing pattern formed on 5th November. It is currently placed at a crucial juncture as a close above the immediate resistance zone of 52,500 and 52,700 may open the doors for fresh all-time high. On the other hand, if index surrenders the 51,000 mark on closing basis, then it may test it may test its 200 EMA zone.
FII-DII activity
Stock scanner
Under F&O ban: Aditya Birla Fashion and Retail and Granules India
In Futures and Options or F&O, long build-up means an increase in Open Interest (OI) along with an increase in price, and short build-up means an increase in Open Interest(OI) along with a decrease in price.
Source: Upstox and NSE.
Disclaimer: Derivatives trading must be done only by traders who fully understand the risks associated with them and strictly apply risk mechanisms like stop-losses. The information is only for consumption by the client and such material should not be redistributed. We do not recommend any particular stock, securities and strategies for trading. The securities quoted are exemplary and are not recommendatory. The stock names mentioned in this article are purely for showing how to do analysis. Take your own decision before investing.
About The Author
Next Story

