Market News
Trade Setup for Nov 6: NIFTY50 defends August month low, forms bullish harami pattern
.png)
4 min read | Updated on November 06, 2024, 07:16 IST
SUMMARY
A bullish harami is a two-candle pattern that signals a possible reversal from a downtrend to an uptrend. The pattern will get confirmed it the close of the subsequent candle is above the high of the reversal pattern.
Stock list
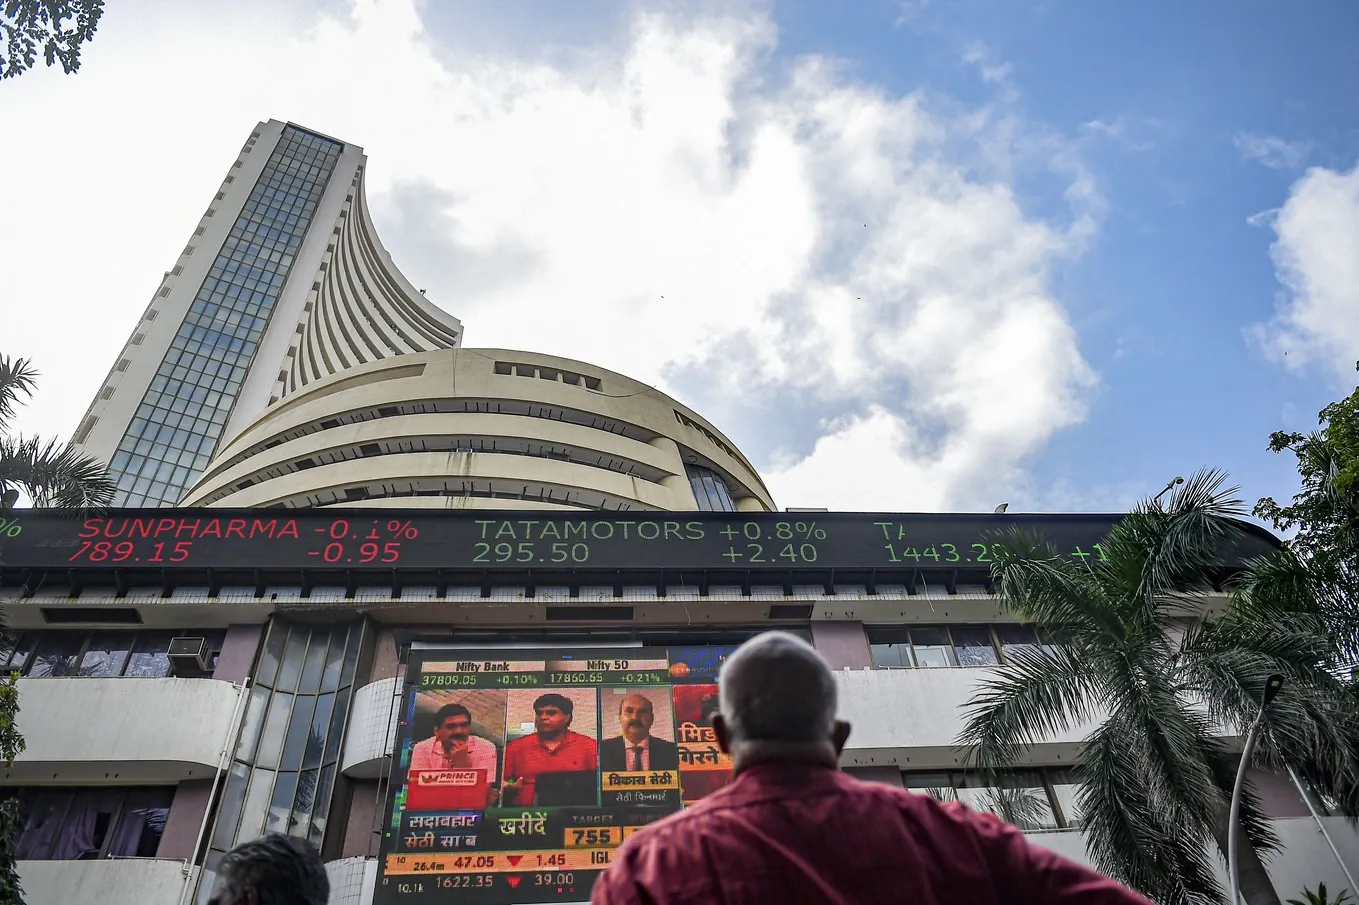
In a volatile session, the NIFTY50 index rose over 1% from the previous session’s low and reclaimed the 24,000 mark on closing basis.
Asian markets update
The GIFT NIFTY remains unchanged, indicating a flat start for the NIFTY50 today. Meanwhile, the other Asian indices are trading mixed. Japan’s Nikkei is up over 1%, while Hong Kong’s Hang Seng index is down 1.2%.
U.S. market update
- Dow Jones: 42,221 (▲1.0%)
- S&P 500: 5,782 (▲1.2%)
- Nasdaq Composite: 18,439 (▲1.2%)
U.S. market ended the Tuesday’s session in the green as investors awaited the results of the U.S. presidential election. The race between President Donald Trump and Vice President Kamala Harris is expected to be tight. The attention remains on which party dominates the Congress, given that a clear majority would contribute to spending changes and revamp of tax policy.
NIFTY50
- November Futures: 24,295 (▲0.7%)
- Open Interest: 4,46,917 (▲0.2%)
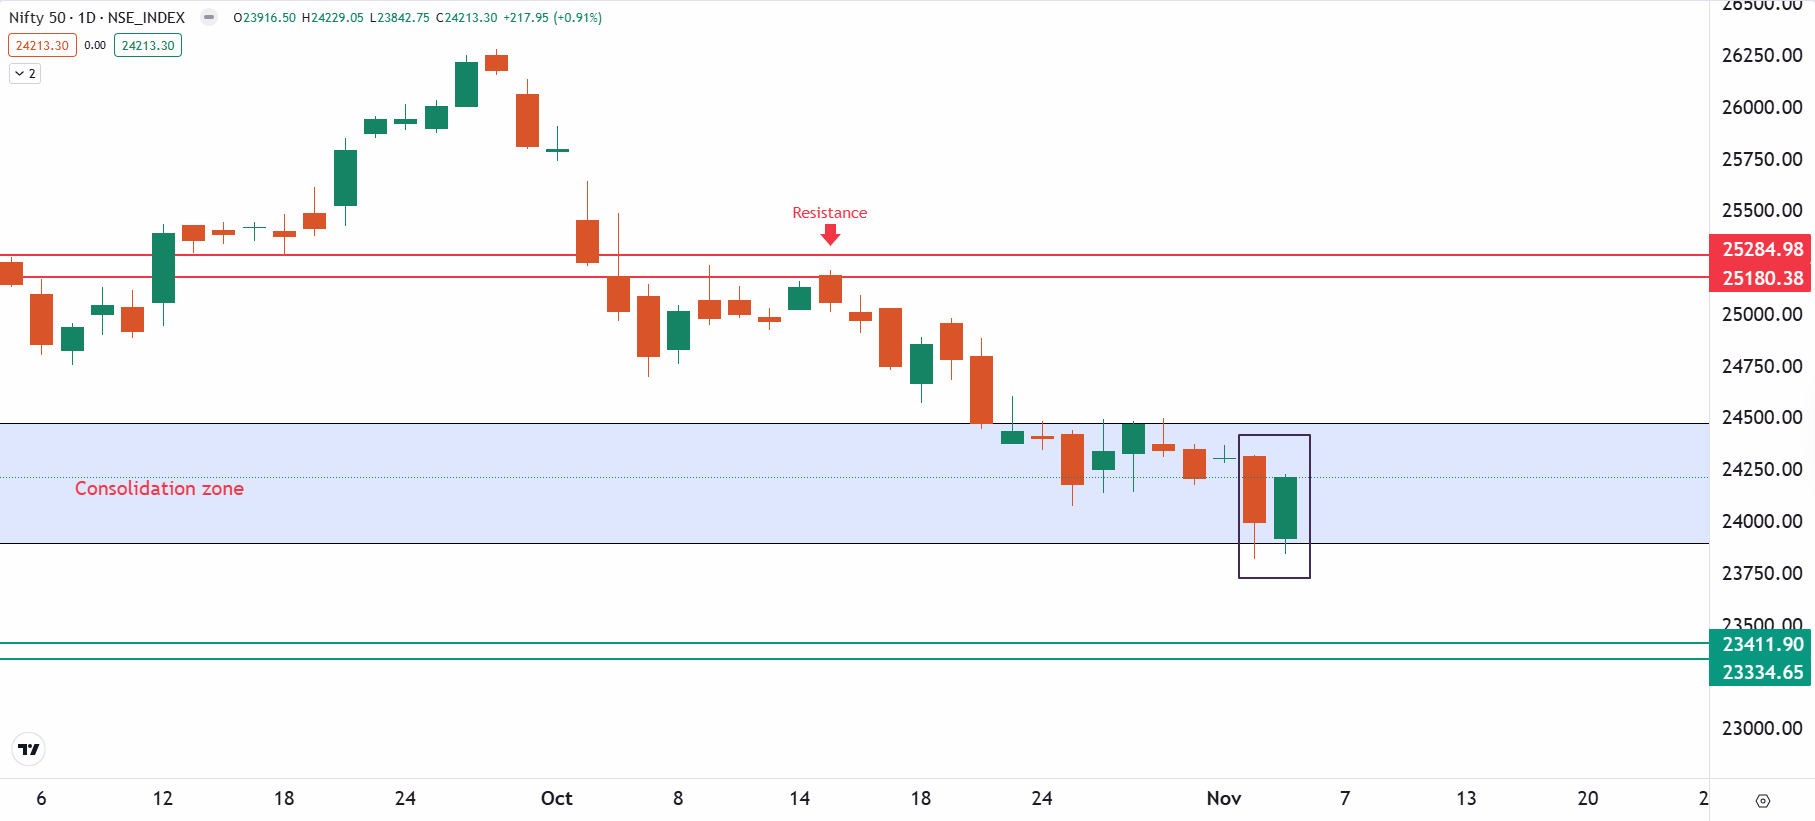
In a volatile session, the NIFTY50 index rose over 1% from the previous session’s low and reclaimed the 24,000 mark on closing basis. The strong rebound was led by gains in the banking stocks.
On the daily chart, the NIFTY50 index formed a bullish harami pattern. It is a two-candle pattern that signals a possible reversal from a downtrend to an uptrend. It occurs when a bullish candle follows a large bearish candle, with the body of the second candle completely within the first, suggesting indecision and a possible change in sentiment. The pattern will get confirmed it the close of the subsequent candle is above the high of the reversal pattern.
However, unless the index breaks the consolidation zone of 23,900 and 24,500 on closing basis, the trend may remain sideways.
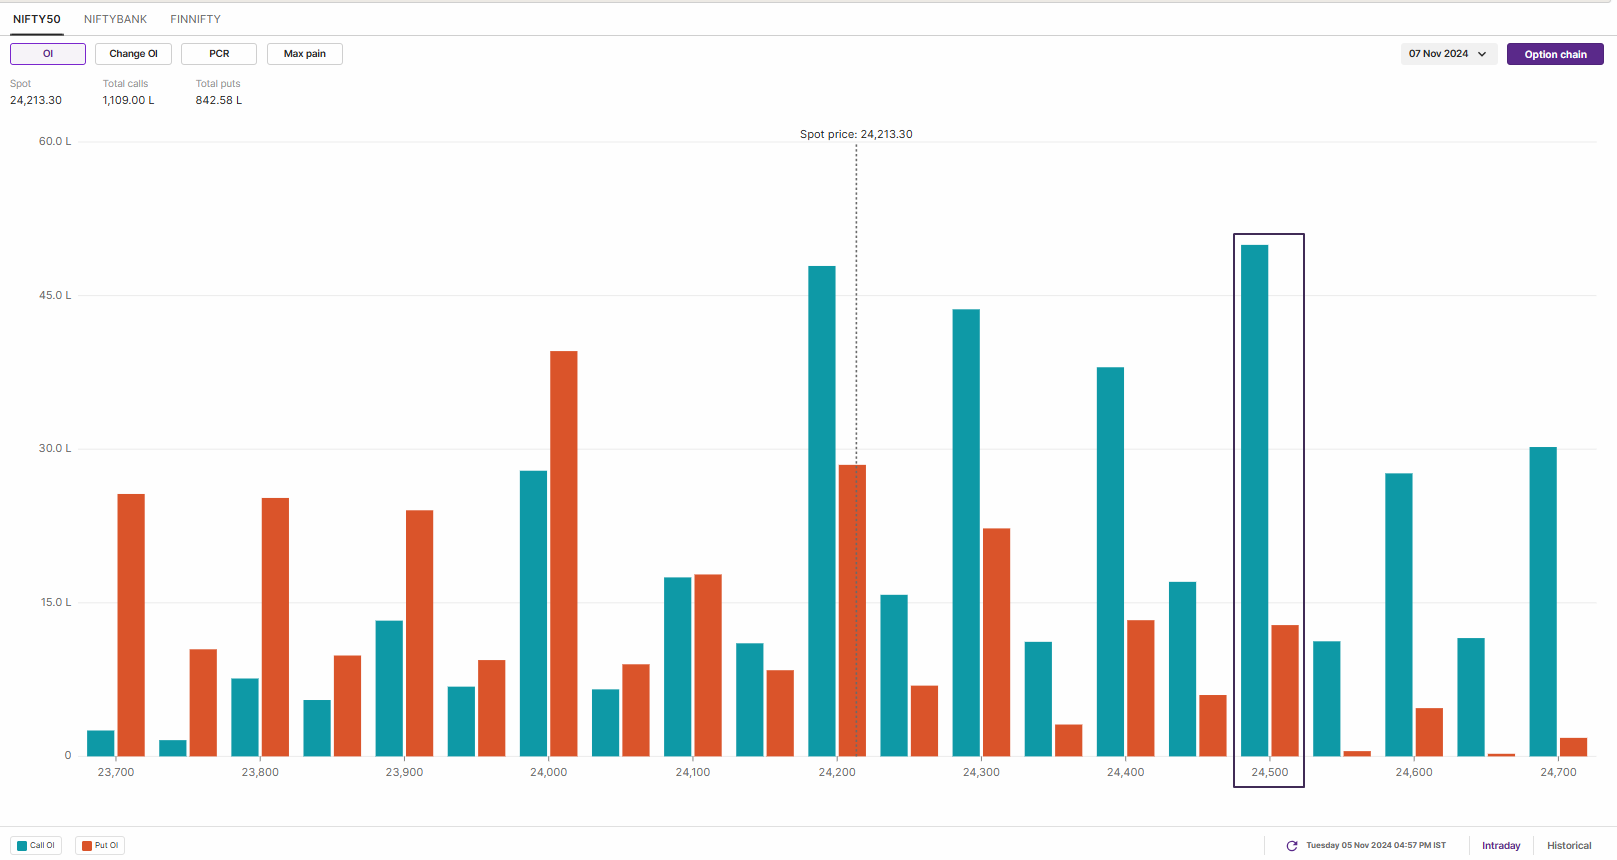
The open interest data for the 7 November has significant call base at 24,200 and 24,500 strikes, indicating resistance for the index around these levels. On the flip side, the put base was seen at 24,000 strike, suggesting support for the index around these levels. Meanwhile, the index also witnessed significant call unwinding at 24,000, 24,100 and 24,300 strikes.
BANK NIFTY
- November Futures: 52,393 (▲1.5%)
- Open Interest: 1,64,535 (▼9.2%)
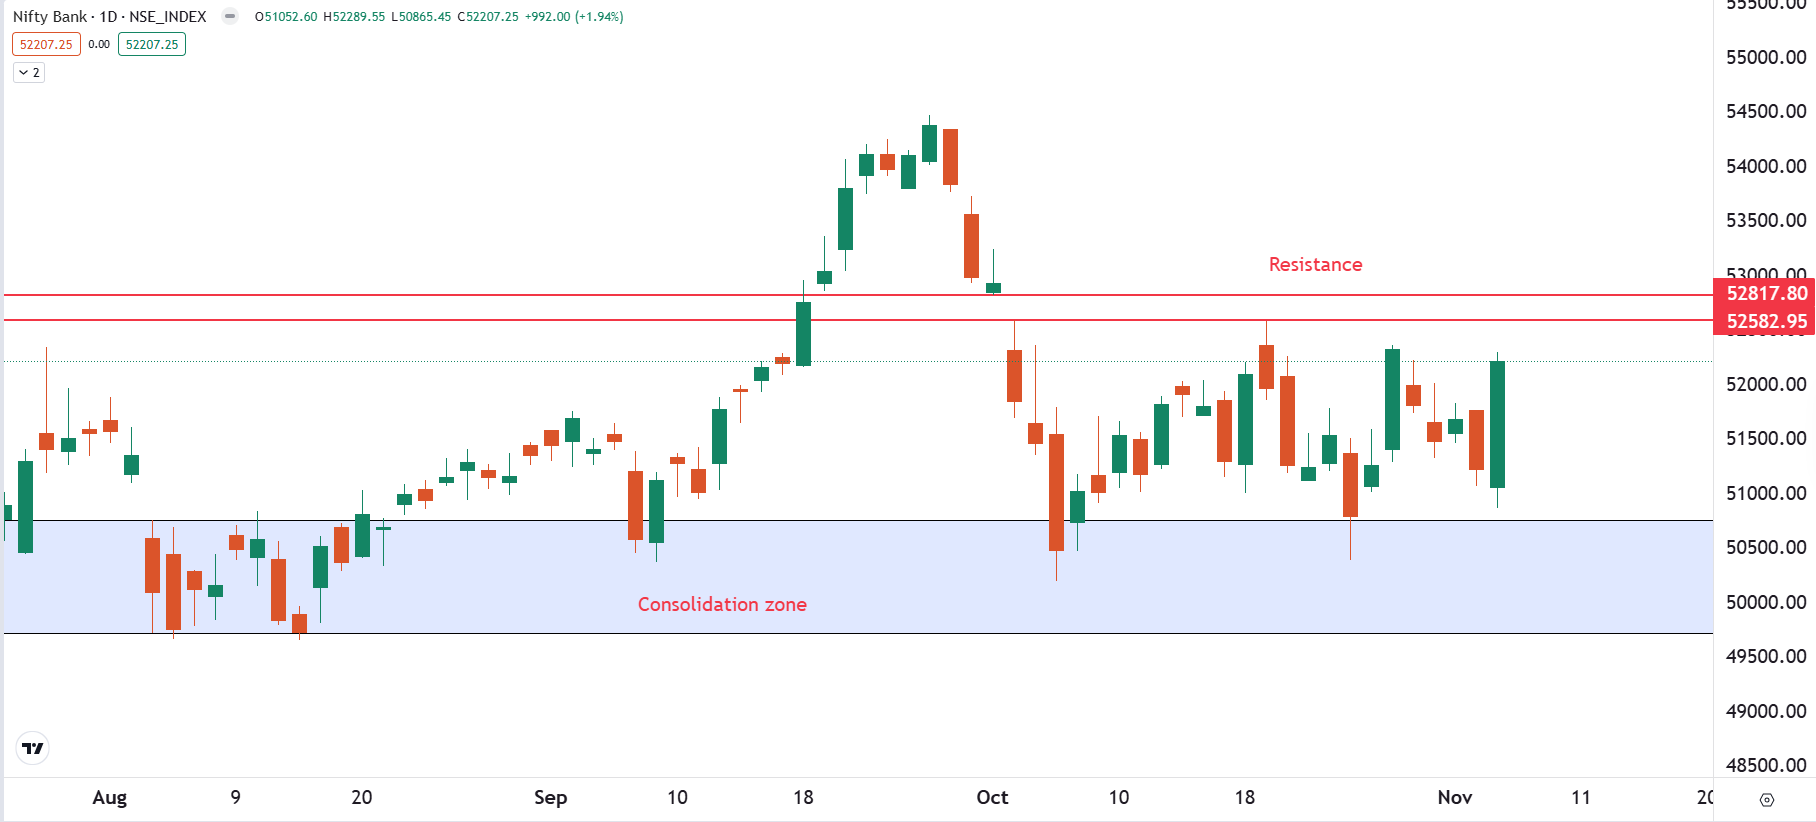
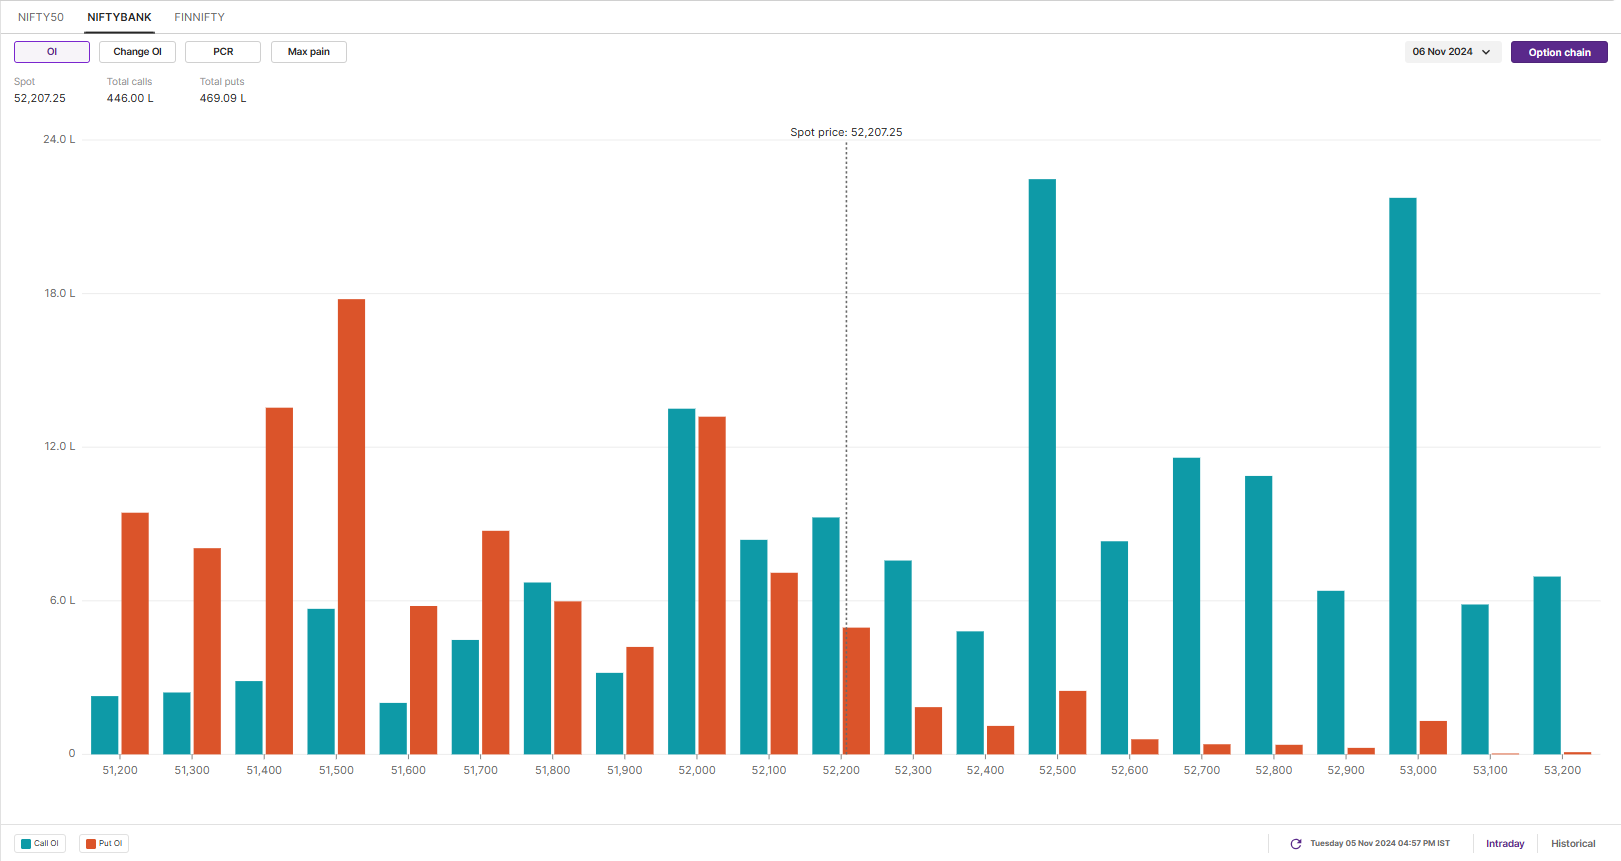
The BANK NIFTY index rebounded from the crucial support of 51,000 and rose over 2%, forming a bullish engulfing candle on the daily chart. The strong rebound was led by index heavyweights private banks.
The index formed a strong bullish engulfing candle on the daily chart. However, the index is broadly consolidating between 52,500 and 49,700 zone. Unless the index breaks this zone on closing basis, the trend may remain range-bound.
The open interest positioning for the 6 November expiry has highest call base at 52,500 and 53,000 strikes, indicating resistance for the index around these levels. Conversely, the put base was seen at 51,000 strike, hinting at support for the index around this support.
FII-DII activity
Stock scanner
Short build-up: J K Cement, ABB, Berger Paints and Trent
Under F&O ban: NIL
In Futures and Options or F&O, long build-up means an increase in Open Interest (OI) along with an increase in price, and short build-up means an increase in Open Interest(OI) along with a decrease in price.
Source: Upstox and NSE.
Disclaimer: Derivatives trading must be done only by traders who fully understand the risks associated with them and strictly apply risk mechanisms like stop-losses. The information is only for consumption by the client and such material should not be redistributed. We do not recommend any particular stock, securities and strategies for trading. The securities quoted are exemplary and are not recommendatory. The stock names mentioned in this article are purely for showing how to do analysis. Take your own decision before investing.
About The Author
Next Story

