Market News
Trade Setup for Nov 22: NIFTY50 sustains below 200 EMA, all eyes on 23,000 support zone
.png)
4 min read | Updated on November 22, 2024, 08:04 IST
SUMMARY
The NIFTY50 index is hovering near the critical support zone of 23,000 to 23,200, a level that aligns with the highs recorded during the June 2024 general election results and exit poll day. A decisive close below this zone could pave the way for increased selling pressure, whereas a close above it would indicate a continuation of range-bound movement around the 200-day EMA.
Stock list

NIFTY50 ended Thursday's session in the red, sustaining a close below 200 exponential moving average for the third day in a row
Asian markets @ 7 am
- GIFT NIFTY: 23,440 (▼0.1%)
- Nikkei 225: 38,415 (▲1.0%)
- Hang Seng: 19,547 (▼0.2%)
U.S. market update
- Dow Jones: 43,870 (▲1.0%)
- S&P 500: 5,948 (▲0.5%)
- Nasdaq Composite: 18,972 (▲0.0%)
U.S. indices ended Thursday's session on a positive note as investors digested Nvidia's Q3 earnings and the Department of Justice's (DOJ) push for Google to divest Chrome. Investors flocked to financials and rotated out of technology names. Meanwhile, Alphabet (Google) shares plunged over 4% after the DOJ said in its filing that Google should divest its Chrome browser to end monopoly.
NIFTY50
- November Futures: 23,348 (▼0.7%)
- Open Interest: 4,49,327 (▼2.2%)
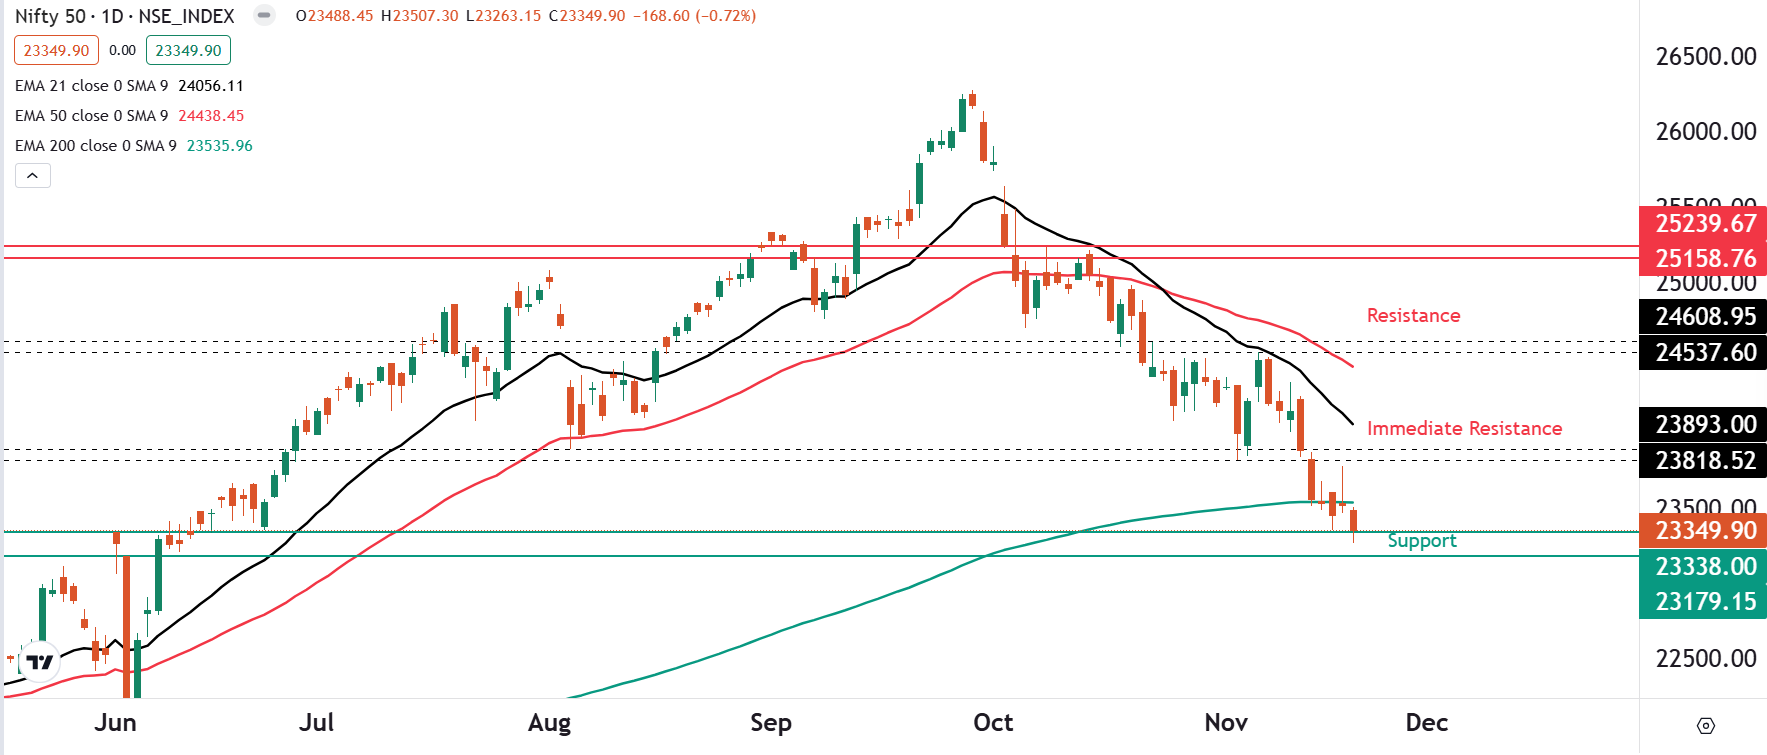
The NIFTY50 index ended Thursday's session in the red, sustaining a close below 200 exponential moving average for the third day in a row. The index started the day on the negative note after shares of Adani group were in free fall on Thursday 21 November. This comes after Gautam Adani, the Chairman of Adani group, was indicted by U.S. prosecutors for his alleged role in a $265 million scheme to bribe Indian officials.
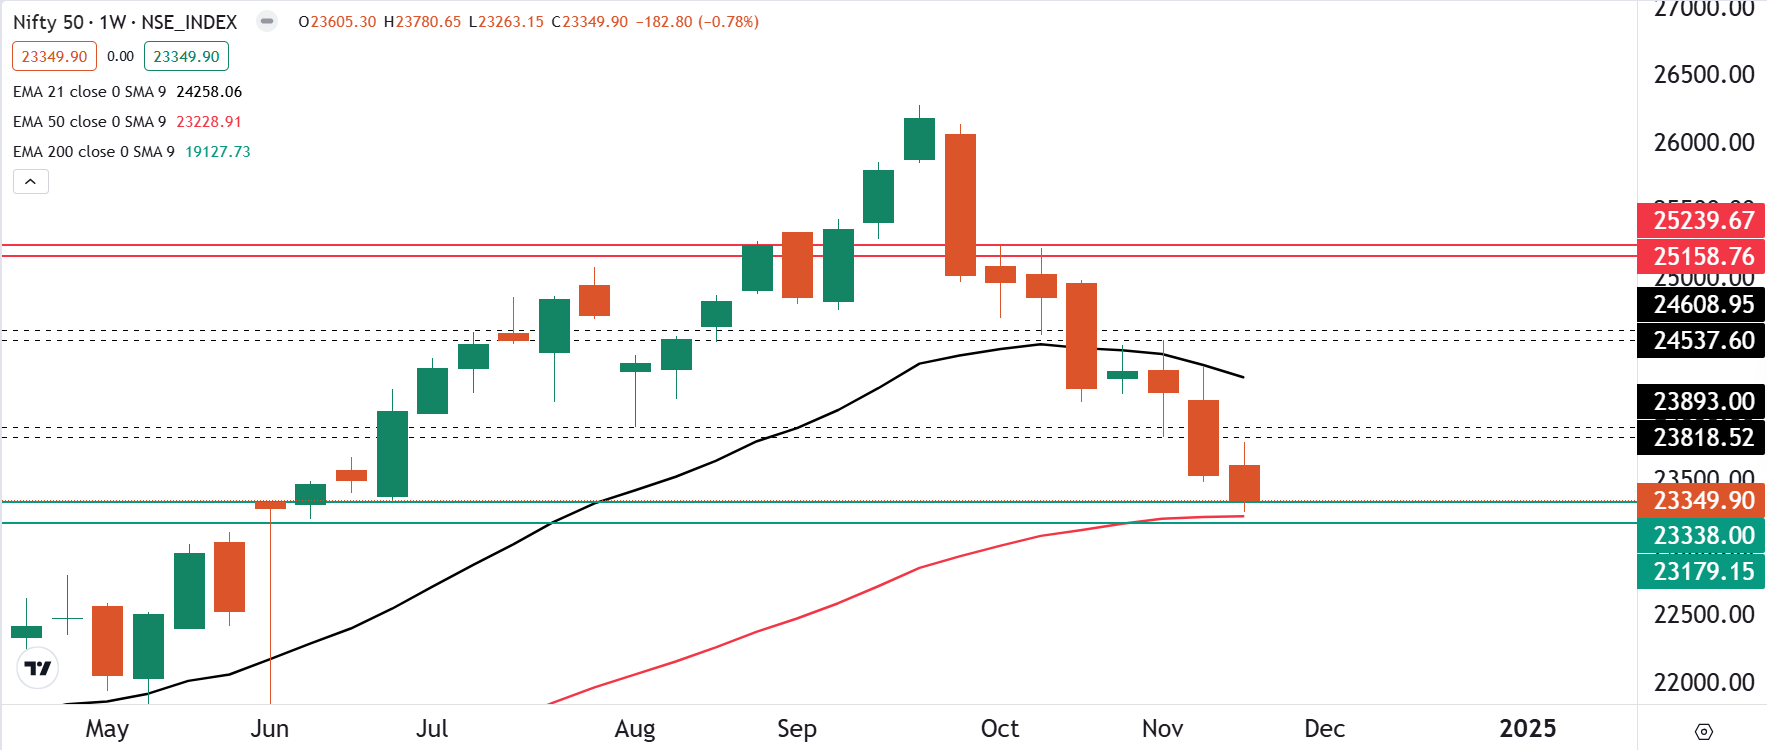
The weekly structure of the index remains negative as the index is forming a bearish candle and indicating a close below previous week’s low. However, the index is also placed around the crucial support zone of 23,000 which coincides with its 50 weekly exponential moving average (EMA). Traders can monitor the weekly closes around this zone as a close above or below these levels will provide further clues

As per the daily chart, the index is trading below its 200 EMA and took support near the 23,200-23,000 zone, which is the high of the general elections of 2024. While the broader trend of the index remains negative, the risk-reward remains unfavourable for the fresh short trades. Traders can monitor the range of 23,000 and 23,800, a break above or below these levels will provide further directional levels.

SENSEX
- Max call OI: 80,000
- Max put OI: 75,000
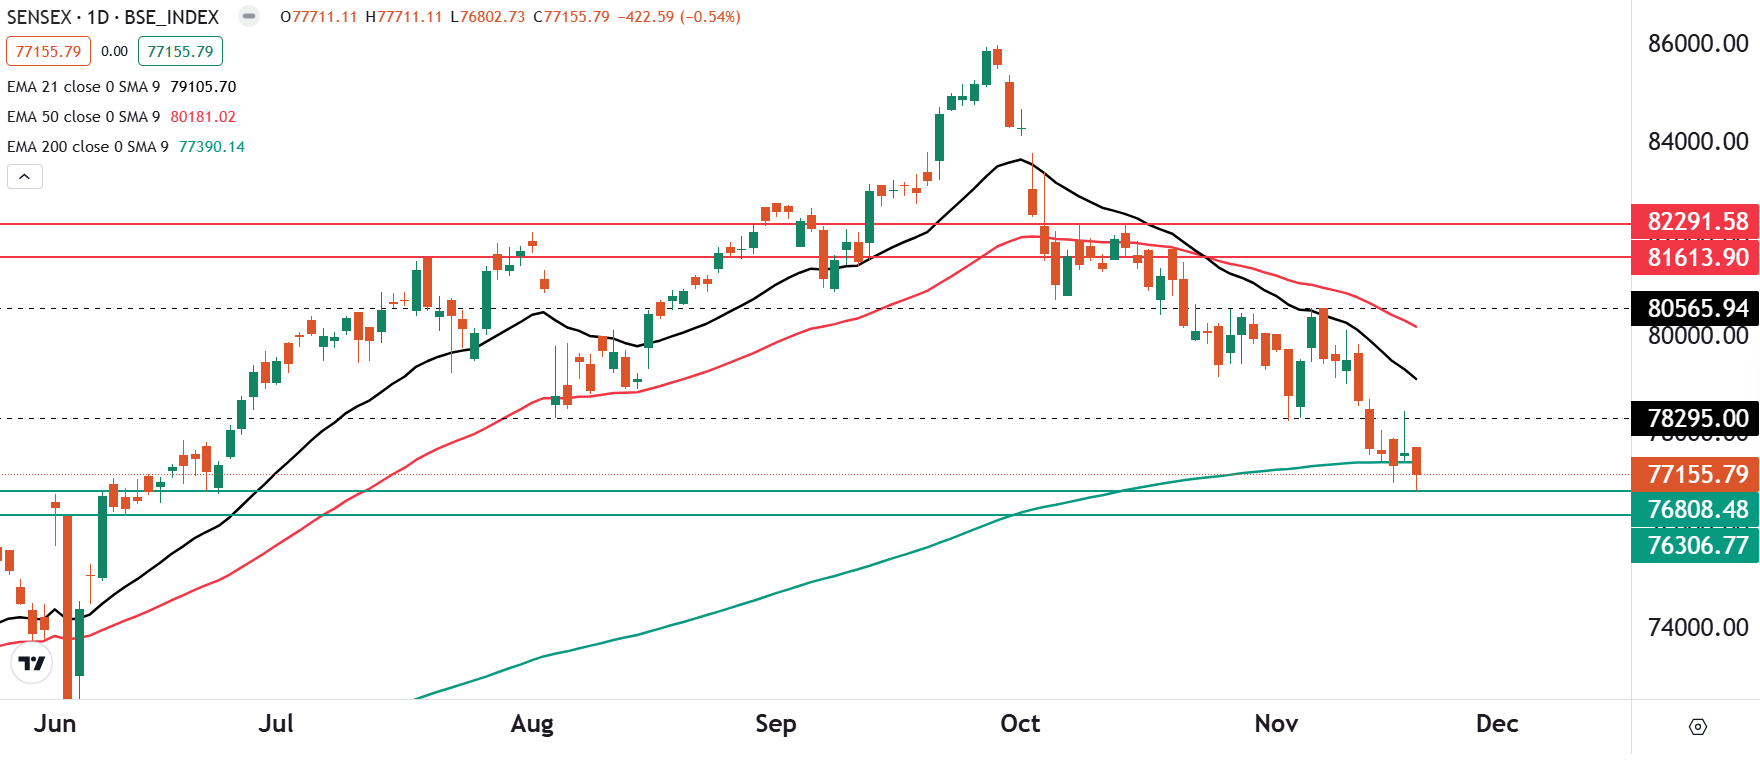
The SENSEX remained under pressure on Thursday and closed below the 200 EMA on the daily chart. However, the index saw buying interest from a critical support zone around 76,800, which is in line with the peak recorded during the June 2024 general elections.
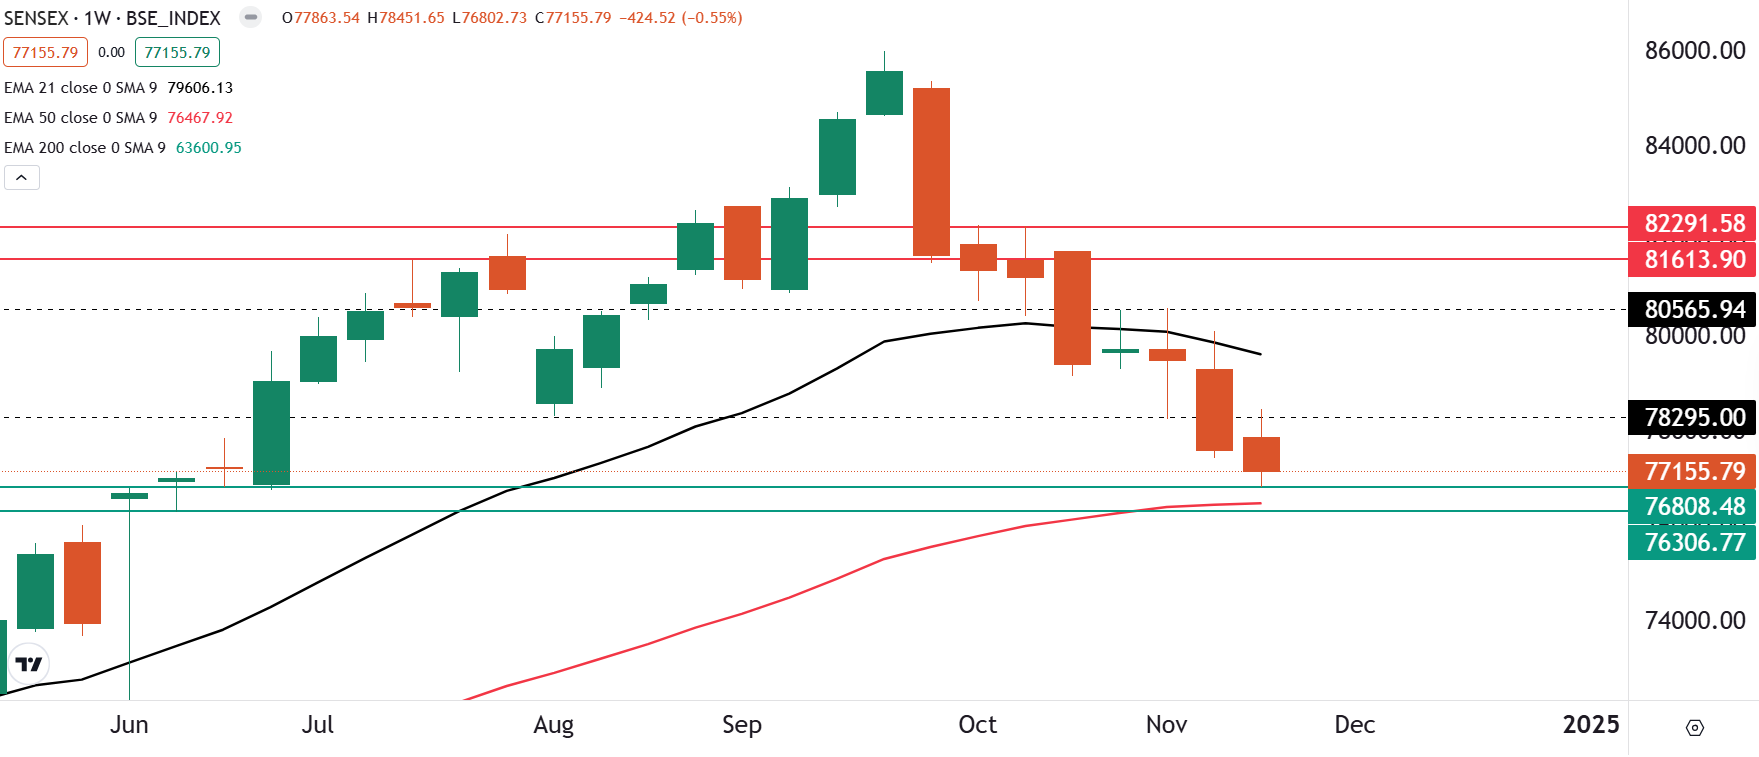
The technical structure of the index as per the weekly chart remains bearish as it is trading below previous week’s low. However, traders should closely monitor the weekly close as the index is currently placed near the 50 weekly exponential moving average (EMA). A close below this level will indicate further weakness. On the contrary, if the index protects 50 weekly EMA, then the trend may remain range-bound.

The index closed below the psychologically significant 200-day EMA on the daily chart, signalling potential weakness. Traders should closely watch the price action around the key support zone of 76,800 to 76,300. A decisive close below this range could trigger additional selling pressure. Conversely, if the index manages to hold this support on a closing basis, attention will shift to the immediate resistance level at 78,200.

FII-DII activity
Stock scanner
Long build-up: National Aluminium and Federal Bank
Short build-up: Adani Ports, GMR Infra, Power Finance Corporation, Navin Fluorine and IDFC First Bank
Under F&O ban: Aarti Industries, Aditya Birla Fashion and Retail, Adani Enterprises, Gujarat Narmada Valley Fertilisers & Chemicals (GNFC), Granules India, Hindustan Copper, Indraprastha Gas and National Aluminium
Added under F&O ban: Adani Enterprises and National Aluminium
In Futures and Options or F&O, long build-up means an increase in Open Interest (OI) along with an increase in price, and short build-up means an increase in Open Interest(OI) along with a decrease in price.
Source: Upstox and NSE
About The Author
Next Story


