Market News
Trade setup for Muhurat trading session: Can NIFTY50 defend the gains above 25,000 on special Diwali session on Sunday?

3 min read | Updated on November 08, 2026, 10:28 IST

SUMMARY
The long-term weekly charts show strong support at the weekly 200 EMA level of 22,400, which now remains a major threshold on the downside. The index also witnessed a positive crossover on the daily charts, as the 20 EMA crossed the 50 EMA from below. The positive crossover was last observed in July 2026, which was short-lived as the index again fell below the key averages in August.

NIFTY50 gained 8% in the week gone by, surging over 1800 points.
Indian equity markets delivered an early bonanza for investors by rallying over 8% in the week ahead of Diwali. For the special Muhurat trading session on Sunday, the trade setup remains positive and bullish. The global cues also remain positive for Sunday, with muted crude oil prices and buoyant global markets closing on Friday.
Crude oil prices suffered biggest drop in recent months after the Democrats win in the mid-term elections, abated some fears of massive escalation in the Iran war. Brent crude oil fell over 13% last week, closing near $97 per barrel, below the key $100 threshold.
The US stock markets witnessed one of the steepest falls in more than a year for the NASDAQ 100 and S&P 500 in the week induced by volatility around mid-term elections. The NASDAQ 100 fell 4.9%, and the S&P 500 fell more than 2% for the week, while the Dow Jones fell 0.9%.
In Asia, the tech-dominated markets like Japan, Korea, and Taiwan suffered losses of up to 12% in the week gone by. Meanwhile, Hong Kong and Chinese markets surged 5% and 2% respectively for the same period, along with the Indian markets.
GIFT NIFTY futures indicate a flat opening for Indian markets on the special Muhurat trading session.
NIFTY50 chart summary
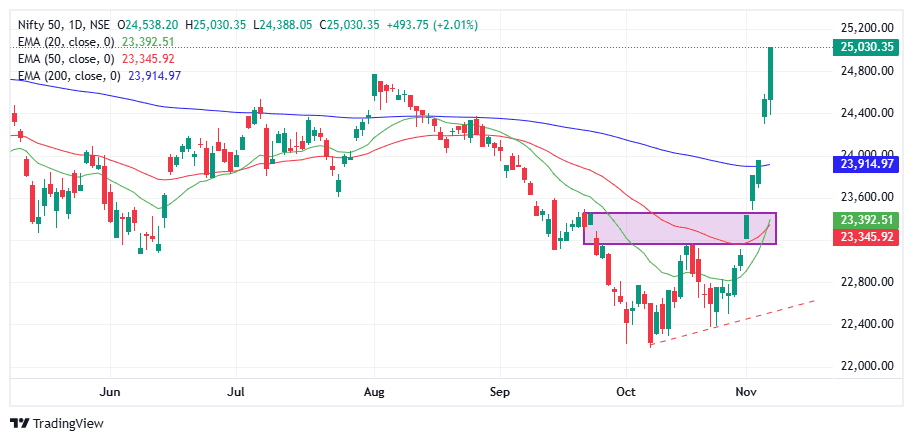
NIFTY50 index surged 8% in the previous week, maintaining the winning streak for the seventh consecutive session. The relentless rally broke the important threshold levels and defended important moving averages. The index closed above the 200 EMA level for two consecutive sessions, depicting strength in the current market rally.
Besides this, the index also witnessed a positive crossover on the daily charts, as the 20 EMA crossed the 50 EMA from below. The positive crossover was last observed in July 2026, which was short-lived as the index again fell below the key averages in August.
The long-term weekly charts show strong support at the weekly 200 EMA level of 22,400, which now remains a major threshold on the downside.
NIFTY50 open interest data summary
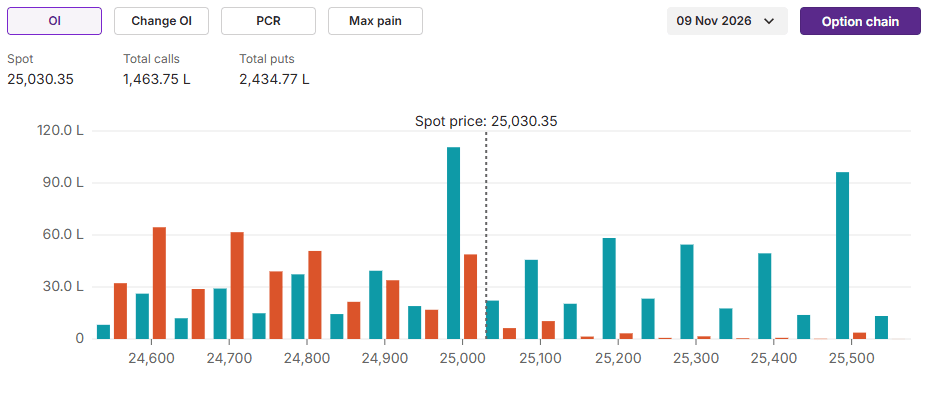
The 25,000 calls continued to hold the highest open interest for tomorrow’s weekly expiry, indicating a stiff resistance on the upside. On the downside, 24,500 puts hold the highest open interest, indicating a near-term support level for the NIFTY50, based on the open interest data.
FII and DII data summary
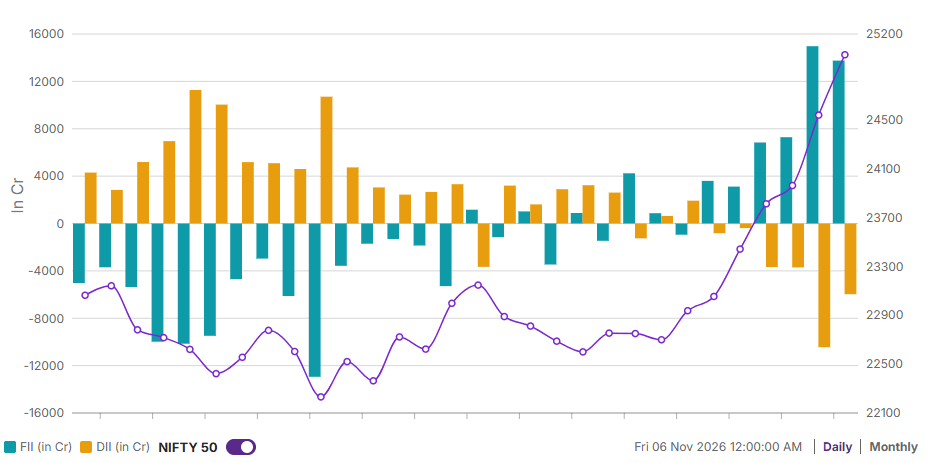
Foreign Institutional Investors (FII) have shown a remarkable bounce back in the Indian equity markets in the last few trading sessions. The provisional data provided by the NSE indicates six consecutive days of net buying by the FIIs in the Indian equity indices, accelerating the index rally of over 8% in the NIFTY50. On the flip side, the Domestic Institutional Investors (DIIs) have sold equities worth ~24,000 crore in the same period.
About The Author
Next Story