Market News
Trade setup for March 4: NIFTY50 consolidates at 22,000, a break below support could spark weakness
.png)
4 min read | Updated on March 04, 2025, 07:17 IST


SUMMARY
The NIFTY50 index formed a Doji candlestick pattern near the critical 22,000 support zone, signaling trader indecision. In the next session, traders should watch the Doji’s high and low— a decisive close above or below these levels could offer clearer directional cues.
Stock list
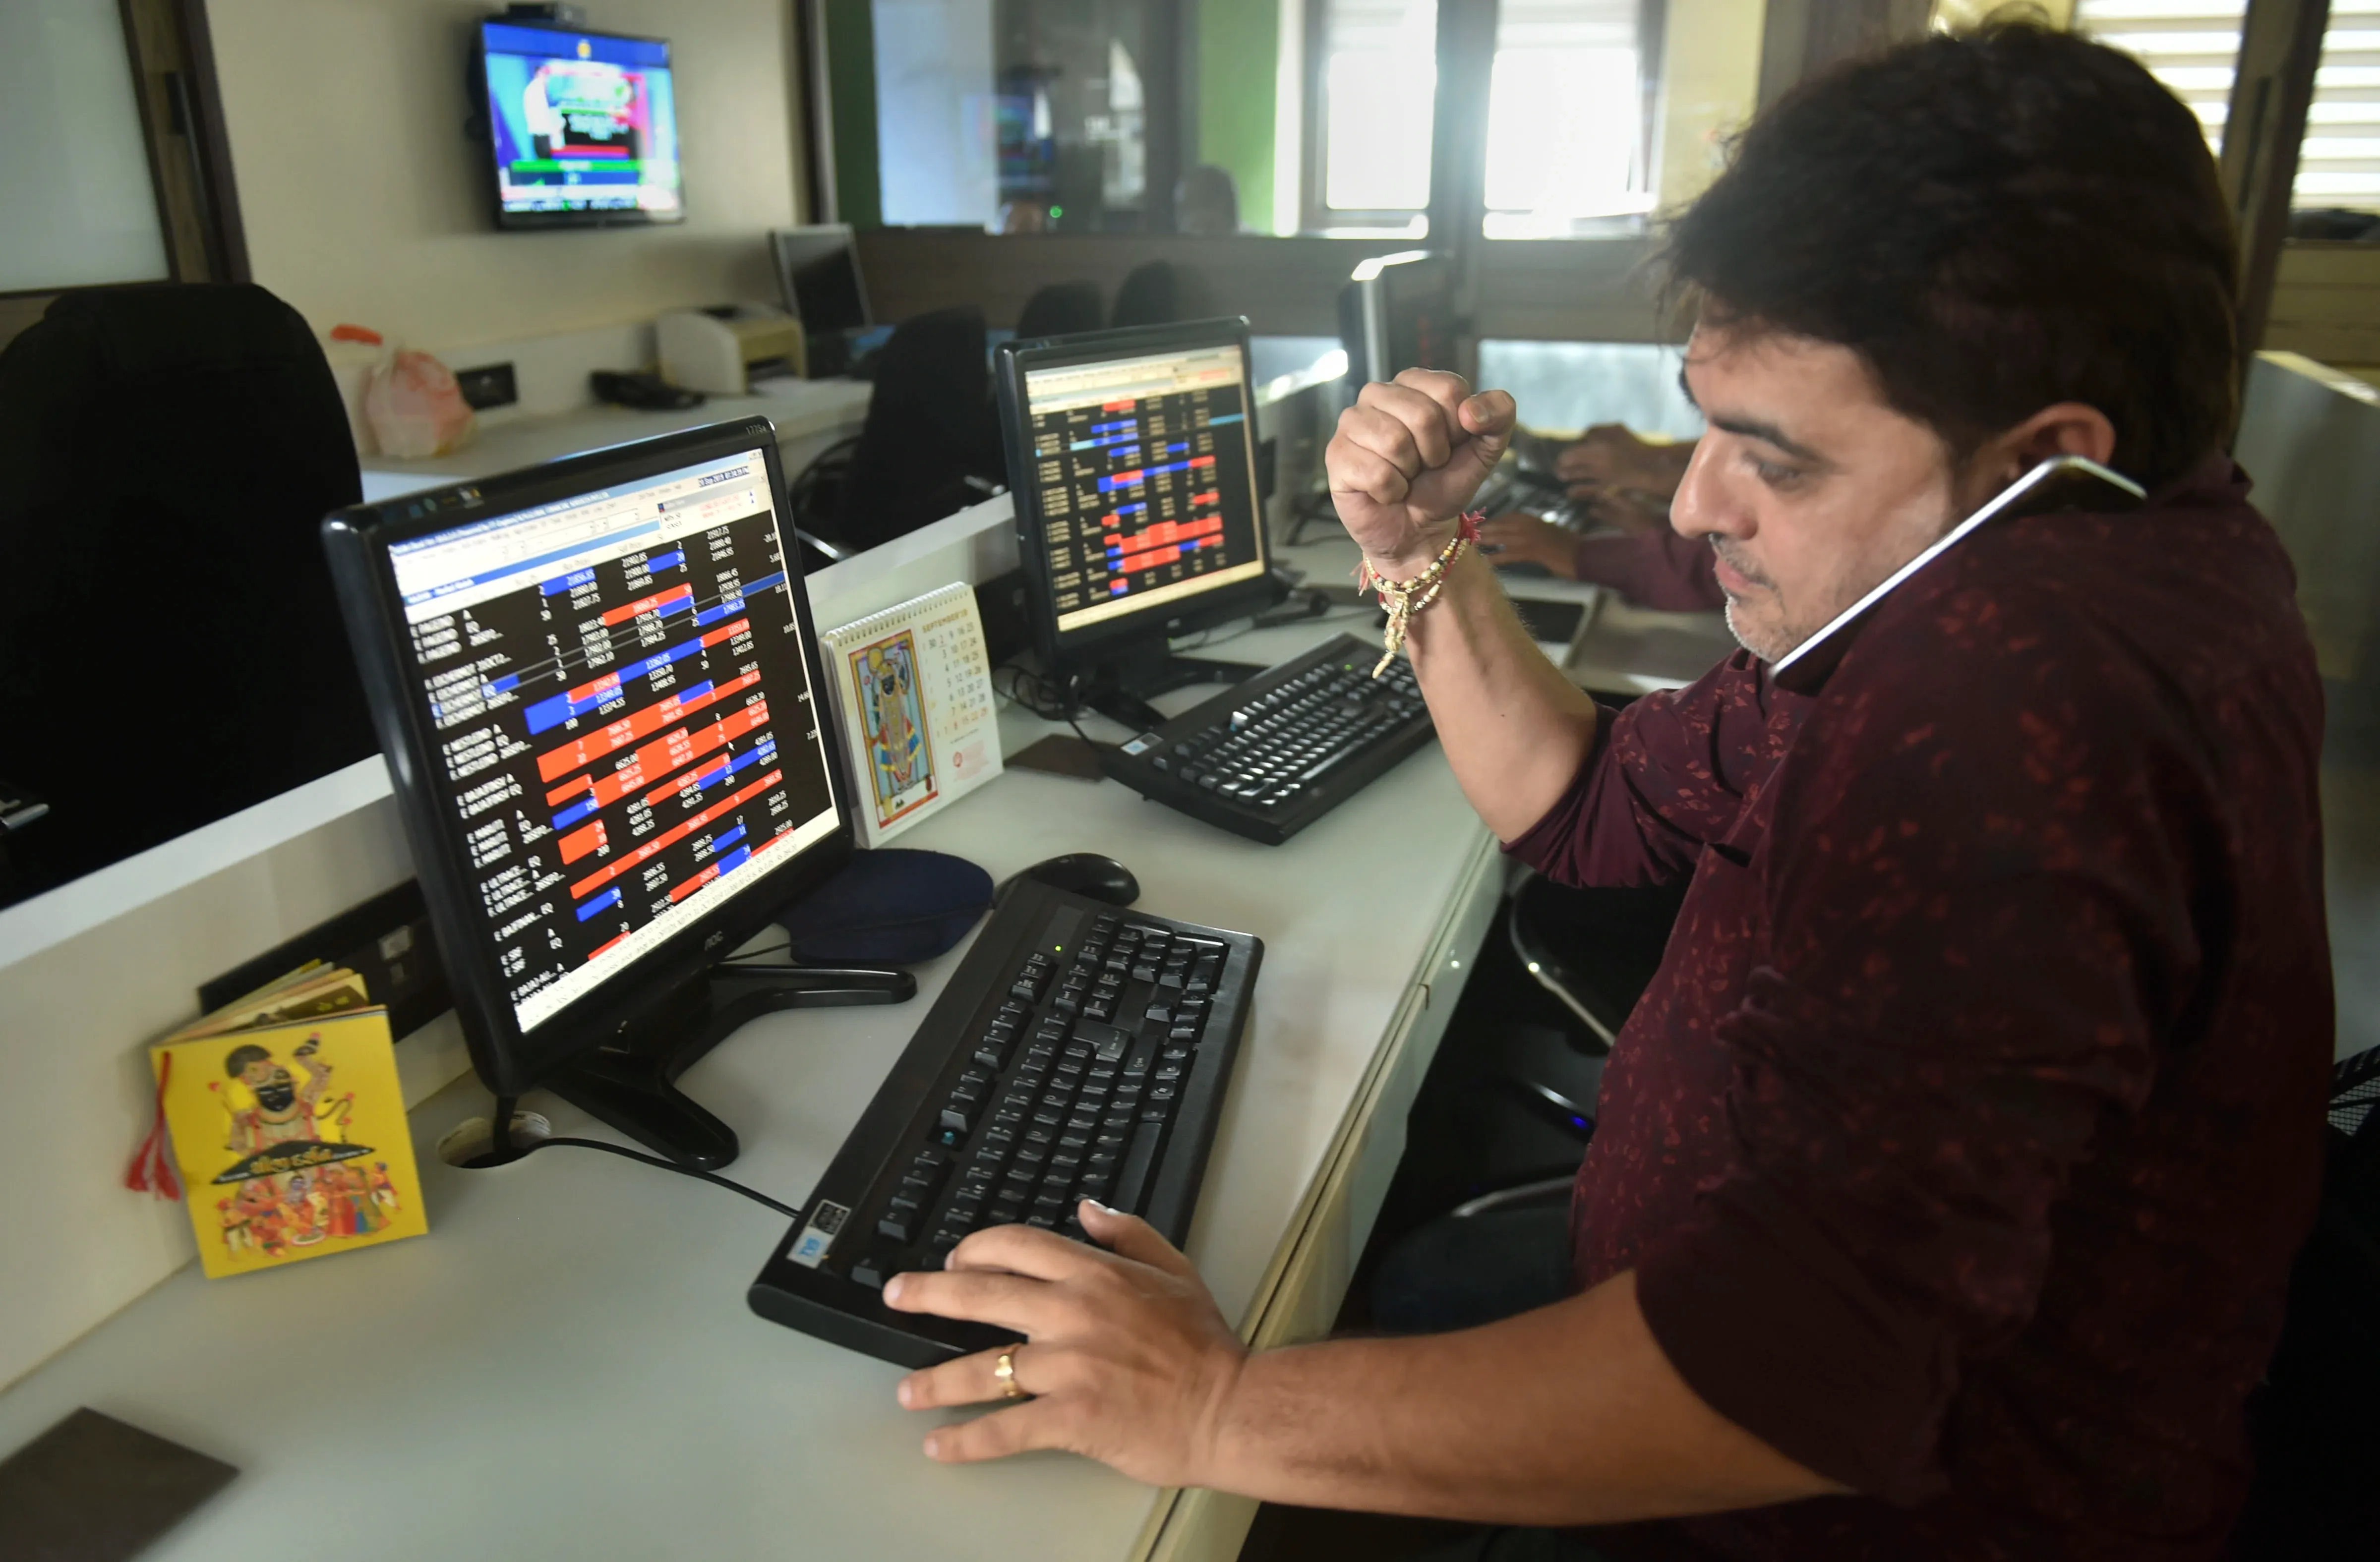
The NIFTY50 index surrendered all its opening gains and closed the Monday’s session on a flat note. | Image: PTI
Asian markets @ 7 am
- GIFT NIFTY: 22,100 (-0.73%)
- Nikkei 225: 36,925.51 (-2.28%)
- Hang Seng: 22,678 (-1.43%)
U.S. market update
- Dow Jones: 43,191 (▼1.4%)
- S&P 500:5,849 (▼1.7%)
- Nasdaq Composite: 18,350 (▼2.6%)
U.S. indices started the week on a negative note, after U.S. President Donald Trump said that the 25% tariffs on Canada and Mexico would take effect from 4 March. He indicated that there was no room for negotiation. Meanwhile, the sharp sell-off in technology stocks also weighed on sentiment, with Nvidia shares down over 8%.
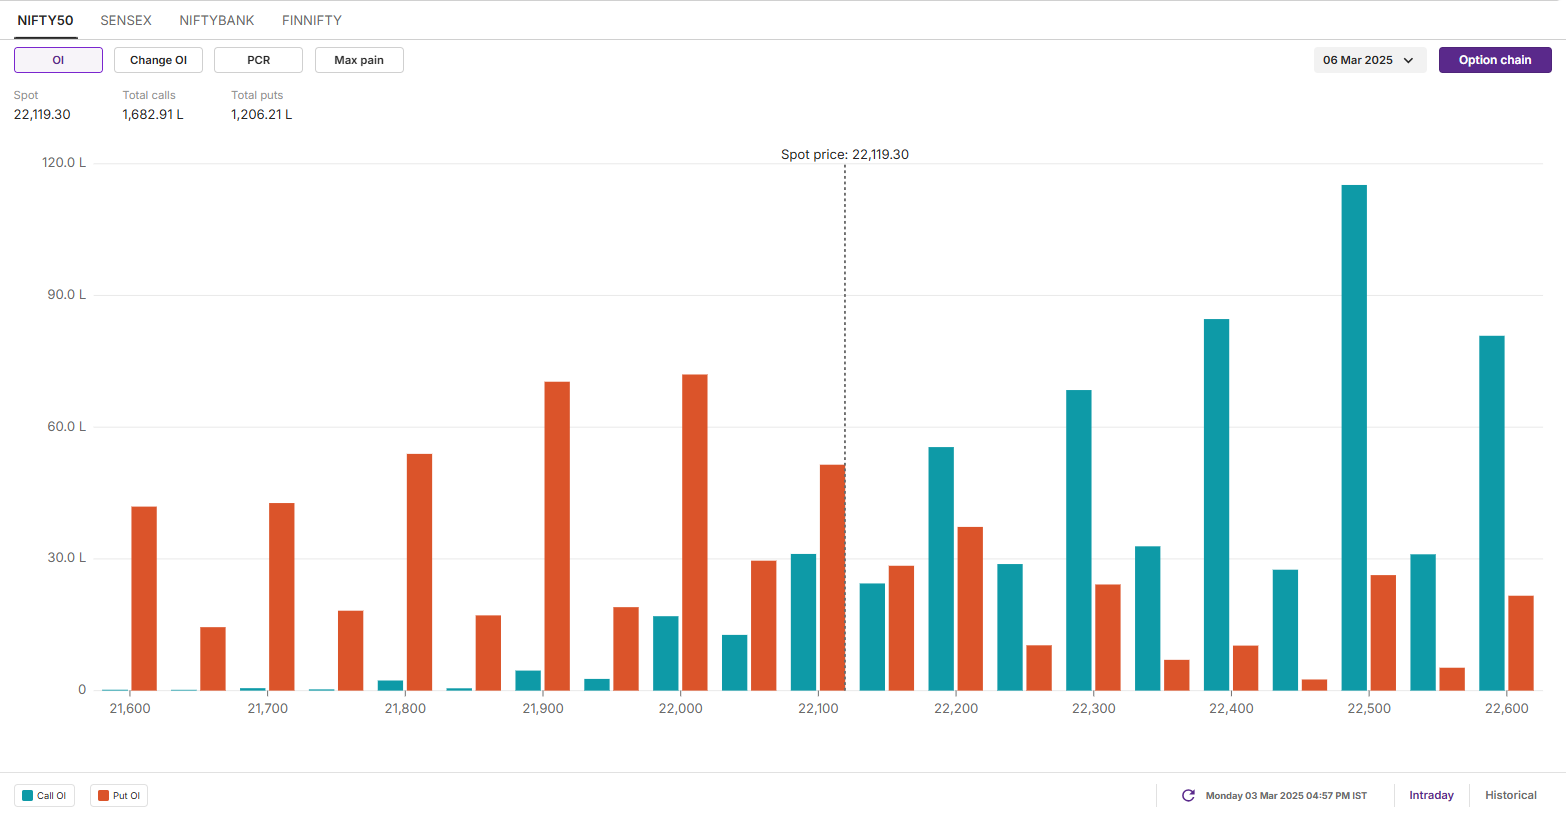
NIFTY50
- Max call OI: 22,500
- Max put OI: 21,900
- (10 Strikes from ATM, Expiry: 6 March)
The NIFTY50 index surrendered all its opening gains and closed the Monday’s session on a flat note. Despite the positive start, the index slipped over 1% from the day’s high facing resistance around the 22,500 zone.
On the daily chart, the NIFTY50 index has formed a doji candlestick pattern around the crucial support zone of 22,000 reflecting indecision among investors. For the upcoming sessions, traders can monitor the high and the low of the doji. A breakout and close above the high and low of the indecision candle will provide further directional clues. Meanwhile, the immediate resistance for the index is around 22,500 zone.
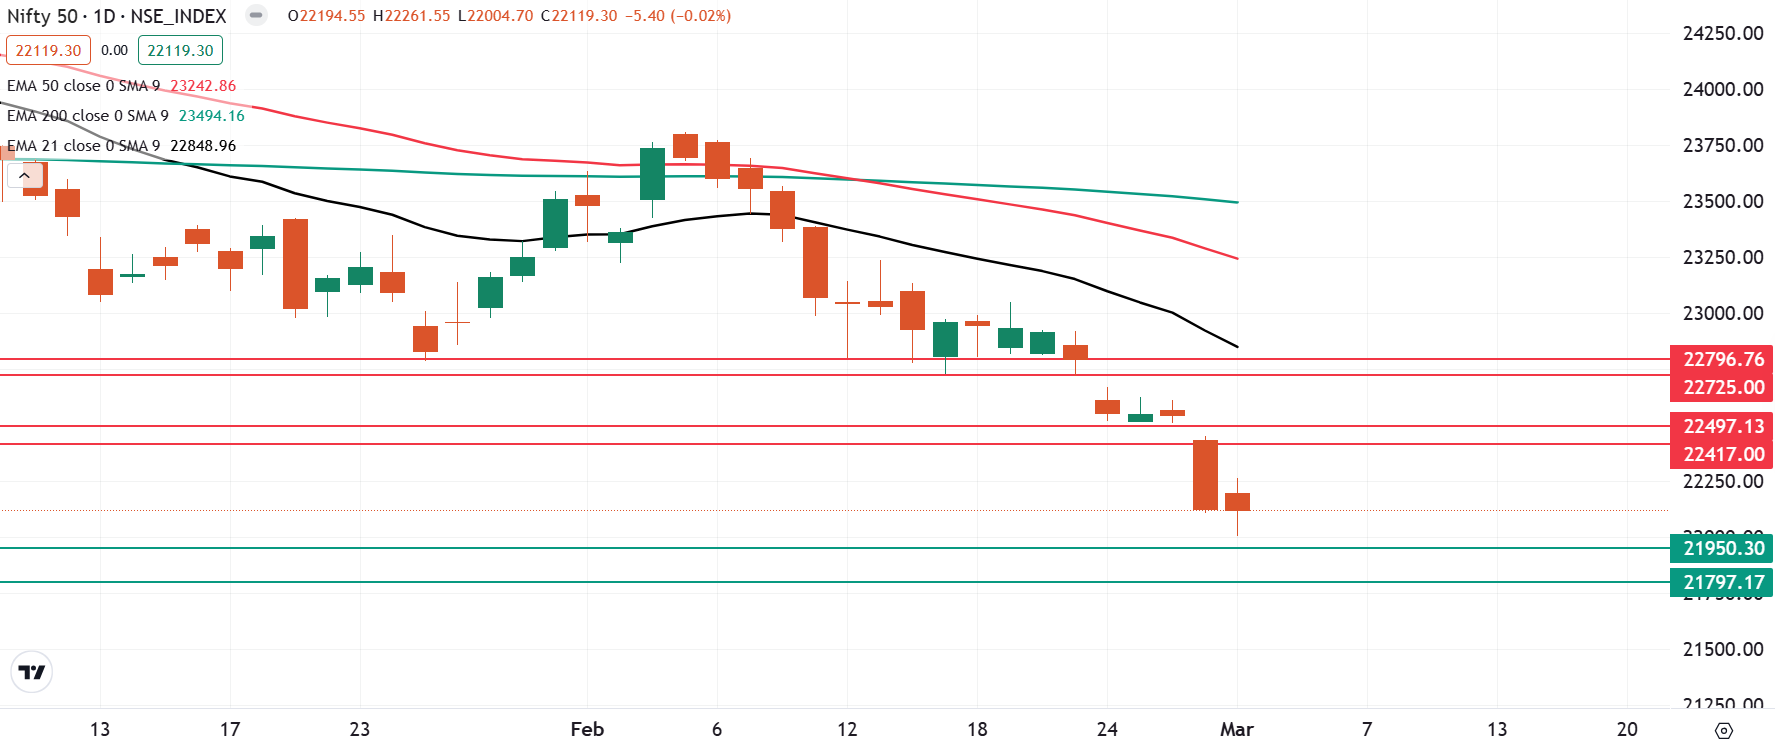
The open interest data for the 6 March expiry saw significant call build-up at 22,500 strike, indicating resistance for the index around this zone. On the flip side, the put base of the index was seen at 22,000 and 22,900 strikes, suggesting support for the index around these levels.
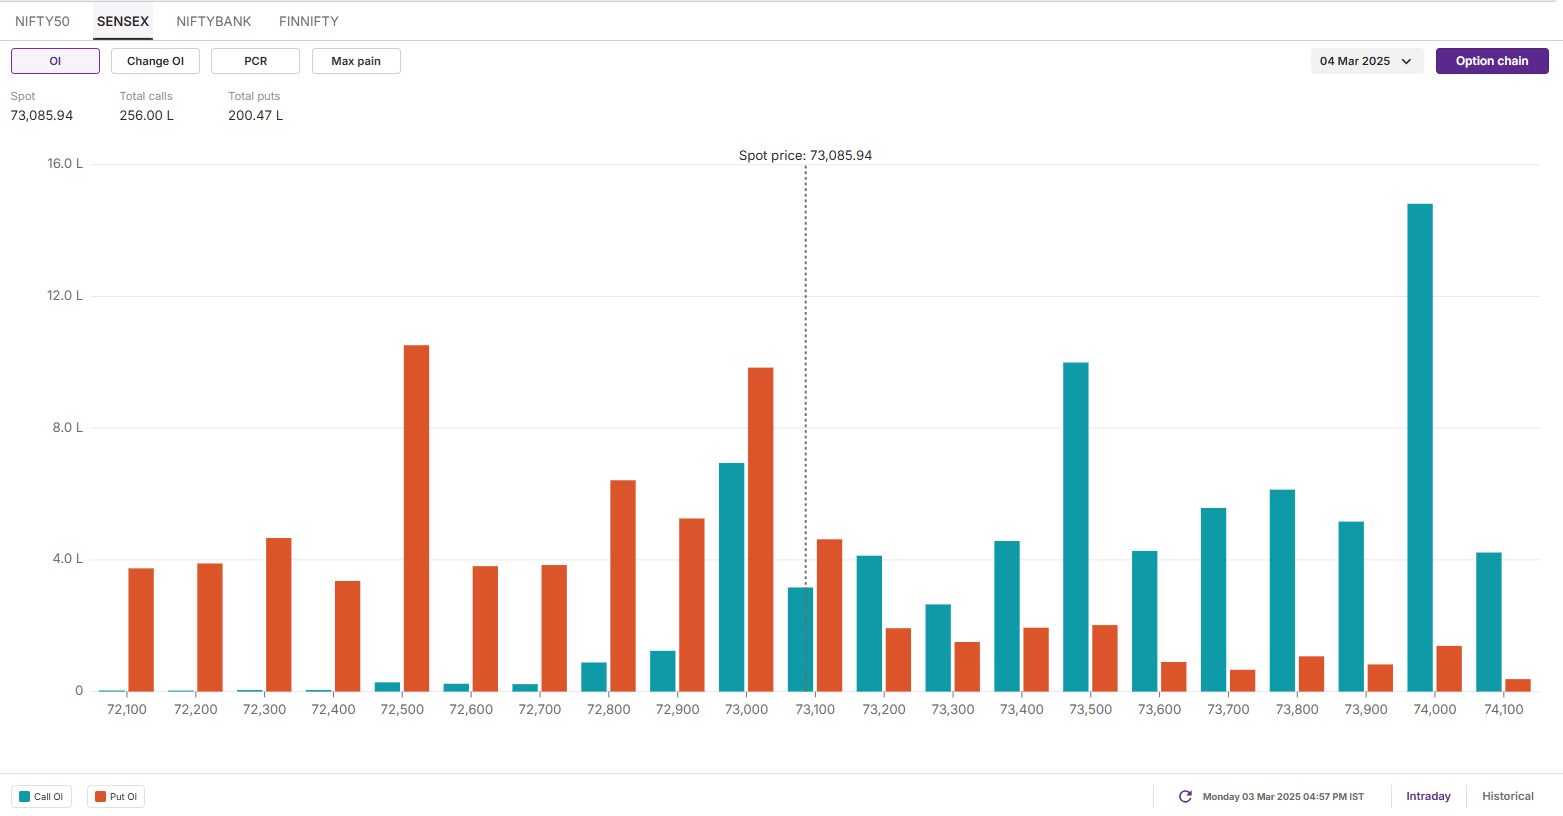
SENSEX
- Max call OI: 74,000
- Max put OI: 72,500
- (10 Strikes from ATM, Expiry: 4 March)
The SENSEX also failed to sustain its opening gains and traded in a narrow range ahead of the expiry of its weekly options contracts. The index formed a doji candlestick pattern on the daily chart, reflecting indecision among investors around the crucial support zone of 73,000.
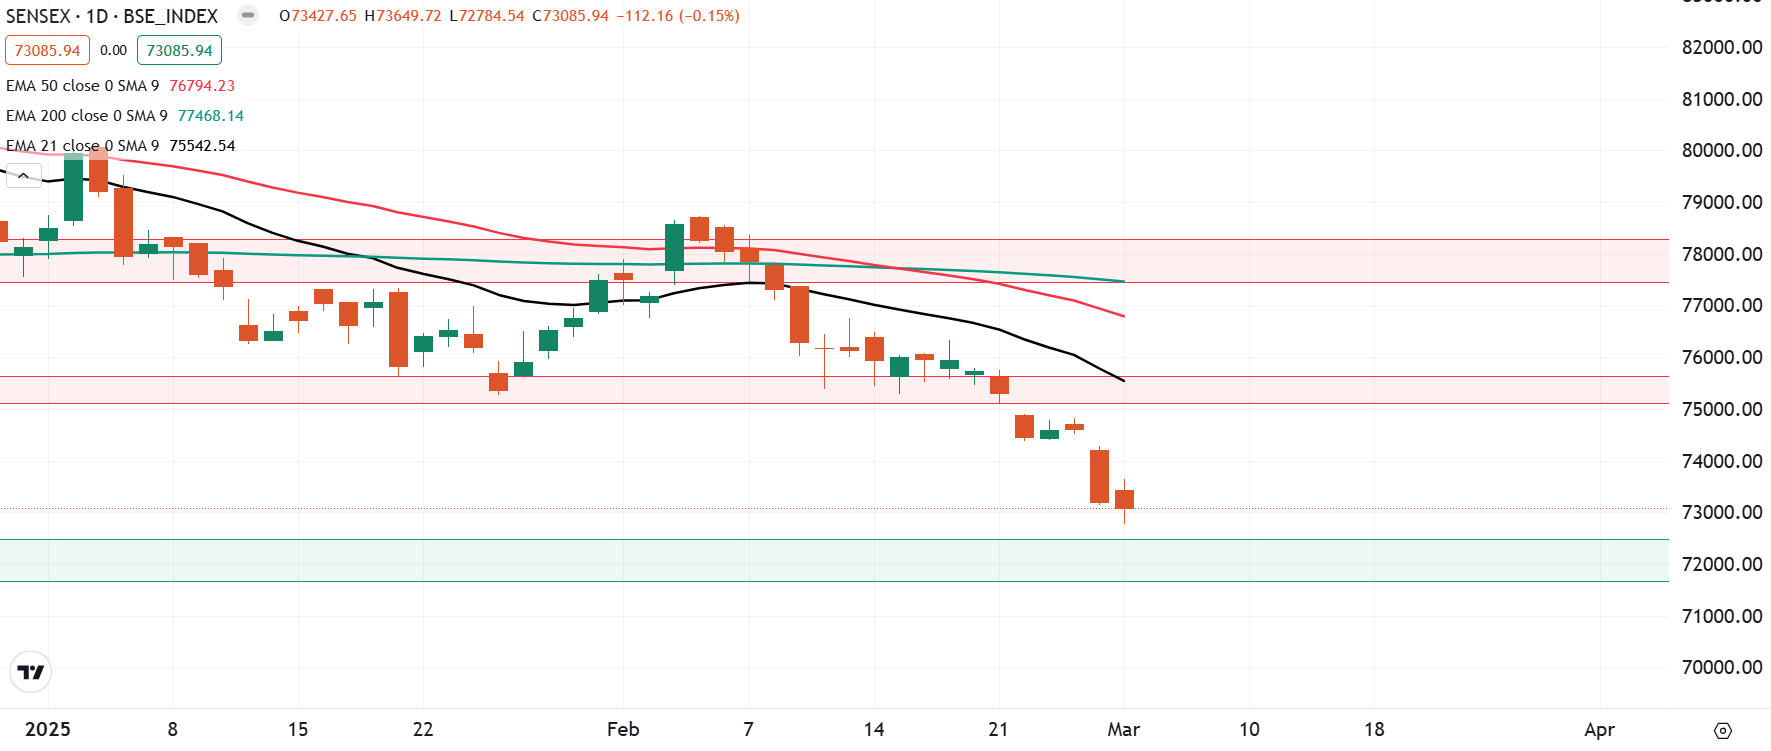
On the 15-minute chart, the SENSEX is fluctuating between 73,650 and 72,800. A decisive breakout with a strong candle and sustained movement below this range could signal the next directional move. However, as long as the index remains within this zone, it is likely to stay range-bound and lack clear direction.
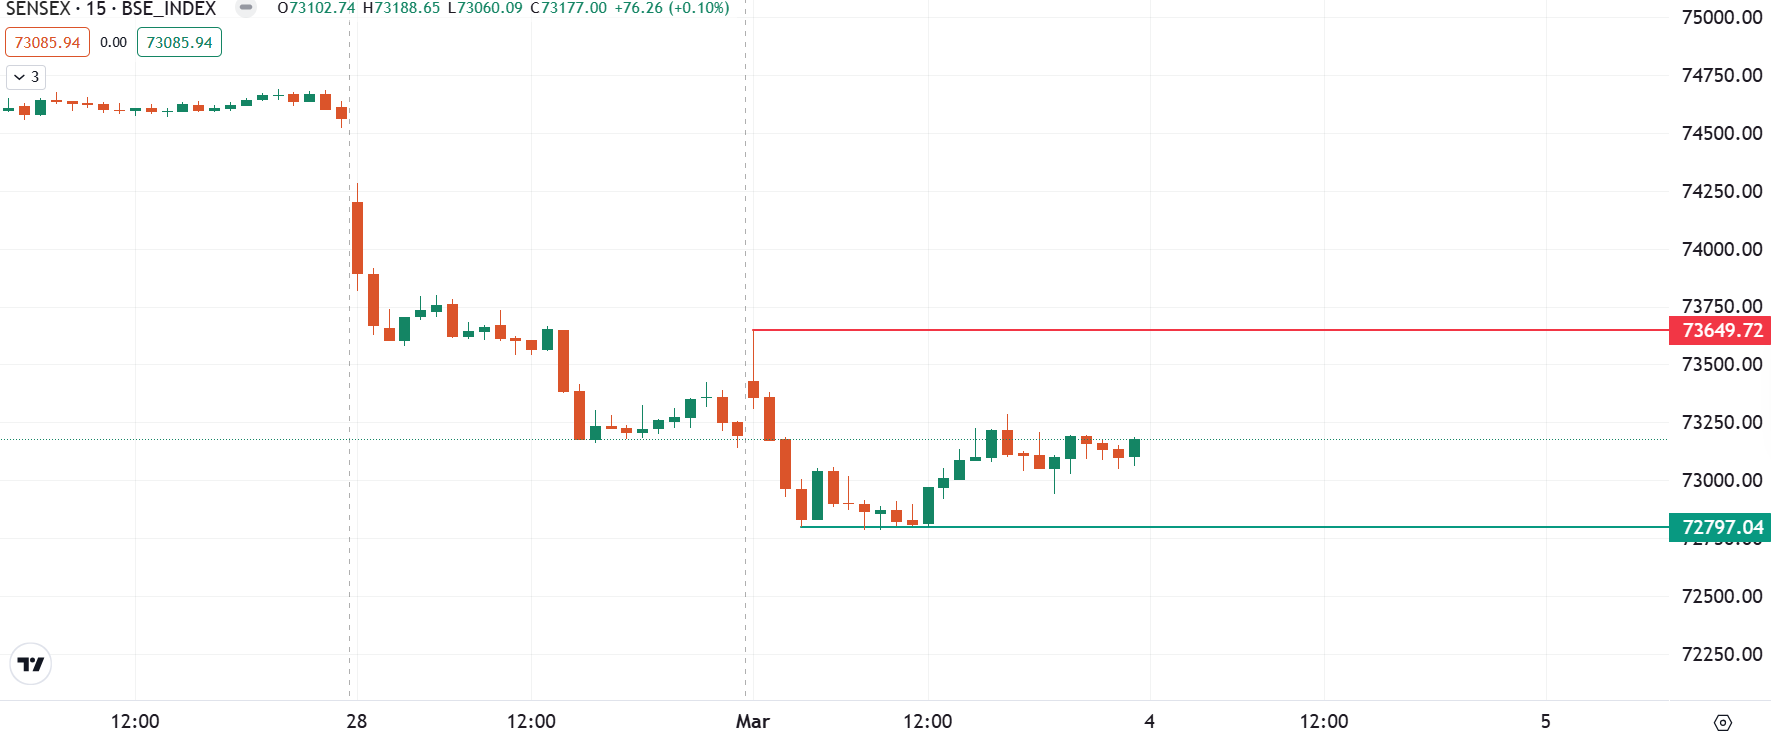
The open interest (OI) data for today’s expiry saw significant call OI build-up at 73,500 strike, indicating resistance for the index around these level. On the other hand, the put base was observed at 73,000 and 72,500 strikes, hinting at support for the index around these zones.
FII-DII activity
Stock scanner
- Long build-up: CG Power, Ultratech Cement, KEI Industries, Lupin and NTPC
- Short build-up: Jio Financials, Angel One, Multi Commodity Exchange, IIFL Finance and IREDA
- Top traded futures contracts: Reliance Industries, HDFC Bank, Polycab, BSE andICICI Bank
- Top traded options contracts: BSE 4500 PE, Polycab 4800 CE, Dixon 14000 CE and Reliance 1200 CE
- Under F&O ban: N/A
In Futures and Options or F&O, long build-up means an increase in Open Interest (OI) along with an increase in price, and short build-up means an increase in Open Interest(OI) along with a decrease in price. Source: Upstox and NSE.
Disclaimer: Derivatives trading must be done only by traders who fully understand the risks associated with them and strictly apply risk mechanisms like stop-losses. The information is only for consumption by the client and such material should not be redistributed. We do not recommend any particular stock, securities and strategies for trading. The securities quoted are exemplary and are not recommendatory. The stock names mentioned in this article are purely for showing how to do analysis. Take your own decision before investing.
About The Author
Next Story


