Market News
Trade Setup for January 7: NIFTY50 breaks below 200 EMA – Is a deeper slide towards 23,500 imminent?
.png)
4 min read | Updated on January 07, 2025, 07:19 IST
SUMMARY
The open interest data for NIFTY50's 9 January expiry revealed a substantial call base at the 24,000 and 24,100 strike prices, establishing these levels as immediate resistance zones for the index.
Stock list
In the upcoming sessions, NIFTY50 has immediate support in the 23,300–23,500 zone.
Asian markets @ 7 am
- GIFT NIFTY: 23,773.00 (+0.16%)
- Nikkei 225: 40,105.63 (+2.03%)
- Hang Seng: 19,501.45 (-0.95%)
U.S. market update
- Dow Jones: 42,706 (▼0.0%)
- S&P 500: 5,975 (▲0.5%)
- Nasdaq Composite: 19,864 (▲1.2%)
U.S. indices closed Monday's session with mixed results, as the S&P 500 and Nasdaq extended their winning streak to a second consecutive day. The standout performers were chip stocks, which surged following strong news from Nvidia's server partner, Foxconn. The company reported record-breaking revenue and issued an optimistic sales forecast, bolstering confidence in AI-driven growth. Nvidia shares soared over 3%, reaching a new all-time high by the close.
NIFTY50
- January Futures: 23,721 (▼1.5%)
- Open interest: 4,97,568 (▼1.3%)
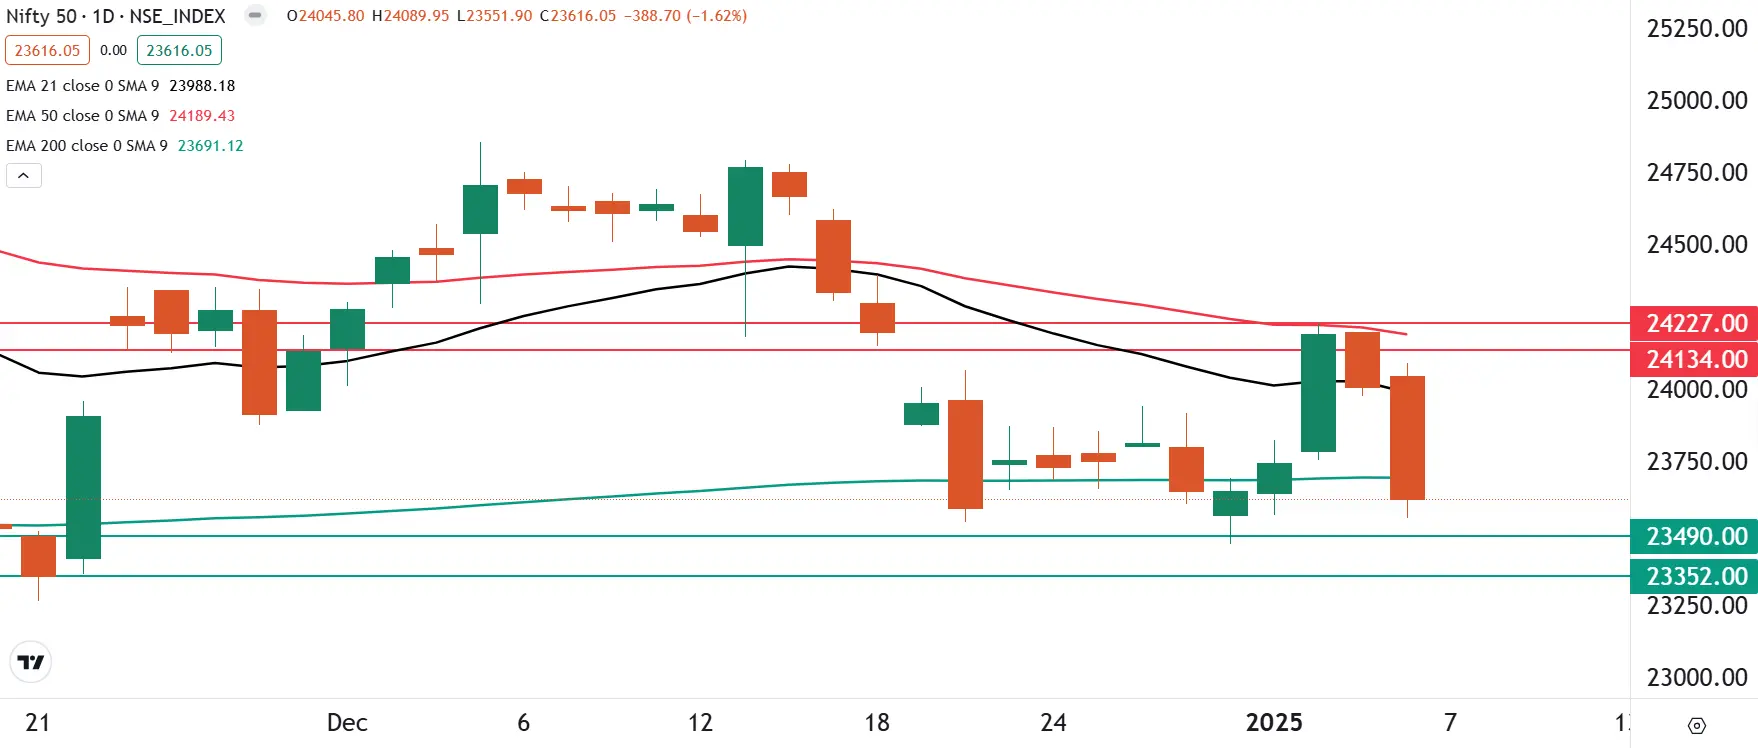
The NIFTY50 index gave up last week’s gains after encountering resistance near its 50-day exponential moving average (EMA) on Friday. It slipped below the critical support zone of the 200-day EMA, signaling bearish momentum. On the daily chart, the index formed a bearish candle, accompanied by a sharp spike in volatility, reflecting underlying weakness.
In the upcoming sessions, the index has immediate support in the 23,300–23,500 zone. A breakdown below 23,500 could lead to a retest of the critical 23,300 support level. Conversely, the immediate resistance is positioned around 23,850. A breakout above this range could offer clearer directional signals for the index.
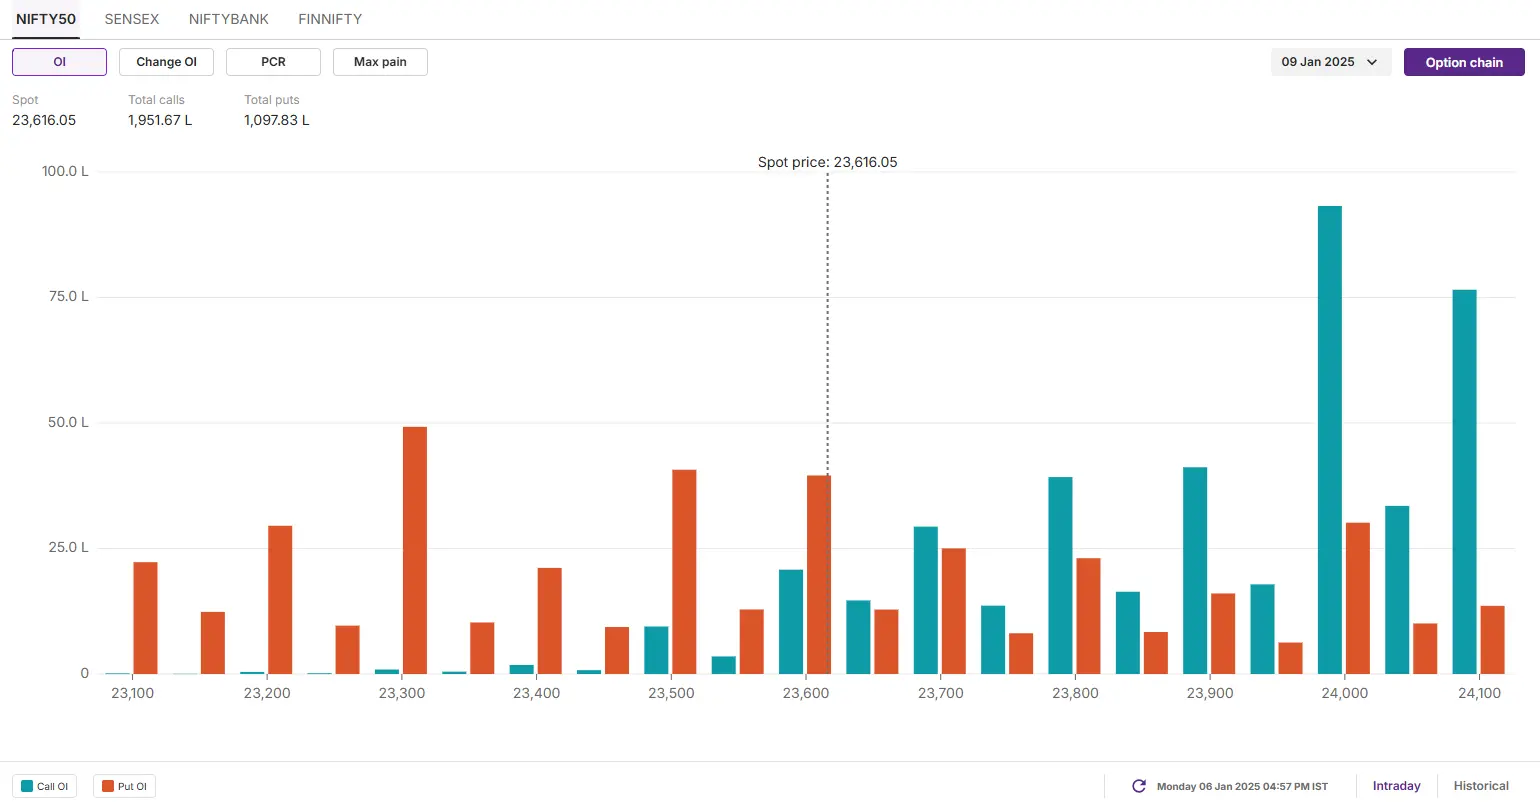
The open interest data for the 9 January expiry saw highest call build-up at 24,000 and 24,100 strikes, indicating resistance for the index around this zone. Conversely, the put base was seen at 23,300 strikes with relatively low volume, suggests immediate support around this level.
SENSEX
- Max call OI: 81,500
- Max put OI: 79,500
- (Expiry: 7 Jan)
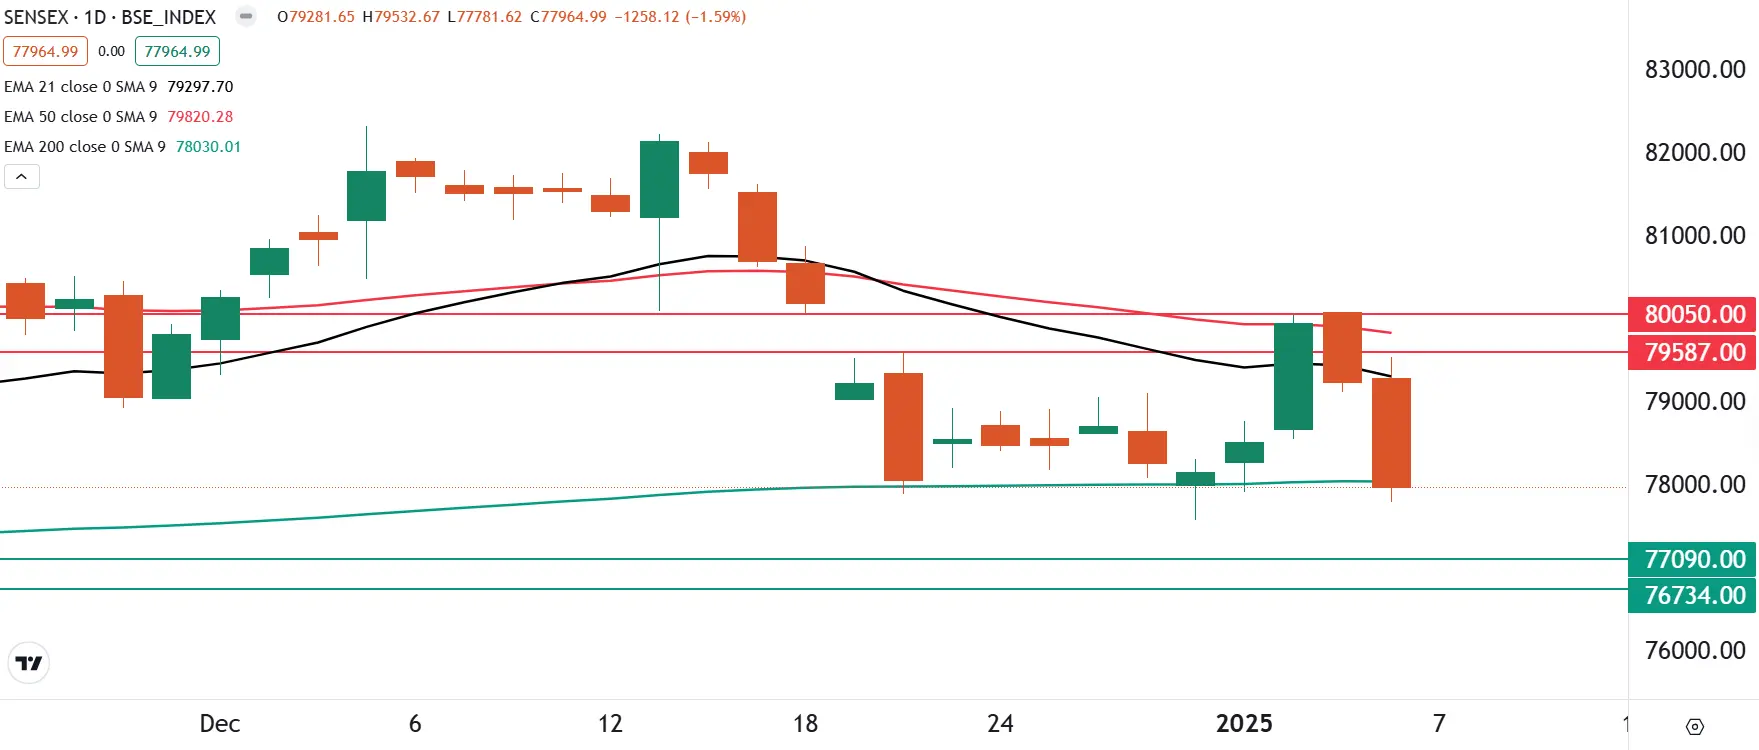
The SENSEX declined over 1% on Monday after facing rejection at the 50-day EMA, closing the session below the 200-day EMA and forming a bearish candle on the daily chart.
The technical outlook for the index remains bearish, with immediate resistance near the 80,000 zone, aligning with the 21-day and 50-day EMAs. Meanwhile, critical support is located in the 76,700–80,000 range. A breakdown below this crucial support zone could intensify the ongoing weakness.
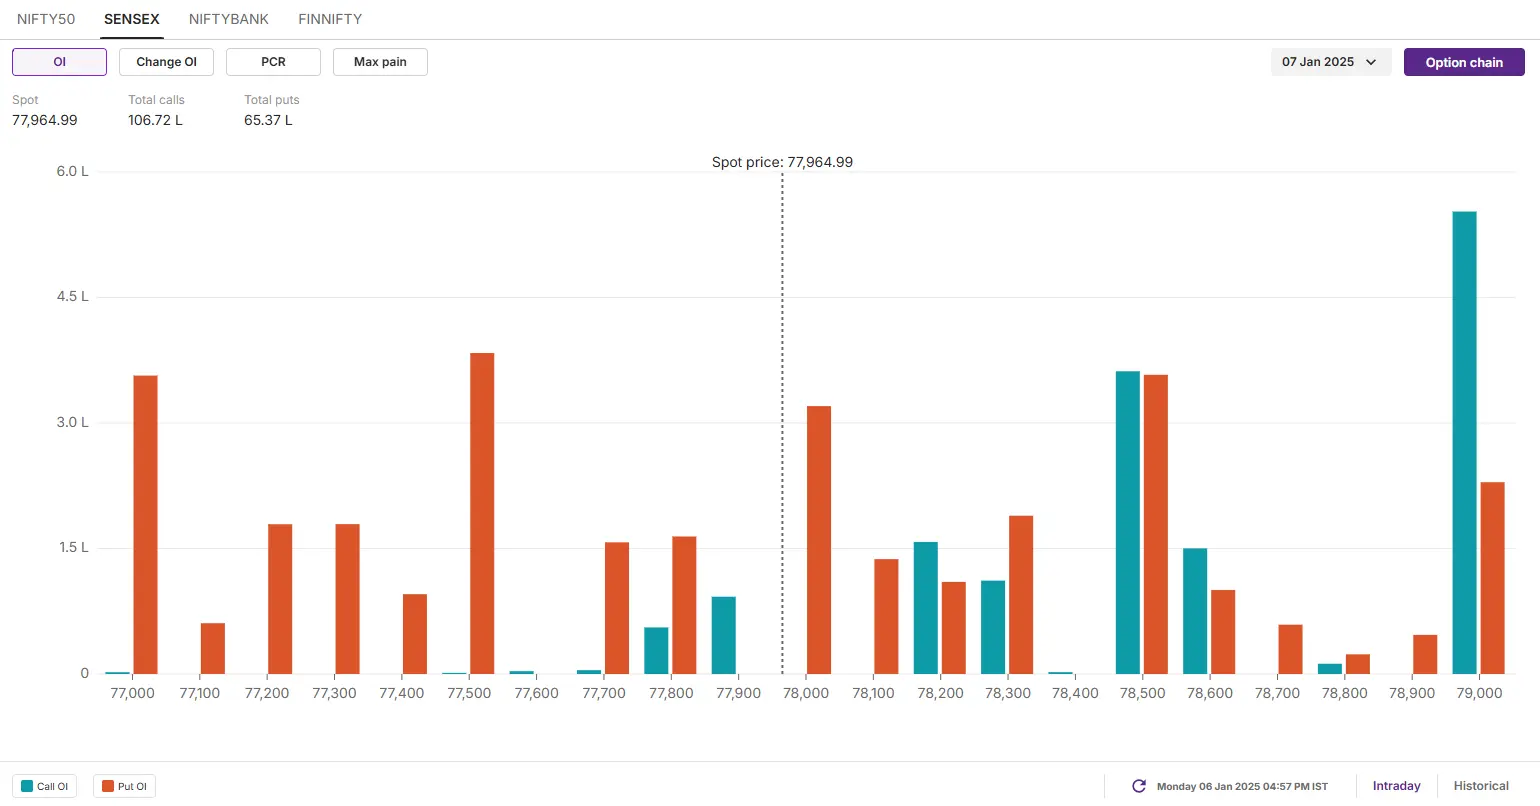
The open interest data for the 7 January expiry saw significant call base at 79,000 strike, suggesting resistance for the index around this level. On the flip side, the put base was seen at 77,500 and 77,000 strikes, indicating support for the index around these levels.
FII-DII activity
Stock scanner
- Long build-up: Dr Lal PathLabs and Metropolis
- Short build-up: Union Bank, SJVN, Hindustan Copper, Adani Green and Yes Bank
- Under F&O ban: Hindustan Copper, Manappuram Finance and RBL Bank
- Added under F&O ban: Hindustan Copper
In Futures and Options or F&O, long build-up means an increase in Open Interest (OI) along with an increase in price, and short build-up means an increase in Open Interest(OI) along with a decrease in price. Source: Upstox and NSE.
Disclaimer: Derivatives trading must be done only by traders who fully understand the risks associated with them and strictly apply risk mechanisms like stop-losses. The information is only for consumption by the client and such material should not be redistributed. We do not recommend any particular stock, securities and strategies for trading. The securities quoted are exemplary and are not recommendatory. The stock names mentioned in this article are purely for showing how to do analysis. Take your own decision before investing.
About The Author
Next Story


