Market News
Trade Setup for August 16: Will NIFTY50 reclaim the 24,400 mark? All eyes on weekly close
.png)
5 min read | Updated on August 16, 2024, 07:41 IST


SUMMARY
On the weekly chart, the NIFTY50 index formed a bullish hammer last week, signalling the emergence of buyers at lower levels. Currently, the index is shaping into an inverted hammer. Traders should keep a close eye on the weekly close. A close above the previous week's high would confirm a bullish outlook. Conversely, a negative close would invalidate the bullish hammer, suggesting potential weakness ahead.
Stock list
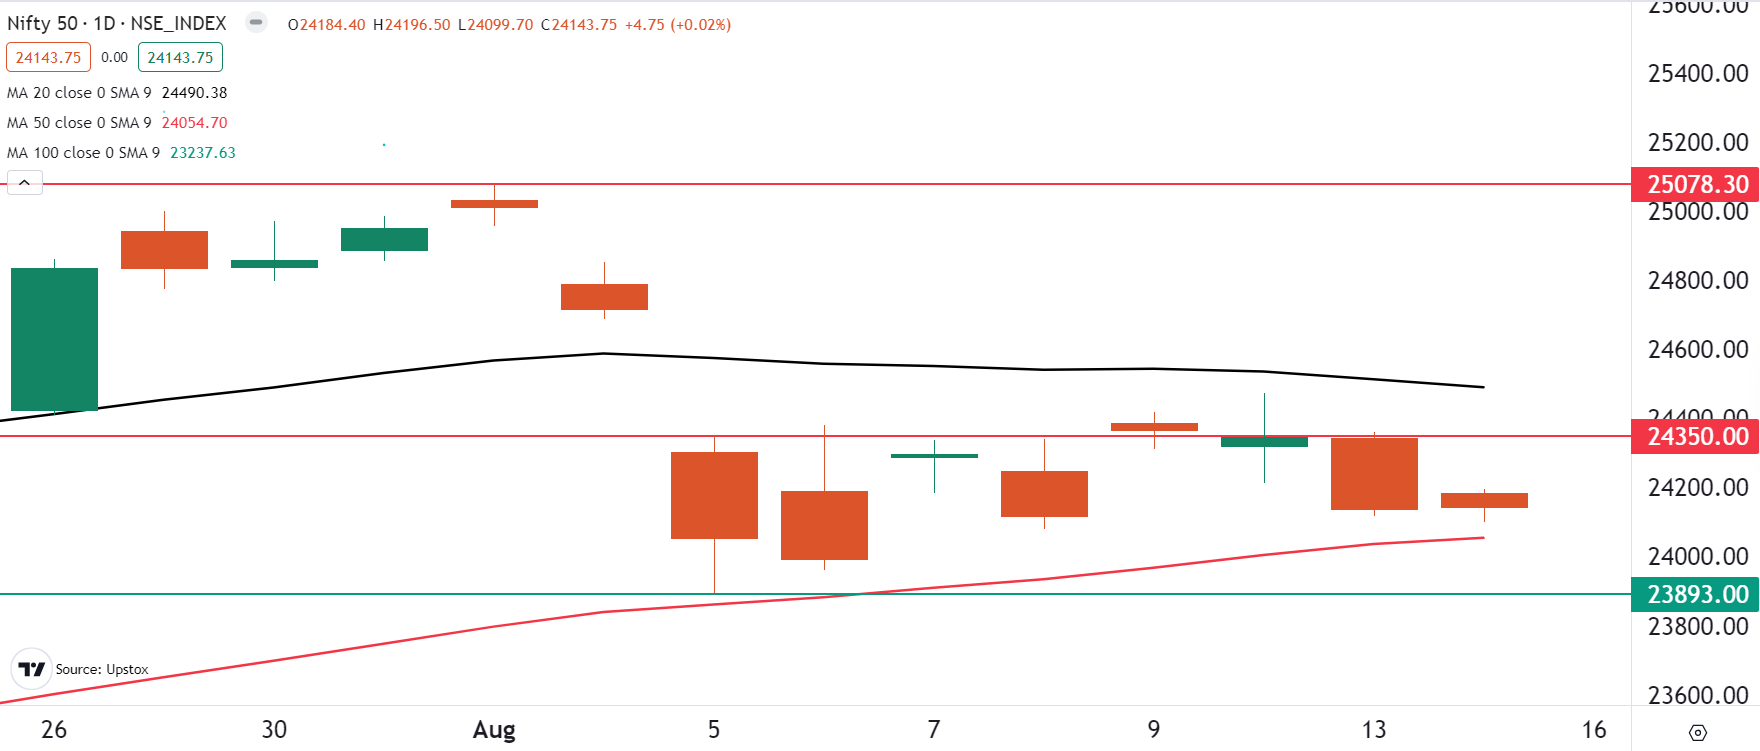
The NIFTY50 index extended its consolidation between 20 and 50 day moving averages for the eighth day in a row and is oscillating between 24,400 and 24,000 levels.
Asian markets update at 7 am
Following positive cues from Wall Street, the GIFT NIFTY is up 0.7%, pointing to a positive start for the NIFTY50 today. Other Asian markets are also trading in the green. Japan's Nikkei is up 3%, while Hong Kong's Hang Seng rose 1.4%.
U.S. market update
- Dow Jones: 40,563 (▲1.3%)
- S&P 500: 5,543 (▲1.6%)
- Nasdaq Composite: 17,594 (▲2.3%)
U.S. indices rallied on Thursday as investors regained confidence in the economy after the release of retail sales and labour market data. Retail sales increased 1% in July, surpassing the estimates of 0.3%. Additionally, the weekly jobless claims hit a five- week low, easing concerns that the labour market could be headed for a major uptick in unemployment.
Meanwhile, Walmart, the largest U.S. retailer and barometer for consumption trends added to the momentum. A stronger-than-expected first half caused management to raise its full year revenue and earnings outlook.
NIFTY50
- August Futures: 24,174 (▲0.0%)
- Open Interest: 4,61,260 (▼3.8%)
The NIFTY50 index traded in a narrow range and closed the day flat on the expiry of its weekly options contracts. The index osciallated in a range of around 90 points and protected 24,000 mark on closing basis, led by gains in IT stocks.
The index extended its consolidation between 20 and 50 day moving averages for the eighth day in a row and is oscillating between 24,400 and 24,000 levels. In upcoming sessions, traders can monitor both the levels, as the break of these levels on intraday and closing basis will provide strong directional clues.
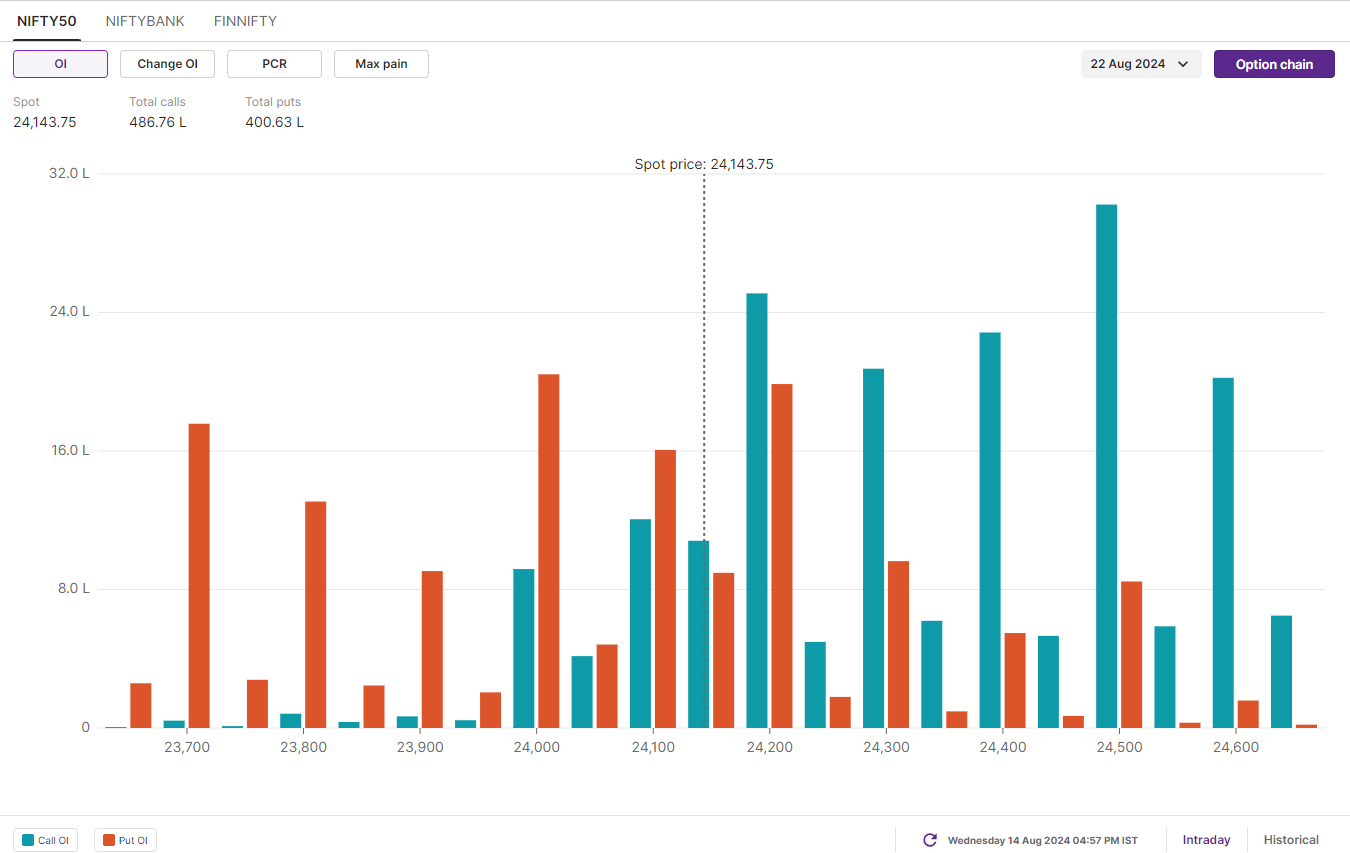
The initial open interest build-up for 22 August expiry has highest call base at 25,000 and 24,500 levels. On the contrary, the put open interest base was developed at 24,000 and 24,200 strikes. The current open interest analysis reflects strong positioning of call writers, indicating resistance around 25,000. However, traders can monitor the change in open interest today and plan strategies as per the price action of weekly close.
BANK NIFTY
- August Futures: 49,955 (▼0.1%)
- Open Interest: 2,25,683 (▲2.9%)
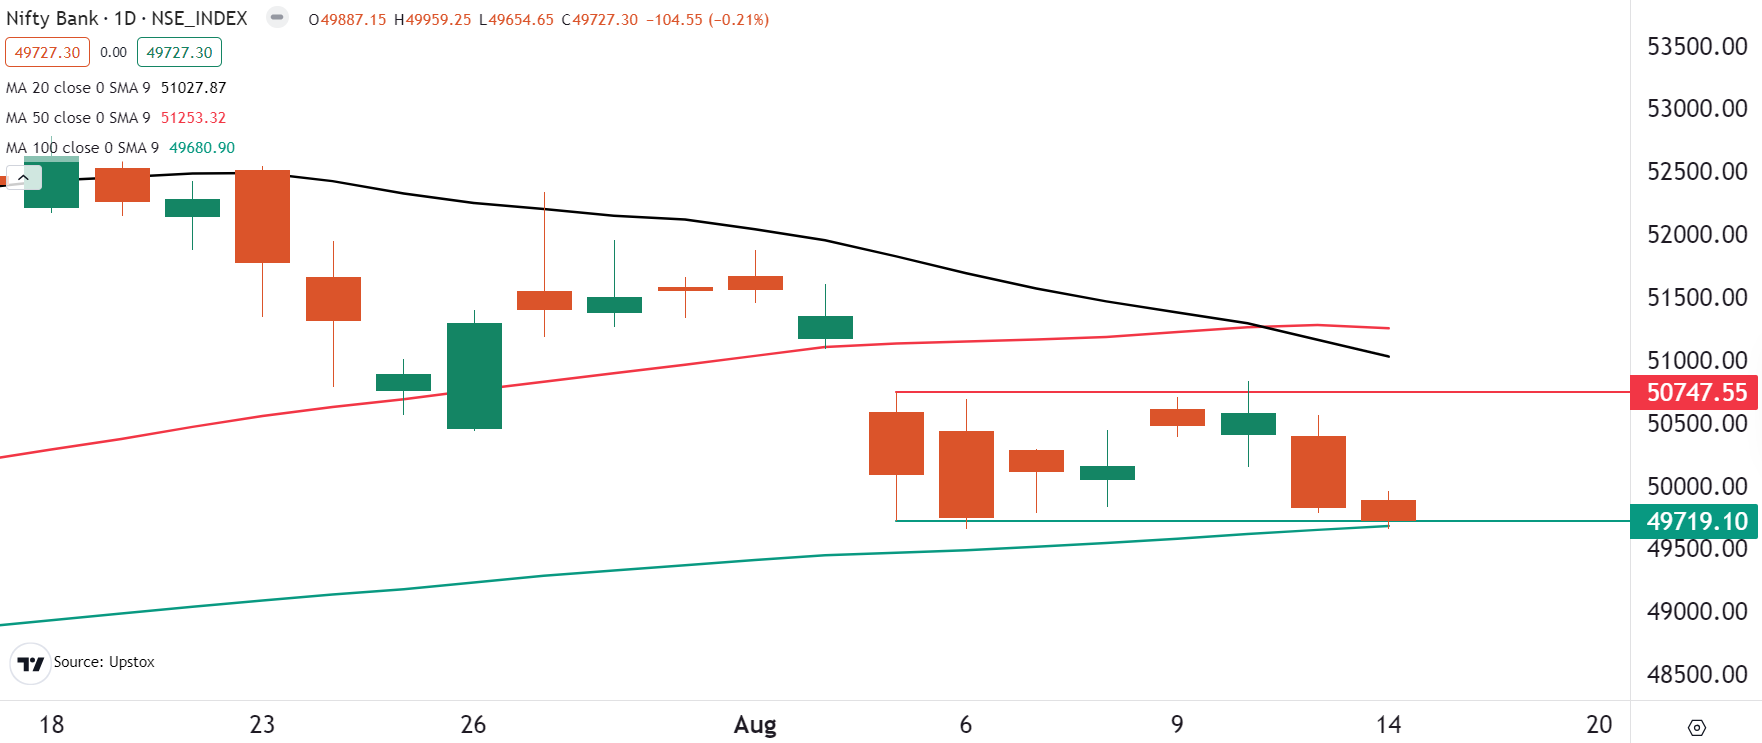
The price action of the BANK NIFTY remained confined to a narrow range, with market breadth showing weakness relative to the NIFTY50 index. The index closed in the red, finding support near its 100-day moving average around the 49,600 level.
As you can see on the daily chart, the index is currently trading between two ranges. First, it is below its 20 and 50 day moving averages and has found support at its 100 day moving average (DMA). Secondly, the index is still within the range of the 5 August candle, which was formed after a gap down opening.
In such a scenario, traders can monitor break of 5 August high and low. A break of this range will result in a strong directional move. However, after the break of the range traders should also monitor the price action around the DMAs for further confirmation of the trend.
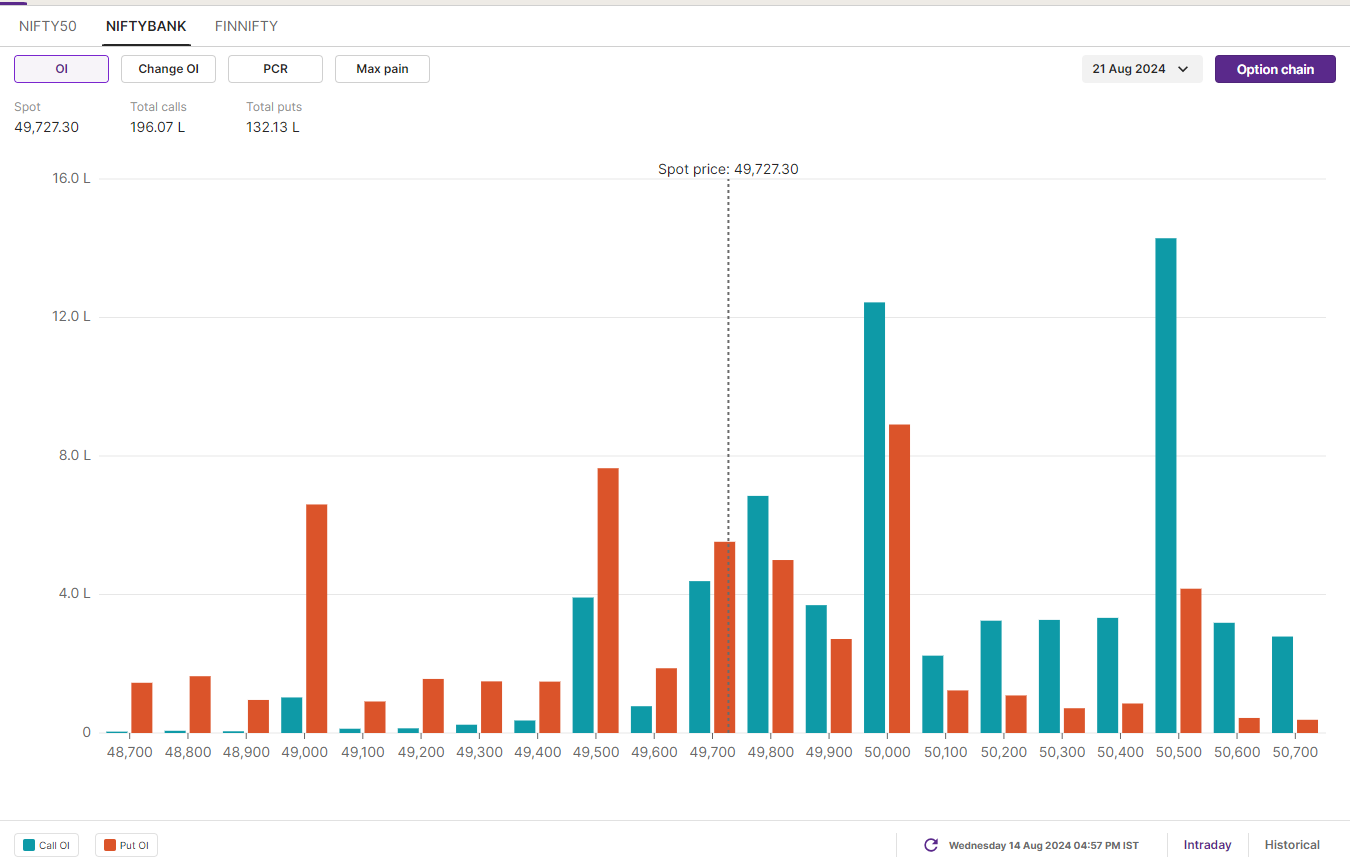
The initial open interest positioning for the 21 August expiry shows the highest call open interest at the 50,500 and 50,000 strike levels, indicating potential resistance around these points. On the other hand, significant put open interest was observed at the 50,000 and 49,500 strikes. This suggests that price action may hover around the 50,000 mark. Traders are advised to closely monitor the weekly close and any shifts in open interest before executing strategies.
FII-DII activity
Stock scanner
Under F&O ban: Aarti Industries, Aditya Birla Capital, Aditya Birla Fashion and Retail, Bandhan Bank, Biocon, Birlasoft, Chambal Fertilisers, Gujarat Narmada Valley Fertilizers & Chemicals (GNFC), Granules India, India Cements, IndiaMART InterMESH, LIC Housing Finance, Manappuram Finance, NMDC, Piramal Enterprises, Punjab National Bank, RBL Bank, Steel Authority of India and Sun TV
Out of F&O ban: Hindustan Copper
In Futures and Options or F&O, long build-up means an increase in Open Interest (OI) along with an increase in price, and short build-up means an increase in Open Interest(OI) along with a decrease in price.
Source: Upstox and NSE.
Disclaimer: Derivatives trading must be done only by traders who fully understand the risks associated with them and strictly apply risk mechanisms like stop-losses. The information is only for consumption by the client and such material should not be redistributed. We do not recommend any particular stock, securities and strategies for trading. The securities quoted are exemplary and are not recommendatory. The stock names mentioned in this article are purely for showing how to do analysis. Take your own decision before investing.
About The Author
Next Story