Market News
Trade setup for April 2: Can NIFTY50 bounce back after gap-down opening?

4 min read | Updated on April 02, 2026, 07:51 IST


SUMMARY
The GIFT NIFTY futures fell over 1% on Thursday morning after President Trump's address indicated further escalation in the Middle East conflict. The chart for NIFTY indicates 22,400 as the next best support on the daily charts, a closing below it would open the gates for 22,000 levels.

GIFT NIFTY futures indicate a sharp gap down opening on Thursday. Image: Shutterstock.
GIFT NIFTY futures indicate a negative start for the day after President Donald Trump said the war in the Middle East will continue for two to three weeks. Following the address, the crude oil prices spiked, and the GIFT NIFTY futures fell over 1% at 6:45 am.
The US markets closed in green ahead of President Trump’s address to the nation later in the day. However, President Trump indicated the war would continue for a few more weeks. Consequently, the US stock market futures fell nearly 1% on Thursday morning due to sour sentiments.
The crude oil prices jumped 5% on Thursday morning after President Trump hinted the war could go on for a few more weeks. The crude oil prices pared all the losses of Wednesday and climbed back above $105 per barrel on Brent crude futures.
Asian markets gave up all the early gains on Thursday morning to trade over 1.5% lower across the board after President Trump’s address. The Korean indices fell by over 2.6%, the most among the Asian peers.
🔎 What matters today
- Implied trading range: 22,100 to 23,400
- OI resistance: 23,500
- OI support: 22,000
- Structure: Rangebound
- Intraday tone: Sideways to bearish
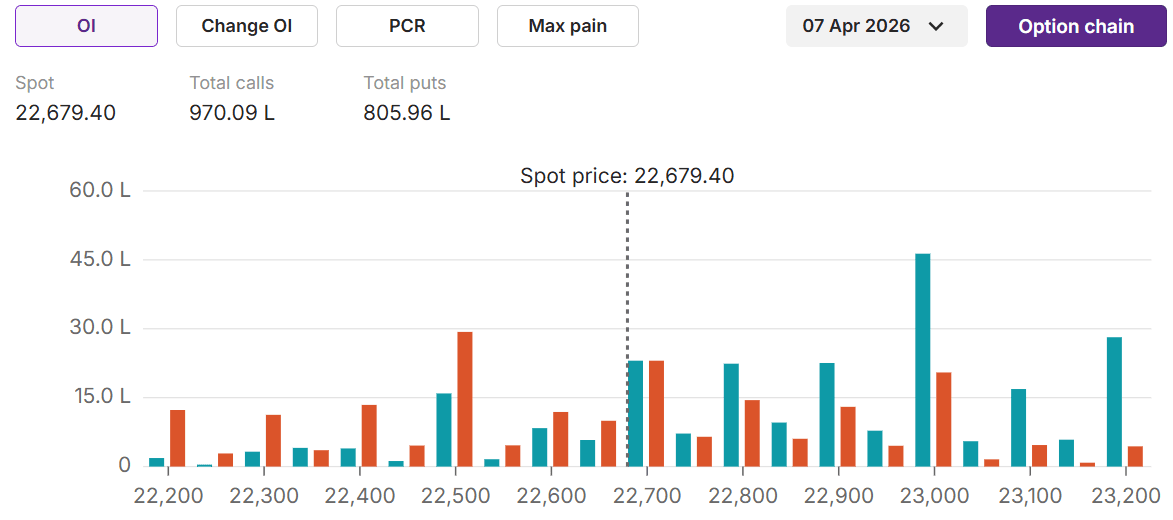
Open Interest- NIFTY50
Positioning
| Trend | Wednesday | Monday |
|---|---|---|
| FIIs index short% (Futures) | 84%🔽 | 85% |
| PCR | 0.83 🔽 | 0.99 |
| OI (23,000 CE strike) | 44 lakh 🔼 | 28 lakh |
💰 Institutional intelligence
Foreign institutional investors (FIIs) kicked off the new financial year on a bearish note, offloading equities worth ₹8,331 crore on April 1. This suggests that their broader stance on the market remains cautious.
Their derivatives positioning reflects the same sentiment. In index futures, FIIs continue to hold net short positions, with a long-to-short ratio of 16:84 for the April series, showing little change from March 30. Net open interest also remains largely steady at -2.64 lakh contracts.
As noted earlier, elevated implied volatility in a holiday-shortened week could lead to short-term consolidation. In this environment, traders should avoid naked option buying. Instead, it’s worth keeping a close eye on any shifts in FII positioning for clear directional cues.
** Expiry: April 7**
- Resistance: 23,300
- Support: 22,300
- Call concentration: 23,500
- Put concentration: 22,000
- Bullish above: 23,300
- Bearish below: 22,300
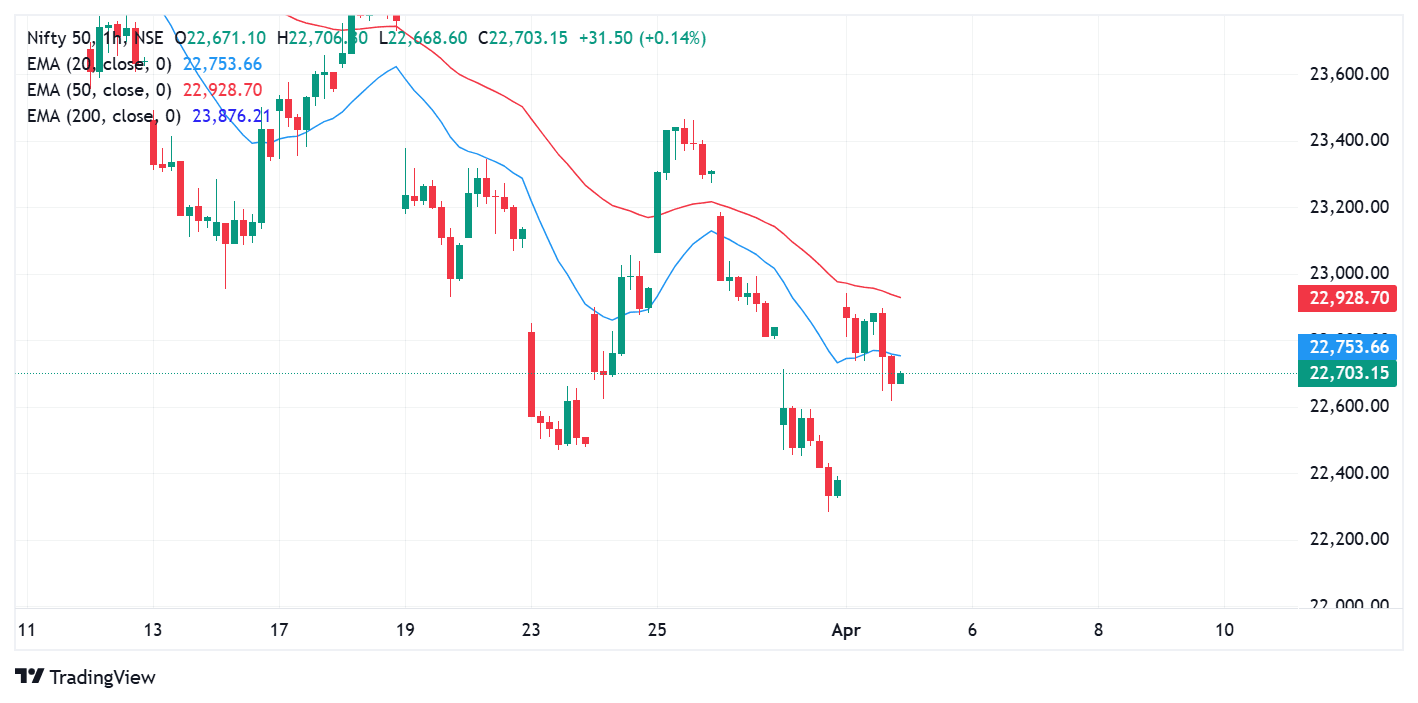
- Price: Below 20 and 50 EMA
- RSI: 46 (Mildly bullish)
- ADX: 28.4 (Trending)
The NIFTY50 index snapped the two-day losing streak by closing over 348 points higher on Wednesday as optimism around talks between the US and Iran boosted the investor sentiment. The index opened over 450 points higher, but failed to hold on to opening gains, paring some gains in the closing hour.
On the hourly charts, the index failed to close above the 20 and 50 EMA levels, indicating a sell-on-rise setup for the intraday trade. In the short term, the index held a strong support of 22,300 and a resistance of 23,000.
In the longer term daily charts, the 23,500 holds strong resistance at the daily 20 EMA levels.
If–then playbook
A sustained close above 23,300 would be the first indication that the index is moving into a range-bound phase. If this holds, NIFTY50 could gradually head higher and retest the key resistance zone near 23,850.
This range coincides with last week’s low as well as the current week’s low, making it a key support area. As long as the index holds above this zone on a closing basis, the short-term trend is likely to remain positive. A decisive close below it, however, could signal a shift in momentum.
About The Author
Next Story


